Disclosure: I founded ChartingLens. It is listed here for the one job it does best, AI chart analysis, and the section on where it falls short is there so you can judge whether it fits how you trade. Every other price comes from that company's own pricing page, checked on November 6 and 7, 2026.
Key takeaways
- TradingView's free plan allows 1 chart per tab, 2 indicators per chart and 3 active price alerts. Paid plans run $12.95 to $199.95 a month on annual billing.
- TrendSpider has no free plan. Standard lists at $54 a month billed annually or $89 month to month, with a Black Friday sale cutting first-year prices in early November 2026.
- TC2000's cheapest plan is now Basic at $24.99 a month. Guides that still quote a $9.99 Silver plan are out of date.
- ChartingLens Free includes automatic chart-pattern drawing and insider trades; Premium is $14.99 a month.
I went through the charting guides that come up most for this question, and the prices in them disagree with each other. One says TradingView's free plan allows five indicators per chart; its own compare table says two. One lists TC2000 at $9.99; its pricing page starts at $24.99. So every price here comes from the vendor's own page, dated, with the sources at the bottom.
There is no ranking below. A Schwab options trader, a swing trader running scans every night and an investor who starts from the balance sheet need different tools, so each platform is listed for the one job it does best. If I were narrowing it down, these would be my top choices.
Best stock charting platforms
TradingView
Best all-around charting
- Excellent charts with 400+ built-in indicators.
- Custom indicators and a large community script library in Pine Script.
- Multiple chart layouts and a full set of drawing tools.
- Stocks, ETFs, futures, forex, crypto and bonds on one login.
Website: tradingview.com
TradingView's pricing page lists 400+ built-in indicators and 150K+ community indicators, and the chart engine is the one other platforms get compared to. It runs in the browser, as a desktop app and on mobile. If your method depends on a specific Pine Script, it is the default.
The plan ladder is the catch. Basic is 1 chart per tab, 2 indicators per chart, 3 price alerts and 1 saved layout. Essential gives 2 charts and 5 indicators, Plus 4 and 10, Premium 8 and 25, Ultimate 16 and 50. Real-time exchange data is a separate subscription, and each plan caps how many you can hold. Prices went up in April 2026, covered in the TradingView price increase, and since November 1, 2026 paid invite-only scripts can only be sold through TradingView's own Marketplace.
Is it worth the price? Is TradingView worth it runs the numbers.
thinkorswim
Best for advanced traders
- Powerful technical analysis with hundreds of studies.
- Advanced options analytics and volume analysis.
- Custom studies in thinkScript.
- Integrated trading and paperMoney paper trading.
Website: schwab.com/trading/thinkorswim
Professional-grade charts on desktop, web and mobile, options analysis that is still the benchmark, futures, paperMoney practice with live market data, and Level II quotes that Schwab says are free for its clients. You can trade straight off the chart. For a Schwab account holder it is the most charting you can get for nothing.
The interface is busy, the learning curve is real, and you cannot log in without the account, so nothing you build travels with you if you change brokers.
Elsewhere? thinkorswim alternatives.
TrendSpider
Best for automated technical analysis
- Automated trendline detection.
- Multi-timeframe analysis on one chart.
- Automated chart pattern recognition.
- Strategy testing, scanners and alerts.
Website: trendspider.com
TrendSpider's pitch is that the software draws the lines: trendlines, Fibonacci levels and patterns are detected for you, several timeframes fold onto one chart, and scanners and bots sit on top. US stocks and ETFs data is included for non-professional users, real-time futures data is $7.50 a month and OPRA options data $9.50, and every plan includes 25 Sidekick AI messages a month.
It is also often described as the only platform that bundles insider, 13F and congressional trading data with the charts. It is not the only one: ChartingLens carries all three. The pricing is the other consideration, with no free tier and a Black Friday sale that only changes the first year. More in is TrendSpider worth it.
Cheaper options: TrendSpider alternatives.
ChartingLens
Best for AI chart analysis
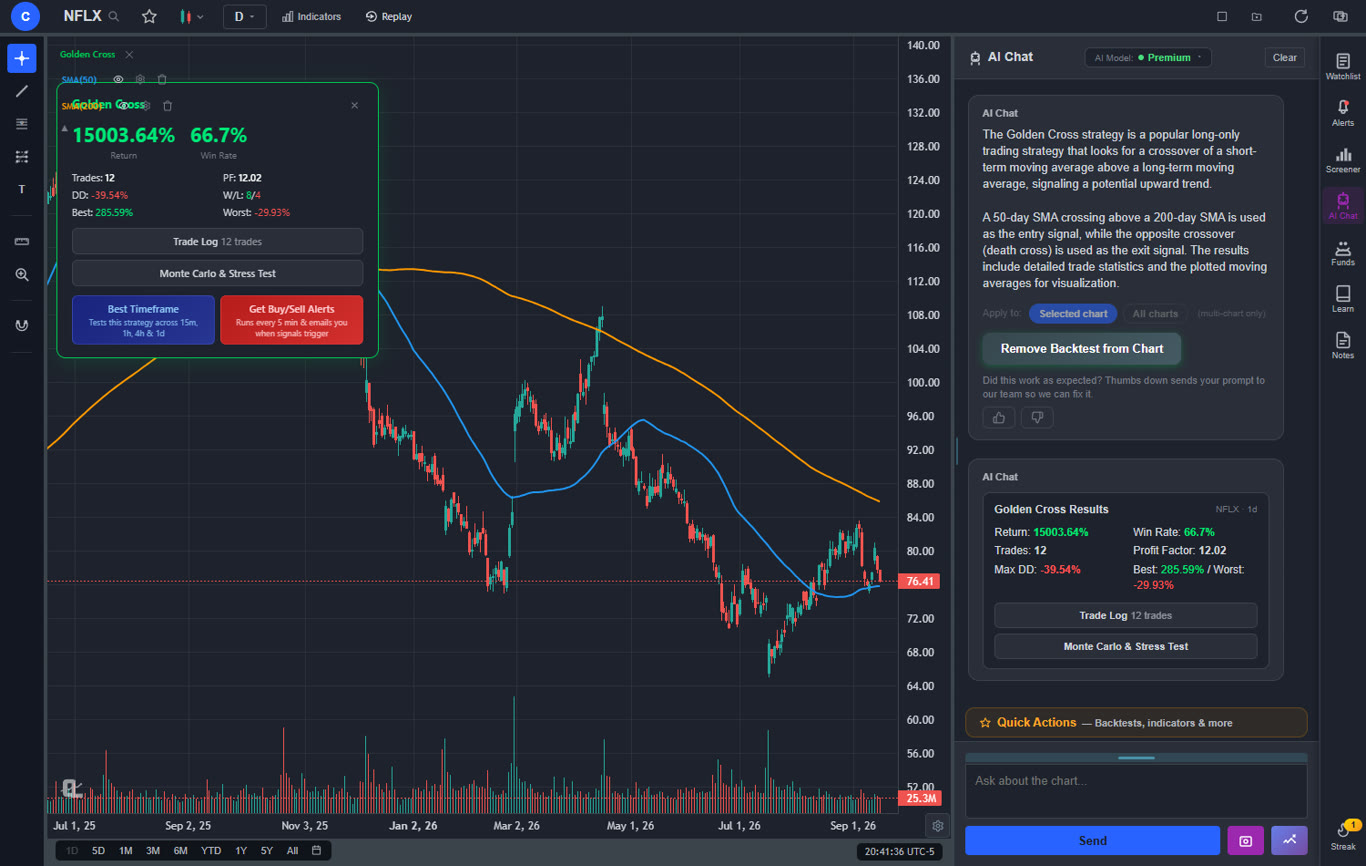
- An AI assistant that reads the chart you are on and answers with a verdict, an entry, a stop and a target.
- Automatic chart-pattern, support and resistance and Fibonacci zone drawing on the free plan.
- A plain-English strategy builder and backtester with a Monte Carlo stress test.
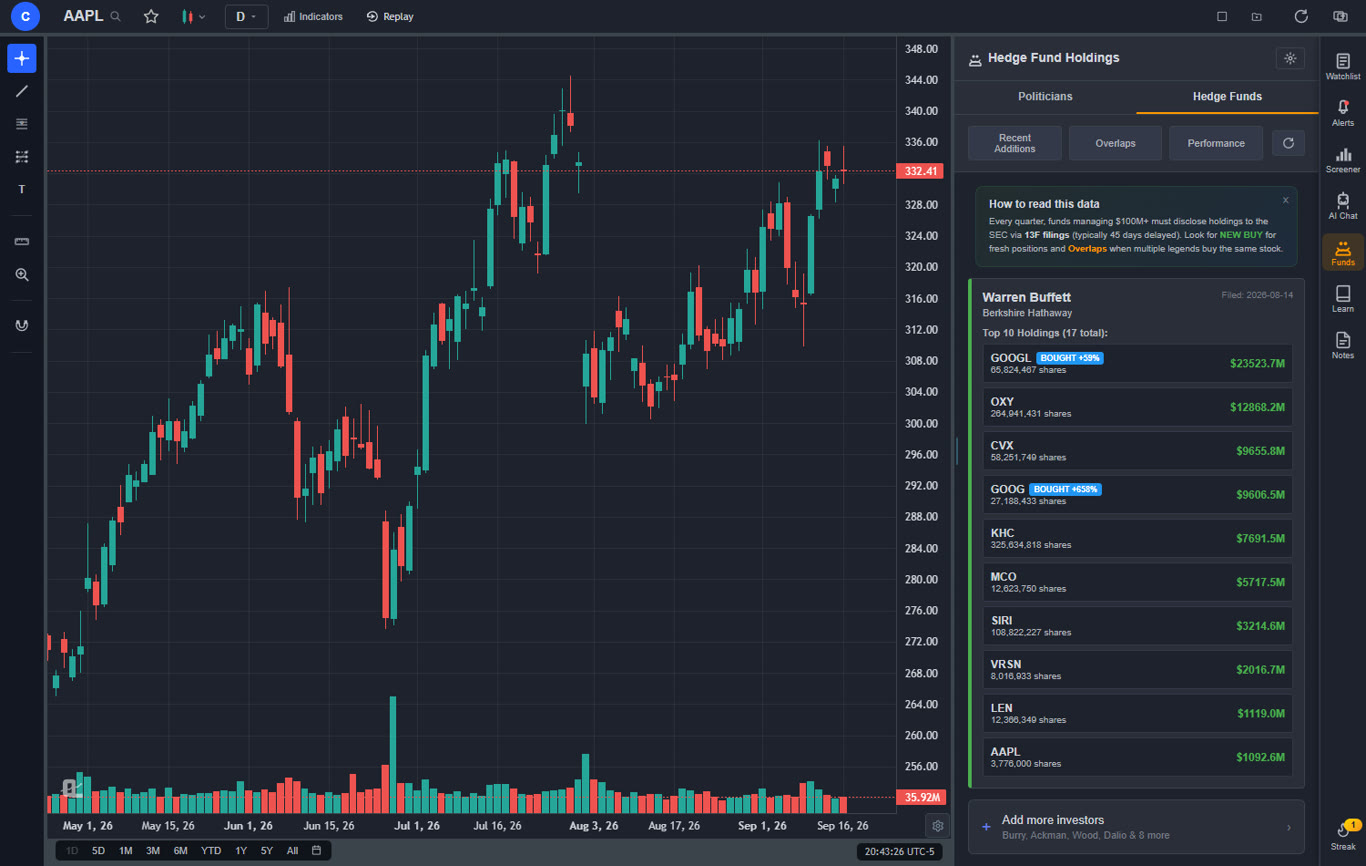
- Insider, 13F and congress trading data next to the chart.
Website: chartinglens.com
ChartingLens is a well-established platform with a large active user base, advanced features, and an institutional-grade strategy builder and backtesting engine. Its job on this list is the analysis. Ask the AI assistant about the chart in front of you and it reads it, marks the levels and gives you a plan; ask it to add indicators, build a strategy or set an alert and it does that on the chart. It runs in the browser and as an iPhone app on the same account, and US stocks and ETFs stream live during the regular session on every plan.
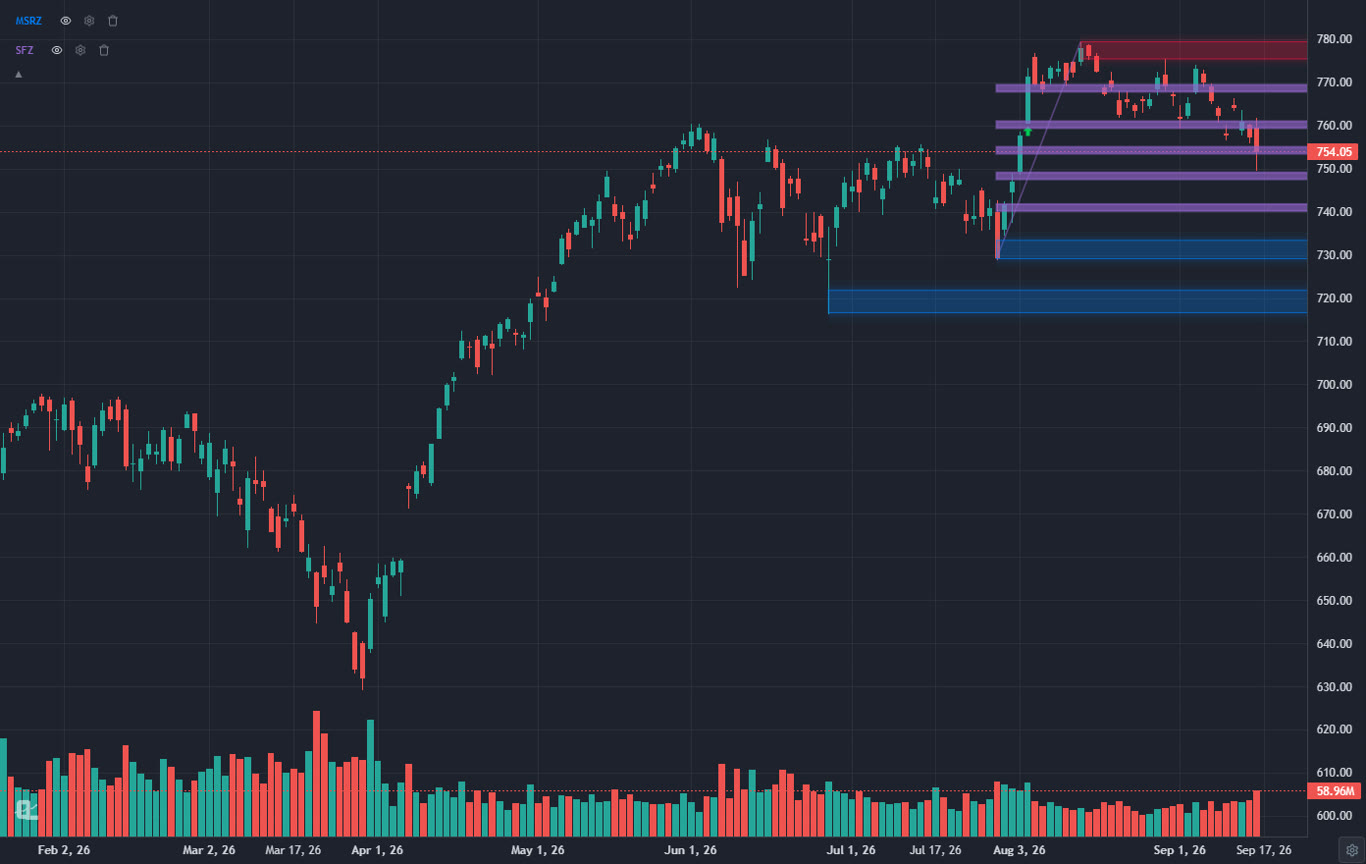
The chart does more of the work than usual. Master Chart Patterns, free, draws double tops, head and shoulders, triangles, wedges, channels and flags; Master S/R Zones and Smart Fib Zones mark the levels, as in the SPY chart above. Then there is the data most chart tools leave out: insider buys and sells from SEC Form 4 filings on every plan, and on Premium the 13F holdings of 20 funds (Berkshire, Scion, Pershing Square and more) and congressional trade disclosures. Pine Script and thinkScript studies can be pasted in and converted on Premium.
Head to head: ChartingLens vs TradingView.
StockCharts
Best for traditional technical analysis
- Classic technical analysis on SharpCharts.
- Point-and-figure charting.
- Market breadth and sector analysis, including Relative Rotation Graphs.
- Strong scanning, with alerts on the paid plans.
Website: stockcharts.com
StockCharts has been the home of traditional technical analysis for a long time, and ChartSchool is still one of the best free technical analysis references online. Every account gets BATS real-time data for US stocks. The free level allows 3 indicators and 3 overlays per chart; Basic raises that to 25 each and adds ChartLists and price alerts. The free trial starts on Extra, and annual billing adds a 13th month free.
The interface feels older than the rest of this list, and there is no AI or pattern automation and no strategy backtesting.
Compare: StockCharts alternatives.
Koyfin
Best for fundamental research
- Financial dashboards you can build yourself.
- Fundamental and valuation data with estimates.
- Economic and market data.
- Side-by-side comparisons of companies and sectors.
Website: koyfin.com
Koyfin is a research terminal for people who start from the numbers. The free plan on its pricing page includes advanced charting, market and macro dashboards, 2 watchlists, 2 screens, 2 custom dashboards and 2 years of financials with 1 year of estimates. Plus opens 10 years of both, the full stock and ETF screener, ETF holdings and transcripts. There are apps for iPhone and Android.
It is not a technical analysis platform. Pattern work and intraday charting are thin, and the useful history sits on the paid plans.
Rivals are in Koyfin alternatives.
How do the best stock charting platforms compare?
The columns buyers actually filter on, from each vendor's own pages on November 6 and 7, 2026:
| Platform | Best for | Markets | Real-time data | Scripting | Free plan | Starting price |
|---|---|---|---|---|---|---|
| TradingView | All-around charting | Stocks, ETFs, futures, crypto, forex, bonds | Exchange data subscriptions, capped per plan | Pine Script | Yes | $12.95/mo billed annually |
| thinkorswim | Advanced traders | Stocks, ETFs, options, futures, forex | Yes, with the account | thinkScript | Free with Schwab | Free |
| TrendSpider | Automated technical analysis | Stocks, ETFs, crypto, forex; futures and options data as add-ons | Included for US stocks (non-professional) | Its own code editor | No | $54/mo billed annually |
| ChartingLens | AI chart analysis | US and international stocks, ETFs, crypto, forex, metals, index and commodity CFDs | US stocks live in the regular session on every plan | Pine Script and thinkScript conversion, plain-English AI indicators (Premium) | Yes | $14.99/mo |
| StockCharts | Traditional technical analysis | US and international stocks, ETFs, indexes | BATS real-time on Free; NYSE and Nasdaq add-on $9.95/mo | Scan language | Yes | $19.95/mo |
| Koyfin | Fundamental research | Global stocks, ETFs, macro data | Not the focus | None | Yes | $39/mo billed annually |
Other platforms worth considering
| Platform | Best use | Free option | Paid from |
|---|---|---|---|
| TC2000 | Advanced stock scanning | No | Basic $24.99/mo ($20.82 billed annually) |
| Finviz | Stock screening and heatmaps | Yes, delayed | Elite $39.50/mo or $299.50/yr |
| Webull | Free charting and mobile trading | Yes, with an account | Level 2 $2.99/mo |
| Interactive Brokers TWS | Professional trading and execution | Platform free with an account | Market data subscriptions |
TC2000 puts its scanner and charts in the same window, and Basic includes a real-time US stock feed; its pricing page no longer shows a free plan or the $9.99 Silver tier older guides still quote. See TC2000 alternatives. Finviz is a screener with charts attached: the heat map is the fastest picture of the day, and Elite adds real-time data including pre-market and after-hours (is Finviz Elite worth it). Webull gives you real-time Nasdaq Basic quotes and decent charts free inside the app that places your orders, with Nasdaq TotalView Level 2 at $2.99 a month (Webull alternatives). Interactive Brokers Trader Workstation is built for execution and routing; clients get free streaming quotes on US stocks and ETFs from Cboe One and IEX, which are not consolidated, and Level 2 is a paid subscription.
My recommendation
If you are starting from scratch, I would shortlist:
- TradingView: best all-around charting experience.
- thinkorswim: best for advanced trading tools, if you bank with Schwab.
- TrendSpider: best for automated technical analysis.
- ChartingLens: best for AI chart analysis, with smart-money data on the same chart.
- Koyfin: best for fundamental research and longer-term investing.
Put your own tickers on two of them for a week. The one you keep opening is the answer.
What is the best free stock charting software?
ChartingLens Free and thinkorswim give away the most, and TradingView's free plan is the tightest of the big names. Here is where each free plan stops, from the vendors' pages:
| Platform | Free plan includes | Main limit |
|---|---|---|
| ChartingLens | Every market, live US charts, pattern drawing, screener, insider trades | 3 indicators per chart, 1 AI credit a day |
| TradingView | Charts, community scripts, screeners | 1 chart per tab, 2 indicators per chart, 3 price alerts |
| thinkorswim | Everything, including Level II | Needs a Schwab account |
| StockCharts | Charts with BATS real-time US data | 3 indicators and 3 overlays per chart; ChartLists and price alerts start on Basic |
| Koyfin | Advanced charting, dashboards | 2 watchlists, 2 screens, 2 years of financials |
| Finviz, Webull | Screener and charts; charts with a Webull account | Finviz data is delayed |
| TrendSpider, TC2000 | No free plan | Paid trials only |
More on this in the best free stock charting software.
Which charting software draws trendlines and patterns for you?
TrendSpider and ChartingLens. TrendSpider built its product around automated trendlines and pattern detection. ChartingLens draws chart patterns, Elliott waves, harmonic patterns and support and resistance zones with indicators like Master Chart Patterns and Master S/R Zones, most of them on the free plan, with Auto Pattern Recognition on Premium. If you want to learn to read the patterns yourself as well, the stock chart patterns guide is a good start.
Which platform puts insider, 13F and congress data next to the chart?
ChartingLens and TrendSpider. In ChartingLens, insider buys and sells from SEC Form 4 filings refresh hourly and are free on every plan; the 13F holdings of 20 funds and the congressional trading disclosures are on Premium. Congressional reports can lag the trade by up to 45 days, and they only show a dollar range, which is worth knowing before you copy anyone. The how-to is in how to track politician stock trades.
What is the best charting platform for day trading?
A chart platform plus your broker. thinkorswim and Interactive Brokers TWS handle Level II and execution, Webull is the cheapest way to get Level 2 on a phone, and ChartingLens gives live US charts on every plan, day trading scanner presets and push alerts on Premium. The phone side of this is covered in the best day trading apps for charts, and the desktop side in the best charting software for day trading.
What is the best charting platform for swing traders and long-term investors?
StockCharts for swing traders who run the same chart routine every evening, with point-and-figure and breadth, and Koyfin for long-term investors who start from the financials. TradingView handles both if you want one tool. ChartingLens fits swing traders who want the patterns drawn and an AI read before they place the trade, plus the 13F filings of the funds they follow. More in the best trading platform for swing trading.
What is the best charting software for futures and options?
thinkorswim for options, and thinkorswim or NinjaTrader for futures. NinjaTrader has a free plan and $99 a month or $1,499 lifetime licenses that lower its futures commissions. TradingView covers futures too, with exchange data as an add-on, and TrendSpider sells real-time futures data for $7.50 a month. ChartingLens does not chart futures contracts or options chains; it covers index and commodity CFDs that track the same underlyings, which is enough to study a setup but not to trade the contract. Others are in NinjaTrader alternatives.
Where ChartingLens falls short
- No futures contracts or options chains. Index and commodity CFDs only.
- No public script marketplace. Pine Script and thinkScript come in by paste-and-convert on Premium.
- No trading. It is broker-agnostic, which also means orders go through your broker.
- Free plan caps. 3 indicators per chart and 1 AI credit a day.
- Not a fundamentals terminal. For 10 years of financials and estimates, Koyfin goes deeper.
Pricing at a glance
| Platform | Free plan | Paid plans |
|---|---|---|
| TradingView | Yes | $14.95 to $239.95 a month, or $12.95 to $199.95 billed annually |
| thinkorswim | Free with Schwab | None |
| TrendSpider | No | $89 to $349 a month, from $54 a month billed annually |
| ChartingLens | Yes | $14.99 or $29.99 a month; $149 or $299 a year |
| StockCharts | Yes | $19.95, $29.95 or $49.95 a month |
| Koyfin | Yes | Plus $39, Premium $79 a month billed annually |
| TC2000 | No | $24.99 to $99.99 a month, $20.82 to $83.32 billed annually |
| Finviz Elite | Yes, delayed | $39.50 a month or $299.50 a year |
| Webull | Free with an account | Nasdaq TotalView Level 2 $2.99 a month |
| Interactive Brokers | Platform free with an account | Market data subscriptions |
How I checked
I read every competitor price and free-plan limit from that company's own pricing or help page: TrendSpider on November 7, 2026, everything else on November 6. TradingView's free limits come from the compare table on its pricing page, and its monthly prices from the monthly toggle. TrendSpider's figures are its regular list prices; its Black Friday sale lowers the first year. Koyfin's prices are the ones its page shows with annual billing. Nothing here is estimated. If I could not confirm it from the vendor, it is not in the table.
Sources
How ChartingLens fits your workflow
ChartingLens is broker-agnostic, so it works with any brokerage and there is no platform lock-in. It is battle-tested at scale, used day to day by a large trader community spanning day traders, swing traders, options traders and long-term investors, and much of what ships comes straight from that community's feedback. The large built-in indicator library, comprehensive multi-asset market coverage and a mature AI-first feature ecosystem sit in one place, and the institutional-grade strategy builder lets you write entry and exit rules, regime filters and stops in plain English, then run them through the backtesting engine. Testing ideas that way is covered in the best backtesting software.
The extensive documentation and learning resources make the ramp short: free Learn courses draw every lesson on a real chart, and how to use ChartingLens walks through every panel. If you also chart on your phone, see the best stock analysis apps. And for a ranking with a different lineup, there is the best stock charting platforms of 2026.
Related Articles
Free Stock Charts: 7 Best Free Charting Software 2026
Only the free plans, compared in depth.
Read article → Day TradingBest Charting Software for Day Trading in 2026
The same question for intraday charts.
Read article → Technical AnalysisBest Technical Analysis Software 2026 (8 Ranked)
For traders who care most about indicators and studies.
Read article →Try the Charting Platform That Reads the Chart With You
Live charts, an AI chart read, pattern drawing, a screener and smart-money data. Free to start, works with any broker.
Start Charting Free →