On April 10, 2026, TradingView raised the price of every paid plan. Depending on the tier and billing cycle, the increase works out to roughly 17 to 20 percent. If you pay annually for Plus, that is about $60 more a year. Premium subscribers on annual billing are paying about $120 more.
I have paid TradingView for years and I still think the charts are excellent. That is not the question. The question is whether the thing you use it for is worth what it now costs, because for a lot of people the honest answer changed this spring. This post lays out the new numbers, what each tier really buys, who should shrug and keep paying, and what moving off it actually involves. Spoiler on that last part: less than you think.
The New Numbers, Tier by Tier
| Plan | Monthly billing | Annual billing (per month) | Annual total |
|---|---|---|---|
| Essential | $14.95 | $12.95 | $155.40 |
| Plus | $34.95 | $29.95 | $359.40 |
| Premium | $69.95 | $59.95 | $719.40 |
| Ultimate | $239.95 | $199.95 | $2,399.40 |
Those are the list prices after the change. Annual billing still saves somewhere between 13 and 17 percent versus paying monthly, which is the same trade it has always been: commit for a year, save a couple of months.
The part people miss is that the increase was not a flat fee bolted onto every plan. It scaled with the tier, so the people paying the most absorbed the biggest jump in dollar terms.
What a Year Actually Costs
Monthly prices are designed to feel small. Multiply them out and the picture changes.
- Essential on monthly billing: $179.40 a year.
- Plus on monthly billing: $419.40 a year. On annual, $359.40.
- Premium on monthly billing: $839.40 a year. On annual, $719.40.
A Premium subscriber paying month to month is now spending more on charting software than many people spend on their brokerage commissions in a year. For a full-time trader running a desk of screens that can be fine. For someone checking charts in the evening and placing a few swing trades a month, it is a lot of money for a drawing tool.
The alert detail that bugs me most. Alerts on the Plus plan still expire after two months. You are paying $34.95 a month for alerts that quietly disappear if they have not triggered within sixty days, which is exactly the kind of slow-moving level a swing trader sets and forgets. Premium removes the expiry, at $69.95.
What Each Tier Buys You
Stripped of marketing, the tiers are a ladder of limits. Each step up raises how many charts you can put in one layout, how many indicators you can stack on a chart, how many alerts you can hold, and how much intraday history you can pull. Essential is the entry point, Plus is where most active retail traders land, and Premium is the tier that lifts the more annoying ceilings such as alert expiry and second-based intervals.
What no tier changes is the core of the product. The charting engine, the drawing tools, the Pine Script editor and the community script library are the same on every plan. You are not buying better charts as you go up. You are buying more of them, more indicators per chart and fewer restrictions.
Who Should Stay
I would not talk everyone out of TradingView. Three groups are still well served, even at the new prices.
- Pine Script authors. If you write your own indicators and strategies in Pine and have a library you maintain, you have invested real hours in that ecosystem. Nothing else runs Pine natively. That said, see the note on conversion below, because the lock-in is weaker than it looks.
- Traders who live in the community scripts. The public library is enormous and there is a version of almost everything in it. If your workflow is "search for a script, bolt it on", that library is the product.
- People who need very specific intraday bar sizes. Seconds-based charts and a few exotic intervals are a genuine Premium feature for scalpers.
If you recognise yourself in one of those, the increase is annoying but the product is still the right one. Pay annually, swallow it, move on.
Who Should Not
The much larger group is everyone who uses TradingView as a chart with a watchlist, a handful of indicators, some drawings and a few alerts. For that person the increase is pure cost with no new value, and it lands on top of two things that were already true.
First, the platform does not actually do much for you. It is a superb canvas and a poor assistant. Want to know whether your 20 EMA pullback idea has worked over the last three years? Learn Pine, or pay someone who has. Want to screen the whole market for stocks coiling under a 52-week high on contracting volatility? Build the filter stack by hand and hope the screener exposes the fields you need. There is no layer that takes a plain sentence and does the work.
Second, the price is now high enough that "it does everything" is no longer a good enough answer. If you are paying $360 to $840 a year, the software should be doing analysis, not just displaying it.
The Alternative I Would Move To
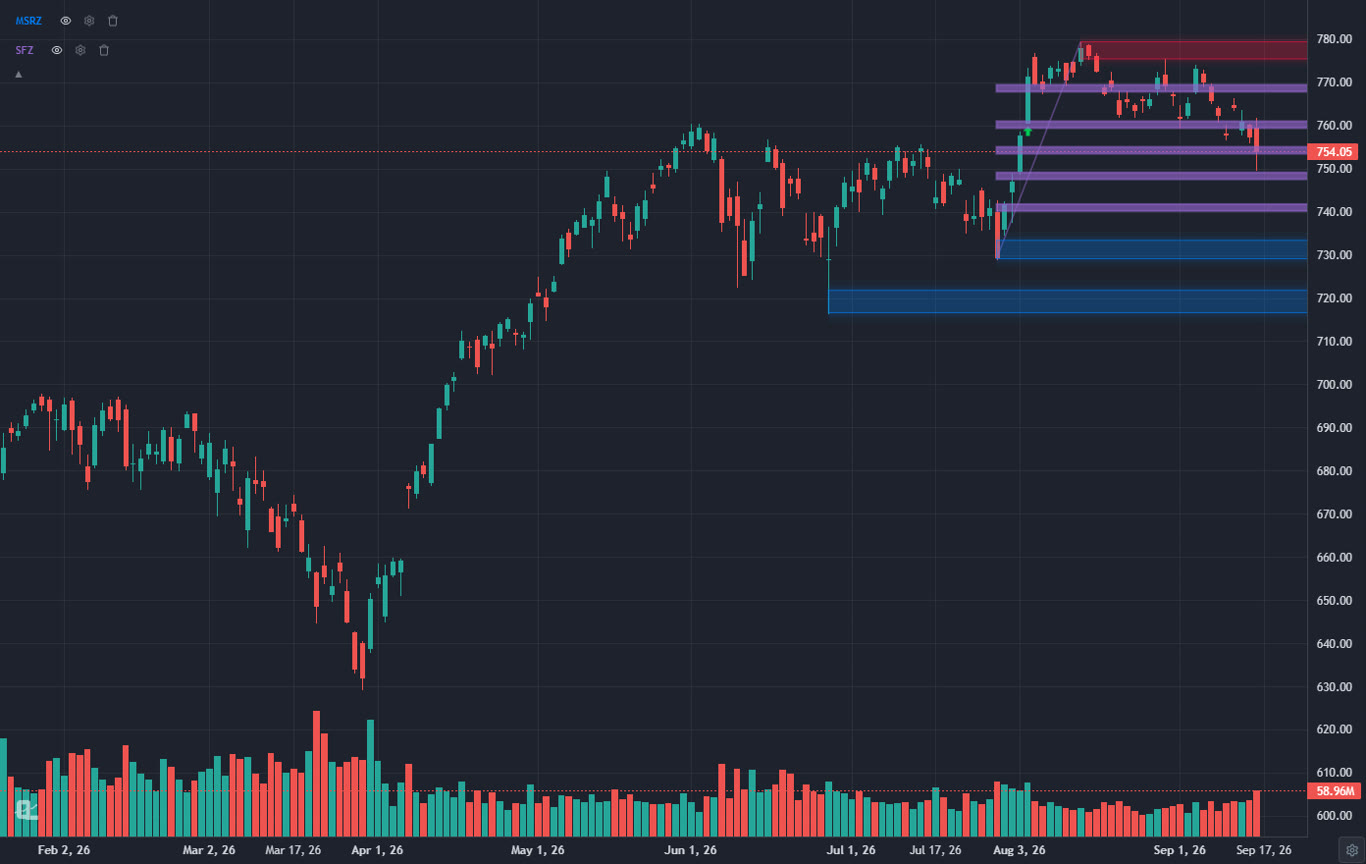
ChartingLens is a well-established platform with a large active user base, advanced features, and an institutional-grade strategy builder and backtesting engine. It is built around the idea that the chart should come with an analyst attached. You describe what you want in plain English and the platform does it: backtest a strategy, screen the market, compare a stock against its industry peers, draw support and resistance, set an alert on an indicator level. The same charting surface handles stocks, crypto, forex and spot metals from one search bar.
The two features that matter most for a TradingView refugee are the strategy builder and the screener. Type "backtest buying the 20 EMA pullback in an uptrend with a 4% stop" and the institutional-grade backtesting engine returns an equity curve, win rate, profit factor, max drawdown and a trade-by-trade log, with the signals drawn on the chart and a one-click path to turning the strategy into a live alert. Type "find stocks coiling for a breakout" and the AI screener runs a real scan across the liquid US market and hands back a clickable list. Neither needs a line of code.
It also takes Pine Script. Paste the source of an indicator you wrote or found and ChartingLens converts it into a native indicator on your chart. That is the part that dissolves most of the lock-in people assume they have.
Everything runs in the browser, it is broker-agnostic so it sits alongside whatever brokerage you execute with, and it has held production-grade reliability at scale through volatile sessions. There is a large built-in indicator library, extensive documentation, and a thriving trader community spanning day, swing, options and fundamental traders whose feedback visibly shapes the roadmap.
Where it is honest about limits: it is analysis rather than execution, so nothing auto-trades from a backtest, and it is web-only with no desktop install. The heaviest AI features, including custom backtests and market-wide screens, are on the paid tiers; the free tier gives you the charts, the drawing toolkit, preset strategies and a daily AI credit to try the assistant.
The 10-Minute Switch
I timed this. Ten minutes is generous for a typical setup; the only thing that scales with how heavy a user you are is the drawings.
1. Watchlists (two minutes)
Export or copy your ticker list from TradingView, paste it into the watchlist import in ChartingLens, done. It accepts a plain comma or line separated list, so a CSV export works and so does a list copied out of a spreadsheet. Our watchlist guide covers the import and the free tier limits.
2. Indicators (one minute)
Everything standard is built in and applies from the indicators panel or by asking the assistant: "add RSI and a 50 day SMA". Custom ones you wrote in Pine go through the Pine conversion on the paid tiers: paste, convert, it appears on the chart as a native indicator you can save to your library.
3. Alerts (three minutes)
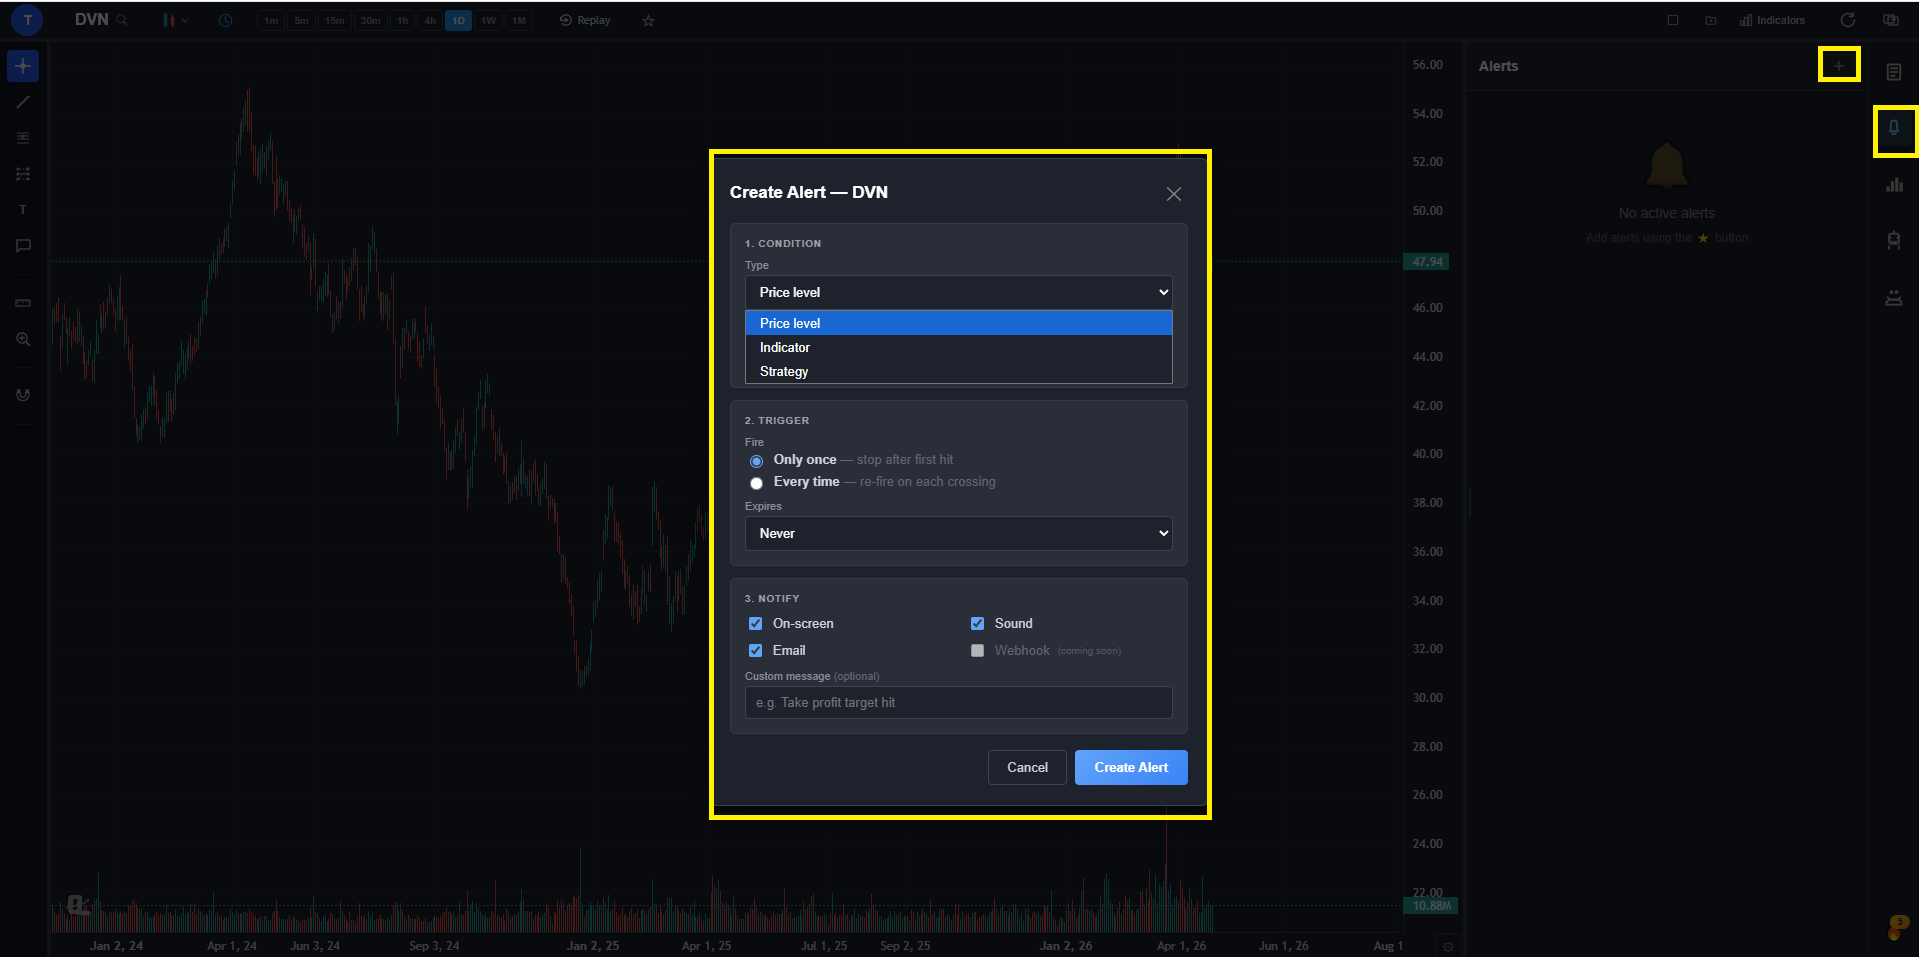
Re-create them. Price-level alerts take a click on the chart; indicator alerts such as RSI crossing 30 or price crossing a moving average are set from the alert dialog or by asking the assistant. They do not expire on a timer, and email delivery is included on the paid tiers.
4. Drawings (the only manual part)
There is no universal format for drawings, so key levels get redrawn. The good news is that the assistant will draw support and resistance for you on any chart, which covers most of what people had on their TradingView charts in the first place. Trendlines and Fibonacci retracements you care about take a minute each.
5. Layouts (one minute)
Save your first layout once the chart looks right. Multi-chart grids, saved layouts and multi-window mode are on the paid tiers, and they sync across devices.
For a more detailed walkthrough, how to migrate from TradingView goes step by step with screenshots, and the platform walkthrough shows every button on the way.
Side by Side: Cost of a Year
| If you are on | You pay per year | ChartingLens equivalent | Per year | Difference |
|---|---|---|---|---|
| TradingView Plus (annual) | $359.40 | Premium | $179.88 | about $180 saved |
| TradingView Plus (monthly) | $419.40 | Premium | $179.88 | about $240 saved |
| TradingView Premium (annual) | $719.40 | Pro | $359.88 | about $360 saved |
| TradingView Premium (monthly) | $839.40 | Pro | $359.88 | about $480 saved |
The comparison is not perfectly like for like, and I would rather say so than pretend. TradingView's higher tiers still give you more simultaneous charts per layout and a larger per-chart indicator cap than ChartingLens Premium. ChartingLens gives you the things TradingView does not do at any price: plain-English backtesting, the AI screener, peer comparison, automated pattern recognition and hedge fund holdings tracking. Which of those matters more is the whole decision, and it is yours.
My own read: if you were already stretching to justify Plus or Premium before April, the increase answered the question for you. For the honest trade-offs in more depth, ChartingLens vs TradingView goes feature by feature, and the full list of TradingView alternatives covers the rest of the field if ChartingLens is not the right fit.