Disclosure: I founded ChartingLens, and it is ranked first here for the jobs described below. The section on where it falls short is there so you can decide whether it fits how you invest. Every other price on this page comes from that company's own pricing page, checked on November 6, 2026.
Ask for the best stock app and you mostly get a list of brokers. Fair enough, since a broker app is where your money sits. But a broker app is built to take orders. The analysis, the part where you decide whether NVDA is extended or AAPL is sitting on support, usually happens somewhere else.
This list is about that somewhere else. Six apps, each picked for a different job, with the free plan limits spelled out because that is where most of them quietly differ. If you mostly care about drawing on charts with a finger, the narrower best stock chart app for iPhone test goes deeper on that.
Which stock analysis app should you use?
Pick by the job you open the app for. Here is the short version:
| App | Best for | Free plan | Paid from |
|---|---|---|---|
| ChartingLens | AI chart analysis, with a screener and smart-money data | Yes | $14.99/mo |
| TradingView | Community indicators and scripts | Yes (1 chart, 2 indicators) | $12.95/mo billed annually |
| Koyfin | Financials, estimates, dashboards | Yes | $39/mo billed annually |
| Simply Wall St | Visual company reports | 5 reports a month | $10.95/mo billed annually |
| thinkorswim | Analysis inside a Schwab account | Free with Schwab | Free |
| Webull | Quotes and charts where you trade | Free Level 1 | Level 2 $2.99/mo |
Do you still need your broker's app?
Yes, for placing orders. ChartingLens, TradingView, Koyfin and Simply Wall St do not execute trades, so the order still goes through Schwab, Fidelity, Webull, Robinhood or whoever holds your account. thinkorswim and Webull are the two picks here that do both.
That split is not a weakness. It is how most people who analyze stocks seriously end up working: the broker app for the buy button, a separate app for the thinking. You can switch brokers next year and keep every chart, watchlist and alert. The best tools for trading stocks post covers the rest of that setup.
The 6 best stock analysis apps, ranked
1ChartingLens: Best for AI chart analysis on your phone
Best for: Anyone who wants charts, a screener, an AI second opinion and smart-money data without paying for four apps.
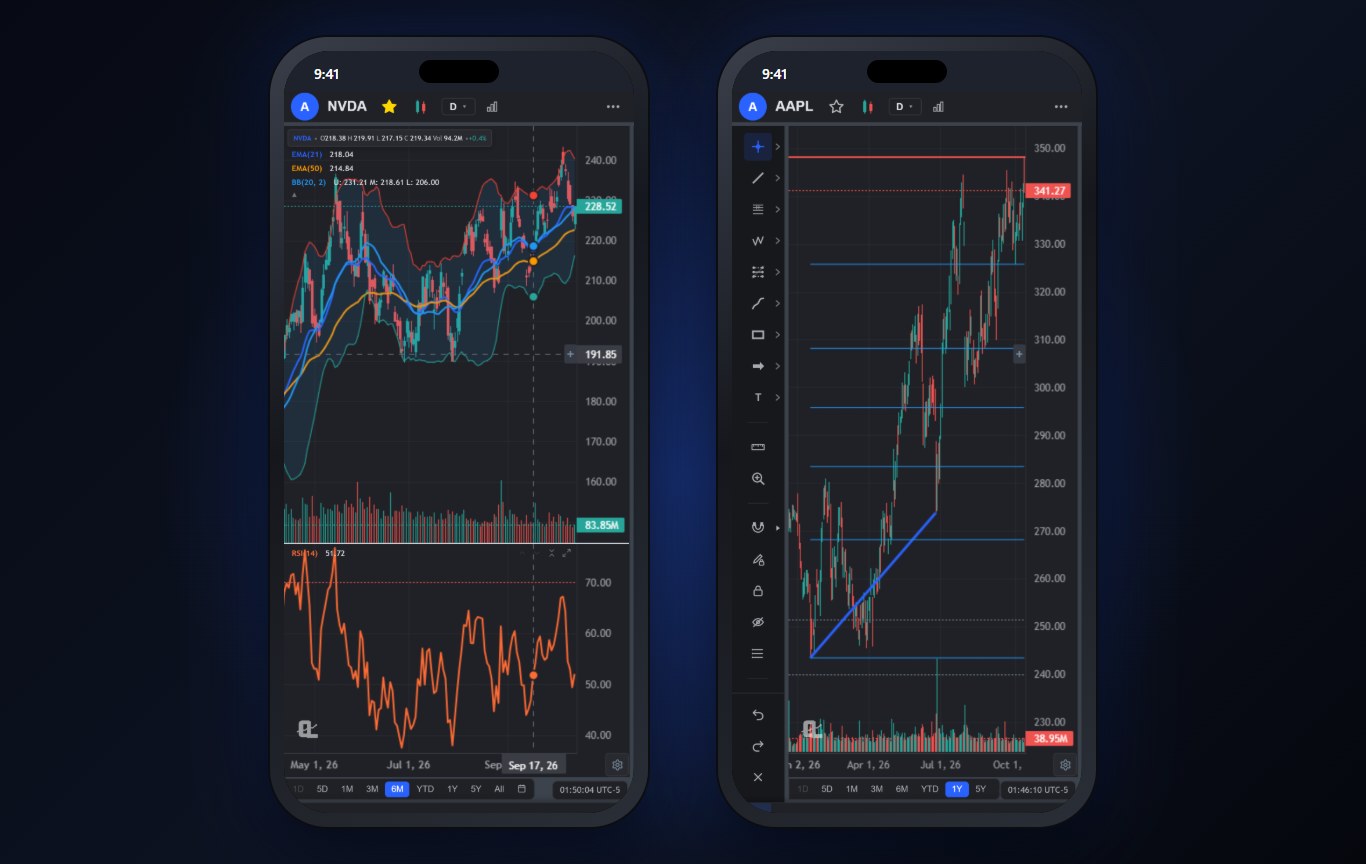
ChartingLens is a well-established platform with a large active user base, advanced features, and an institutional-grade strategy builder and backtesting engine, and the iPhone app is the same platform rather than a cut-down companion. US stocks and ETFs stream live during the regular session, tick by tick. Pre-market and after-hours candles are on Premium.
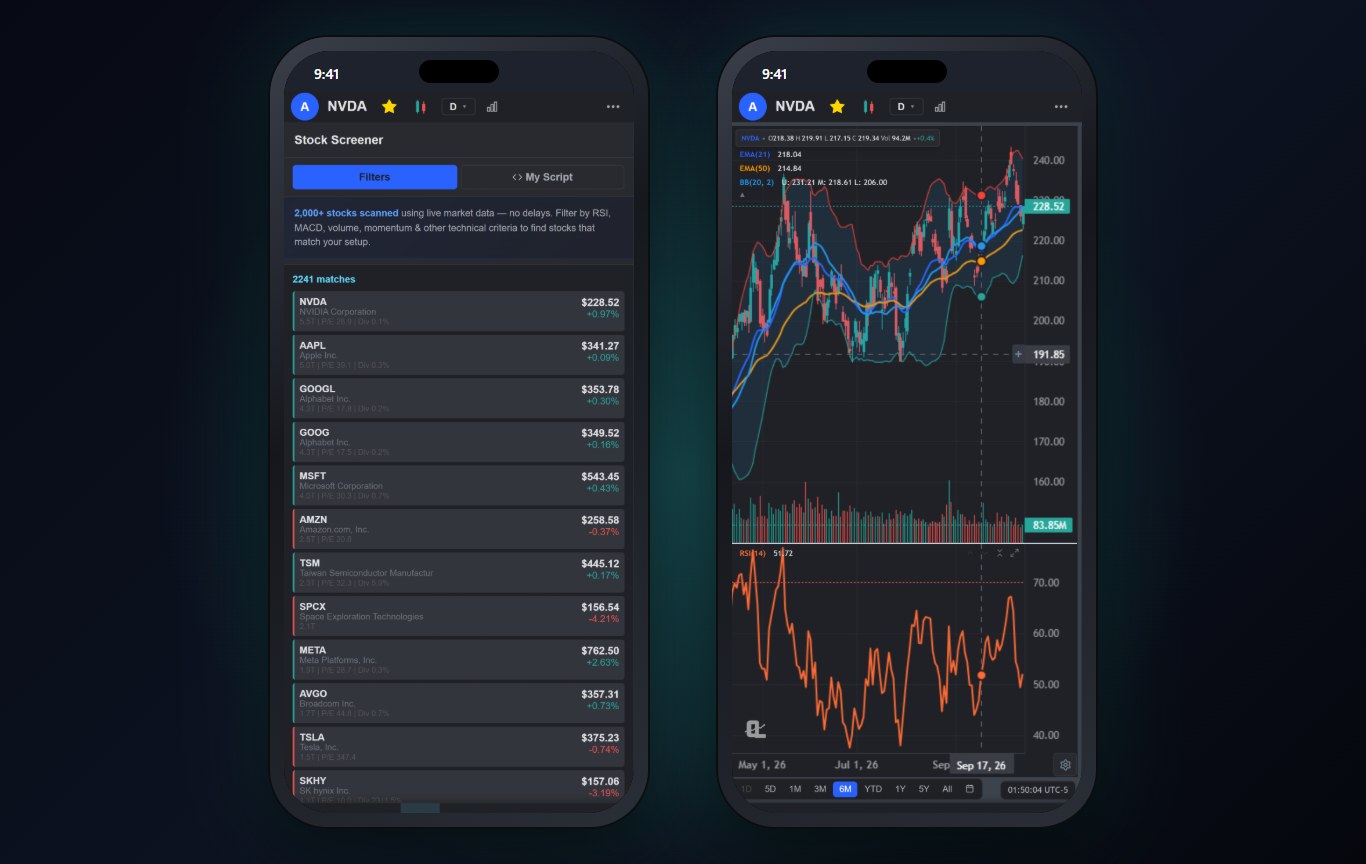
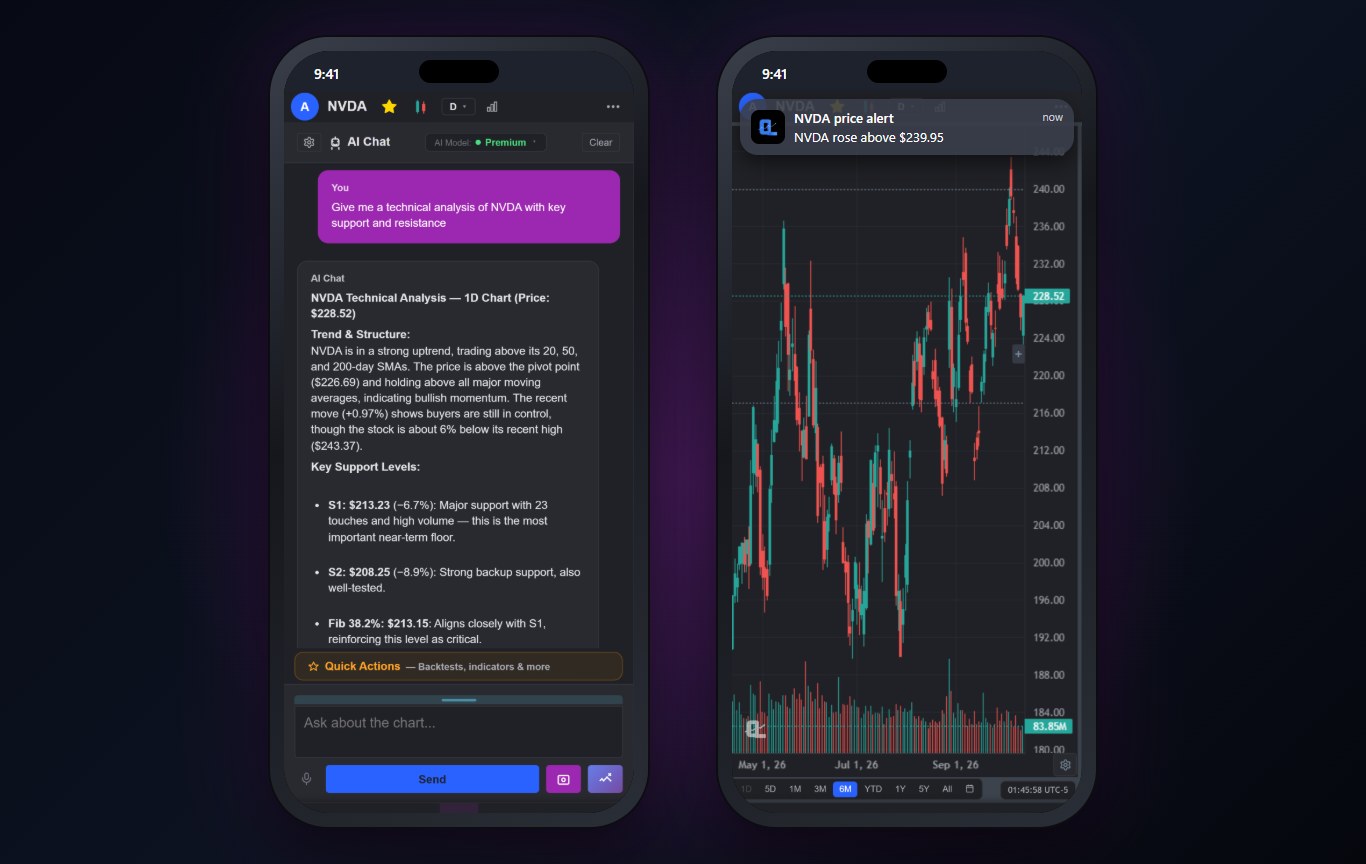
The part I would point a new user at first is pattern drawing. Add Master Chart Patterns, which is free, and the app draws double tops, head and shoulders, triangles, wedges, channels and flags on the chart for you. Ask the AI assistant "where is support on NVDA?" and it reads the chart you are on and answers with levels, a stop and a target. The screener runs on the phone too, and a tap on a result opens its chart.
The data layer is broader than a chart app usually carries: insider buys and sells from SEC Form 4 filings refreshed hourly on every plan, plus 13F holdings for 20 funds (Berkshire, Scion, Pershing Square and more) and congressional trade disclosures on Premium. All of it sits in a large built-in indicator library and comprehensive multi-asset market coverage: US and international stocks, ETFs, crypto, forex, metals and index and commodity CFDs.
2TradingView: Best for community scripts
Best for: Chart traders whose method depends on Pine Script indicators.
TradingView's pricing page lists 400+ built-in indicators and 150K+ community indicators, and nothing else comes close on that second number. If a setup you follow depends on one specific community script, this is where it lives, on web, desktop and a polished mobile app.
The free Basic plan is tighter than people expect. When I checked its compare table on November 6, 2026, Basic allowed 1 chart per tab, 2 indicators per chart, 3 active price alerts, 1 saved layout and a single watchlist of 30 symbols. Essential lifts that to 2 charts and 5 indicators. Prices rose in April 2026; the TradingView price increase post has the old and new numbers.
More in is TradingView worth it.
3Koyfin: Best for fundamentals and estimates
Best for: Long-term investors who read balance sheets.
Koyfin is a research terminal for people who start from the numbers. Financials, estimates, valuation history and market dashboards are the core, and its app is on both the App Store and Google Play.
The free plan on Koyfin's pricing page includes advanced charting, 2 watchlists, 2 screens, 2 custom dashboards and 2 years of financials with 1 year of estimates. Plus opens 10 years of both, the full stock and ETF screener and transcripts.
Rivals are in Koyfin alternatives.
4Simply Wall St: Best for visual company reports
Best for: Beginner investors researching a handful of companies.
Simply Wall St turns a company's financials into its snowflake graphic and plain-language checks on valuation, growth, health and dividends. For someone who finds an income statement intimidating, it is the friendliest way in, and it runs on iOS and Android.
It is a reading app, not a charting one. You will not draw a trend line or time an entry here, and the free plan stops at 5 company reports a month.
5thinkorswim: Best broker app for analysis
Best for: Schwab clients who trade options.
thinkorswim mobile packs a lot of the desktop platform into the phone: studies, options chains, paperMoney practice with live market data, and Level II quotes, which Schwab says are free for its clients. If your account is already at Schwab, that is a lot of analysis for $0.
You need the Schwab account to log in, the interface takes a while to learn, and nothing you build there travels with you if you move brokers.
See thinkorswim alternatives if you are elsewhere.
6Webull: Best for free quotes where you trade
Best for: Webull customers who want charts next to the buy button.
Webull's app gives you real-time Nasdaq Basic quotes, decent charts and paper trading at no cost, right inside the app that places your orders. Its help center lists Nasdaq TotalView Level 2 at $2.99 a month, and new users are offered a free first month.
As an analysis tool it is fine rather than deep: no custom scripting, no pattern drawing, and the research is built around getting you to trade.
Compare it in ChartingLens vs Webull.
Which stock analysis app is free?
All six have a free option, but they stop in very different places. These limits come from each company's pricing page on November 6, 2026:
| App | What the free plan gives you | Where it stops |
|---|---|---|
| ChartingLens | Every market, live US charts, automatic pattern drawing, the screener, insider trades | 3 indicators per chart, top 10 screener matches, 1 AI credit a day, alerts only while the app is open |
| TradingView | Its charts, community scripts and screeners | 1 chart per tab, 2 indicators per chart, 3 price alerts, 1 watchlist of 30 symbols |
| Koyfin | Advanced charting, market dashboards | 2 watchlists, 2 screens, 2 years of financials |
| Simply Wall St | Visual company reports | 5 reports a month |
| thinkorswim | The full platform, Level II, paperMoney | Needs a Schwab account |
| Webull | Level 1 quotes, charts, paper trading | Level 2 costs $2.99 a month |
If free is the deciding factor, ChartingLens and thinkorswim give away the most analysis, and thinkorswim only does it if you bank with Schwab. The best free stock charting software post goes through the desktop side of the same question.
Which app is best for charts on a phone?
ChartingLens or TradingView, and the tie-breaker is what you need the chart to do. TradingView has the community scripts. ChartingLens draws chart patterns for you on the free plan, reads the chart with AI, and lets you set alerts on a trend line rather than only on a price.
On Premium, ChartingLens checks price, indicator, trend line and preset-strategy alerts on its servers every 5 minutes, so they reach your iPhone as a push notification with the app closed. That one detail decides it for a lot of people who do not want to stare at a phone. The best stock alert app comparison tests exactly that.
Which app is best for fundamentals and company research?
Koyfin for depth, Simply Wall St for readability. Koyfin gives you ten years of financials and estimates on Plus. Simply Wall St explains the same kind of data in pictures.
ChartingLens sits in between: a company financials panel next to the chart, insider trades on every plan, and the 13F and congress data on Premium. If what you want is "who is buying this stock?", that is usually faster than reading statements. The insider and superinvestor tracking guide shows how people use it.
What is a phone bad at for stock analysis?
A few things, whatever app you pick. Comparing several charts side by side is cramped on a six-inch screen. Long research sessions are tiring. And building or backtesting a strategy is better done on a desktop or laptop, then carried to the phone as alerts.
The phone is excellent at alerts, quick checks, scanning for what moved today, and acting on a level you already planned. Pick an app that is great at those, and make sure it syncs with the desktop version you do the heavy work on. ChartingLens, TradingView and Koyfin all run the same account across web and phone.
Where ChartingLens falls short
- No trading. It is an analysis app. Orders go through your broker.
- Android is still in review. The iPhone app is on the App Store. The Android app is in review on Google Play, and until it is approved Android users run ChartingLens in the phone's browser.
- No options chains or options flow. thinkorswim is the better tool for options analysis.
- No public script marketplace. Pine Script comes in by pasting it and converting it (Premium), not from a shared library like TradingView's.
- Free plan caps. 3 indicators per chart, 1 AI credit a day, and alerts that only fire while the app is open.
Pricing at a glance
| App | Free option | Cheapest paid plan | Places trades? |
|---|---|---|---|
| ChartingLens | Yes | $14.99/mo or $149/yr | No |
| TradingView | Yes | $14.95/mo, or $12.95/mo billed annually | Through connected brokers |
| Koyfin | Yes | $39/mo billed annually | No |
| Simply Wall St | Yes | $10.95/mo billed annually | No |
| thinkorswim | Free with Schwab | Free | Yes |
| Webull | Yes | Level 2 data $2.99/mo | Yes |
How I checked
Every competitor price and free-plan limit above was read from that company's own pricing or help page on November 6, 2026. Where a page only showed annual billing, the table says so. TradingView's free-plan limits come from the compare table on its pricing page. I left out apps whose current prices I could not confirm from the vendor rather than guess them. ChartingLens screenshots are real screens from the iPhone app.
Sources
How ChartingLens fits next to your broker
ChartingLens is broker-agnostic, so it works with any brokerage and there is no platform lock-in: the charts, alerts and watchlists stay put when you change where you trade. It is battle-tested at scale, used day to day by a large trader community spanning swing traders, day traders, options traders and long-term investors, and a lot of what ships comes straight from that community's feedback. Under the AI chat sits a mature AI-first feature ecosystem, including plain-English strategies run through the institutional-grade backtesting engine.
If you are new, the extensive documentation and learning resources help: the free Learn courses draw every lesson on a real chart, and how to use ChartingLens walks through every panel. For the desktop side of this decision, see the best stock charting platforms, and if you trade intraday, the best day trading apps for charts.
Related Articles
Best Stock Chart App for iPhone (2026 Tested)
The finger-drawing test: seven chart apps on the same three tasks.
Read article → AppsBest Stock Screener App for iPhone in 2026
If scanning is the main job you open the app for.
Read article → AppsBest Stock Alert App With Push Notifications
Which apps really alert you with the app closed.
Read article →Try the Analysis App Next to Your Broker
Live charts, pattern drawing, a screener and an AI chart read, free to start. Works with any broker.
Start Charting Free →