Day trading is a high-speed discipline where every second matters. Unlike swing traders who can study charts overnight or long-term investors who check their portfolio once a week, day traders need their charting software to keep up with the pace of the market in real time. If you are still refining your approach, our day trading strategies for beginners guide is a good starting point. A chart that lags, a platform that freezes during a volatile open, or an indicator that takes five seconds to recalculate can mean the difference between a profitable trade and a missed opportunity.
The best charting software for day trading delivers four things without compromise: speed, real-time data, robust technical indicators, and a lightweight interface that does not bog down your machine. You need candlestick charts that update tick by tick. You need indicators like VWAP, RSI, MACD, and Bollinger Bands that render instantly across multiple timeframes. And you need all of this without installing bloated desktop software that consumes half your RAM before the market even opens.
In 2026, the landscape of day trading charting tools has evolved significantly. Cloud-based platforms now rival desktop applications in speed. AI-powered features can scan thousands of stocks for setups faster than any human. And the best part: several of these platforms offer their core features completely free. Whether you are searching for the best technical analysis software, looking for real-time stock charts free of charge, or hunting for free candlestick chart software that actually performs, this guide covers every option worth considering.
We tested ChartingLens against the five most popular alternatives head-to-head, evaluating each specifically from a day trading perspective. We measured chart rendering speed, indicator performance on sub-minute timeframes, data latency, and overall usability during fast-moving market conditions. Here is what we found.
What Makes Great Day Trading Software?
Before diving into individual platforms, it is worth understanding the specific criteria that separate great day trading charting software from tools that are merely adequate. Day trading places unique demands on a charting platform, and what works for a buy-and-hold investor often falls short for someone executing multiple trades per session.
Real-Time Data Feed
Charts must update tick by tick with zero perceptible delay. Delayed data, even by 15 minutes, is completely unusable for day trading.
Chart Rendering Speed
Switching between tickers, timeframes, or indicator combinations should be instantaneous. Any lag during volatile moments creates risk.
Indicator Depth
Day traders need VWAP, EMA, RSI, MACD, Bollinger Bands, and volume profiles at minimum. Stacking multiple indicators on one chart is essential.
Lightweight Architecture
The platform should not consume excessive CPU or memory. Day traders often run multiple charts, a news feed, and a broker platform simultaneously.
Candlestick Pattern Recognition
Automatic detection of doji, engulfing, hammer, and other reversal patterns saves critical time during fast-moving sessions.
AI-Powered Scanning
The ability to scan the entire market for setups in real time gives day traders an edge that manual chart review simply cannot match.
Timeframe flexibility is another critical factor. Day traders frequently switch between 1-minute, 5-minute, 15-minute, and hourly charts to confirm setups across multiple timeframes. A platform that makes this cumbersome or slow is a platform you will eventually abandon.
Drawing tools and annotation matter more than many beginners realize. Trendlines, horizontal support and resistance levels, Fibonacci retracements, and volume profile zones are core to most day trading strategies. These tools need to be responsive, snap to price levels accurately, and persist across sessions.
Finally, consider total cost of ownership. Day trading already involves risk capital, commissions, and data feed costs. Your charting software should not be another significant expense. The best platforms in 2026 offer powerful free tiers or extremely affordable premium upgrades, letting you allocate your capital where it matters most: in your trades.
Quick Comparison: Best Day Trading Charting Software
Here is a high-level comparison of ChartingLens against the top 5 day-trading charting platforms we tested, evaluated through the lens of day trading requirements.
Scroll horizontally to see all columns →
Feature
ChartingLens
TradingView
thinkorswim
TrendSpider
NinjaTrader
Sierra Chart
Real-Time Data (Free)
✓
✓
✓
✗
Sim only free
Paid feed
Free Indicators
15+
1 per chart
100+
Paid only
100+
Deep, paid
AI Buy/Sell Signals
✓
✗
✗
Paid
✗
✗
Auto Pattern Recognition
✓
✗
✗
✓
✗
✗
Bar Replay
Premium
✓
✗
✓
Market Replay
✓
Volume Profile (VRVP)
Premium
Plus+
✗
✗
✓
Best-in-class
Order Flow / DOM
✗
✗
Basic
✗
SuperDOM
Best-in-class
Lightweight / Browser-Based
✓
✓
Desktop app
✓
Desktop app
Desktop app
Drawing Tools
✓
✓
✓
✓
✓
✓
Insider Trading Data
✓
✗
✗
✗
✗
✗
Custom Scripting
✗
Pine Script
thinkScript
✗
NinjaScript
ACSIL
No Ads (Free Tier)
✓
✗
✓
✓
✓
✓
Paid Plan Starting Price
$14.99/mo
$14.95/mo
Free (account req.)
$33/mo
Free / $1,499 lifetime
From $36/mo
Top Charting Platforms for Day Trading: In-Depth Reviews
1. ChartingLens — Best Overall for Day Trading
ChartingLensFree + $14.99/mo Premium
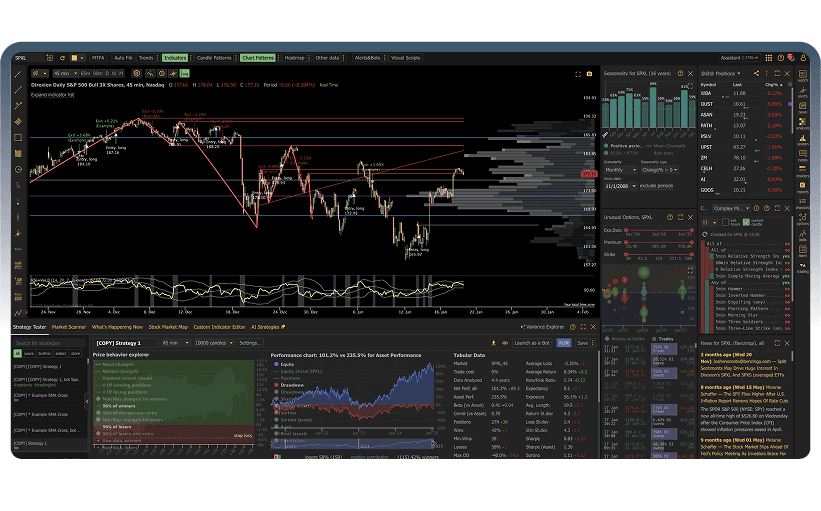
ChartingLens earns the top spot for day trading because it delivers exactly what intraday traders need: real-time charts that load instantly, a full suite of technical indicators on the free tier, and AI-powered features that actively help you find and confirm setups. Built entirely as a browser-based platform, there is nothing to download or install. You open a tab, type a ticker, and you are charting within seconds.
The platform includes over 40 technical indicators out of the box, including day trading staples like VWAP, EMA (multiple periods), RSI, MACD, Bollinger Bands, Stochastic, ATR, and volume overlays. Unlike TradingView, which limits free users to a single indicator per chart, ChartingLens lets you stack as many indicators as you need on the free tier. For day traders running multi-indicator strategies, this alone is a decisive advantage.
Where ChartingLens truly separates itself is its AI engine. The platform offers AI-powered buy and sell signals that scan over 2,000 stocks in real time to identify high-probability setups. It includes automatic candlestick pattern recognition, so you do not have to manually spot doji, engulfing, or hammer patterns during a fast session. The AI trading assistant lets you ask natural-language questions about any stock or chart. And the proprietary CL Score rates stocks using machine learning, giving you a quick confidence gauge before entering a trade. These AI features are included on the free tier, which is remarkable given that competitors charge $22 or more per month for similar functionality.
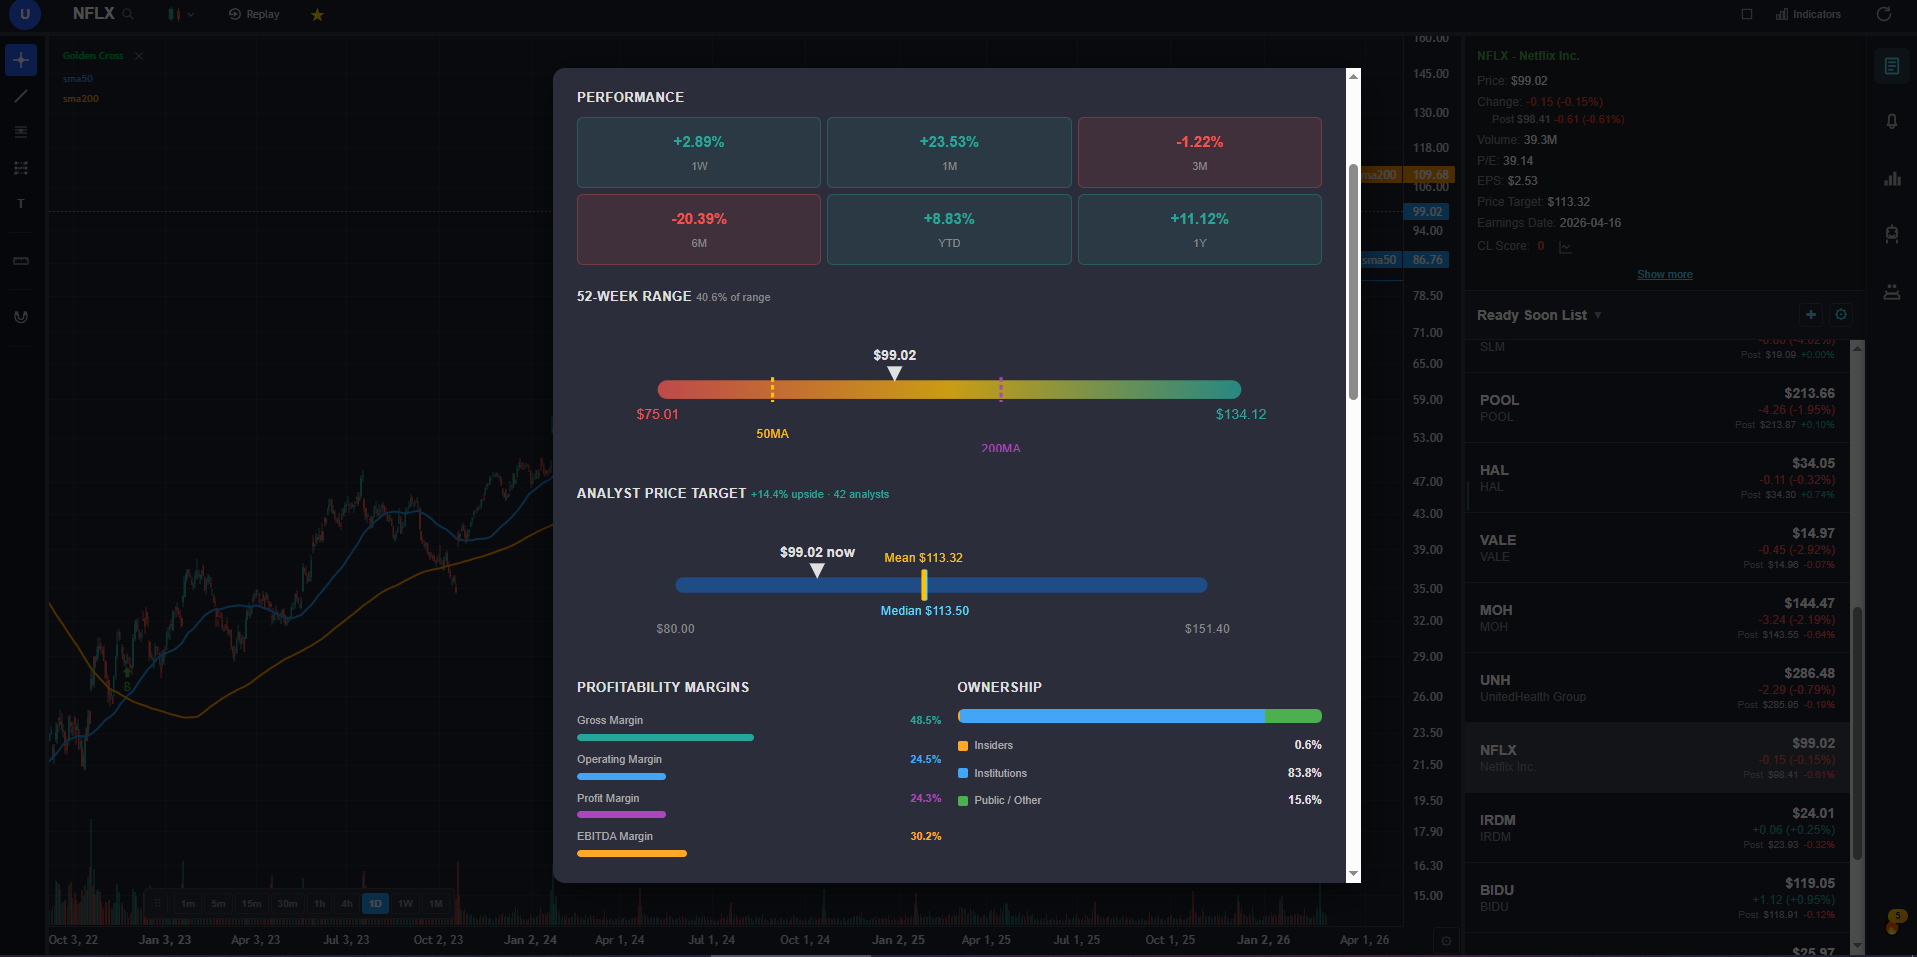
The platform also surfaces insider trading data and hedge fund holdings moves alongside your charts. While this is more relevant for swing and position traders, day traders can use insider buy clusters as a catalyst confirmation tool. If insiders are buying aggressively in a stock that is also setting up technically, the convergence of signals strengthens the thesis.
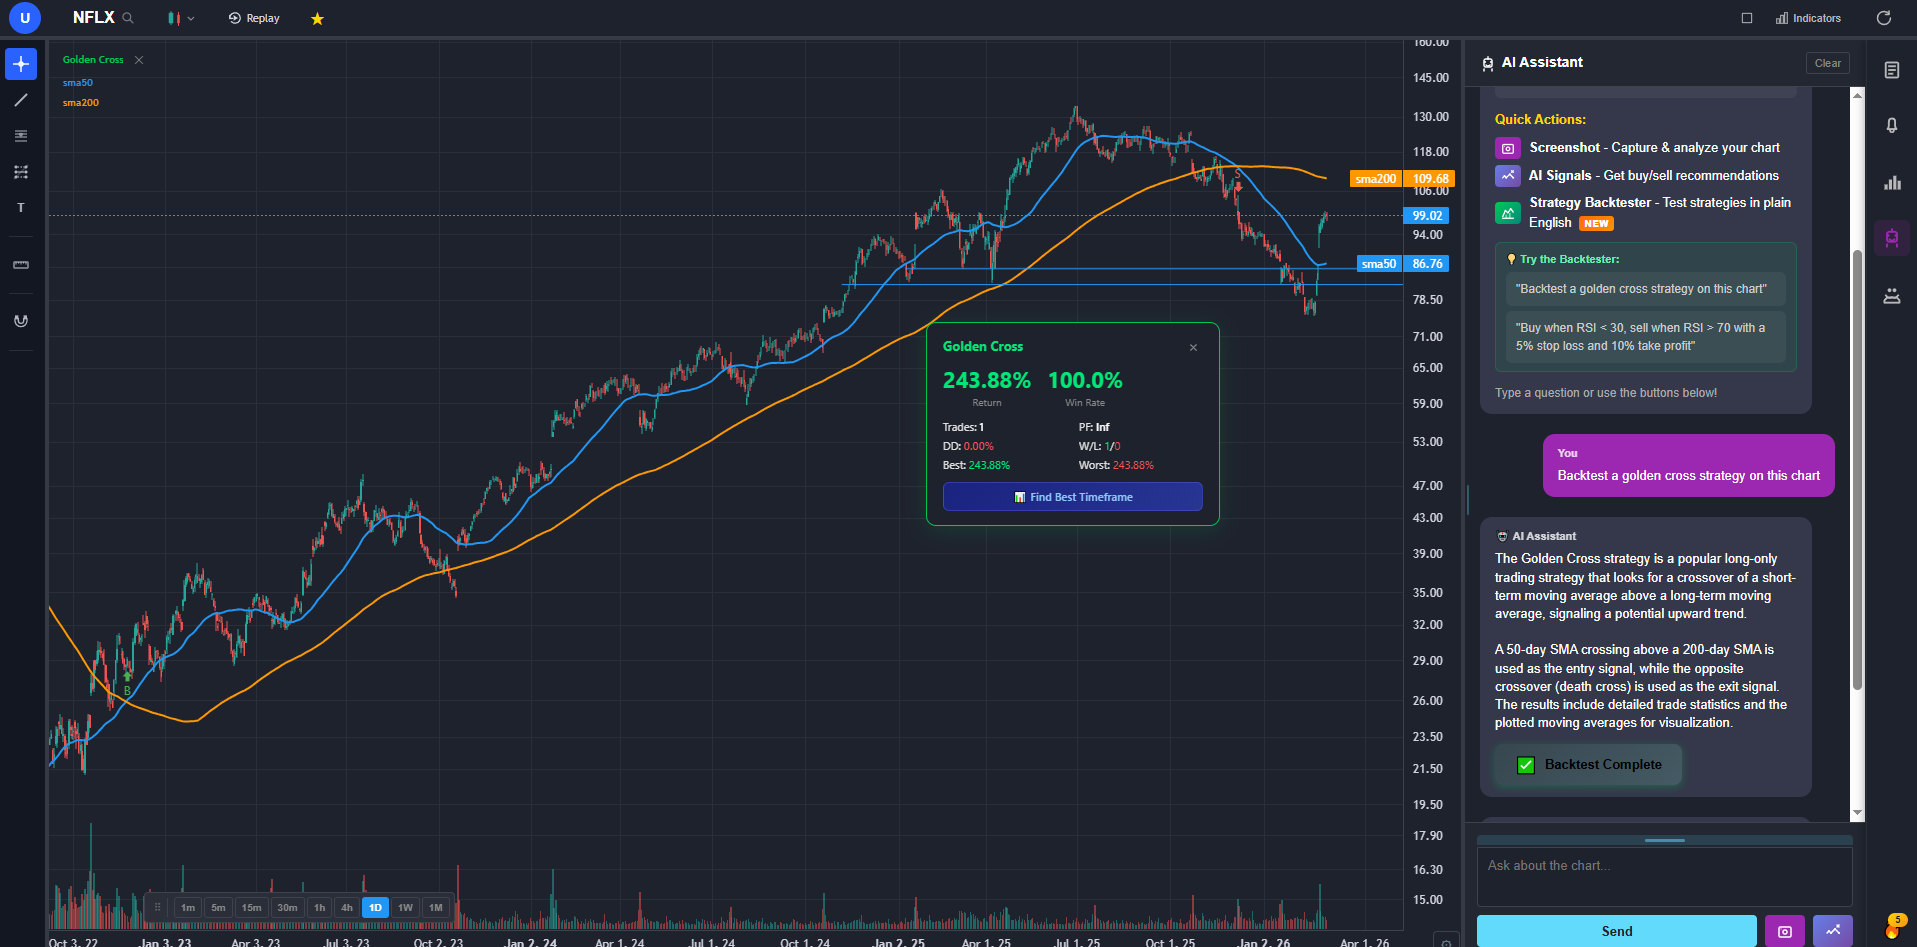
ChartingLens also features a strategy backtester — describe any trading strategy in plain English and test it against historical data. Free users get two built-in strategies (Golden Cross and RSI Mean Reversion) with AI timeframe optimization that finds the best-performing timeframe. Premium users can create unlimited custom strategies. Results include return, Sharpe ratio, win rate, drawdown, and a full comparison table across timeframes.
The interface is clean, dark-themed, and completely ad-free on every tier. Chart rendering is fast even on 1-minute timeframes with multiple indicators stacked. The lightweight architecture means it runs smoothly alongside your broker platform, news feeds, and scanners without consuming excessive system resources. The premium plan at $14.99 per month unlocks deeper AI analysis, unlimited custom backtesting, and additional features, but the free tier is already more capable than most paid alternatives.
Pros
40+ indicators free, no limit per chart
AI buy/sell signals, auto pattern recognition, and Bar Replay
Built-in strategy backtesting with AI timeframe optimization
Lightweight browser-based, loads instantly
Real-time data on the free tier
No ads on any tier
Insider trading data included free
Cheapest premium plan at $14.99/mo
Cons
Newer platform, smaller community than TradingView
No custom scripting language yet
No built-in order execution or brokerage
Best for: Day traders who want fast, free, real-time charts with AI-powered signals and pattern recognition in a lightweight browser interface.
2. TradingView — Best for Community and Custom Scripts
TradingViewFree (limited) + from $14.95/mo
TradingView is the most widely used charting platform in the world, and for good reason. Its charting engine is fast, its indicator library is enormous, and its Pine Script language lets power users build custom indicators and automated strategies from scratch. The social community is unmatched: millions of traders publish chart analyses, share ideas, and discuss setups daily. For day traders who learn by studying other traders' approaches, this ecosystem is invaluable.
However, TradingView's free tier has significant limitations that specifically impact day traders. Free users can only apply one indicator per chart. For a day trader who needs VWAP plus an EMA plus RSI on the same chart, that restriction is a non-starter. You also get persistent ads, a single chart layout, and only one active alert. Most serious day traders end up paying for the Essential plan at $14.95 per month or the Plus plan at $29.95 per month to get the multi-indicator, multi-layout setup they need.
The charting itself is excellent once you are on a paid plan. Real-time data is available on the free tier for most exchanges. The platform supports stocks, crypto, forex, futures, and even bonds. Pine Script is a genuine differentiator for quantitative day traders who want to code custom indicators or backtest strategies. TradingView also offers a desktop application and mobile app, though the browser version remains the most popular.
For day traders specifically, TradingView is a strong choice if you are willing to pay for a subscription. If you are looking for a free option that gives you multiple indicators and AI-driven signals without a paywall, other platforms deliver more at no cost.
Best for: Day traders who value community analysis, Pine Script scripting, and are willing to pay for a premium charting subscription.
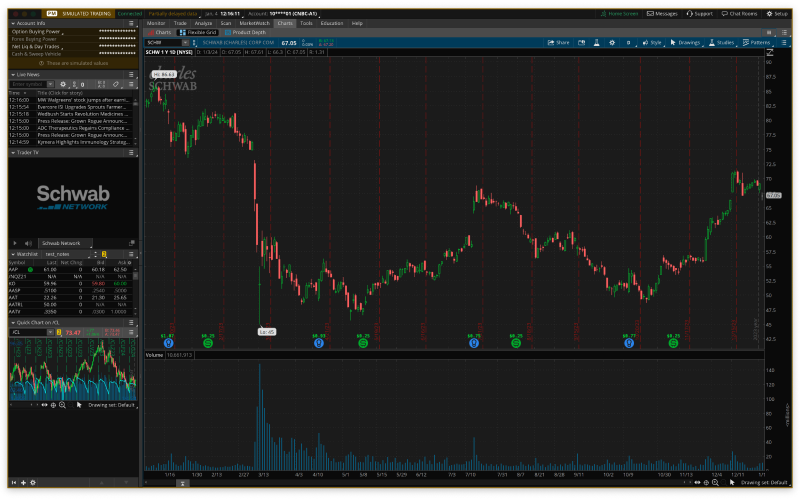
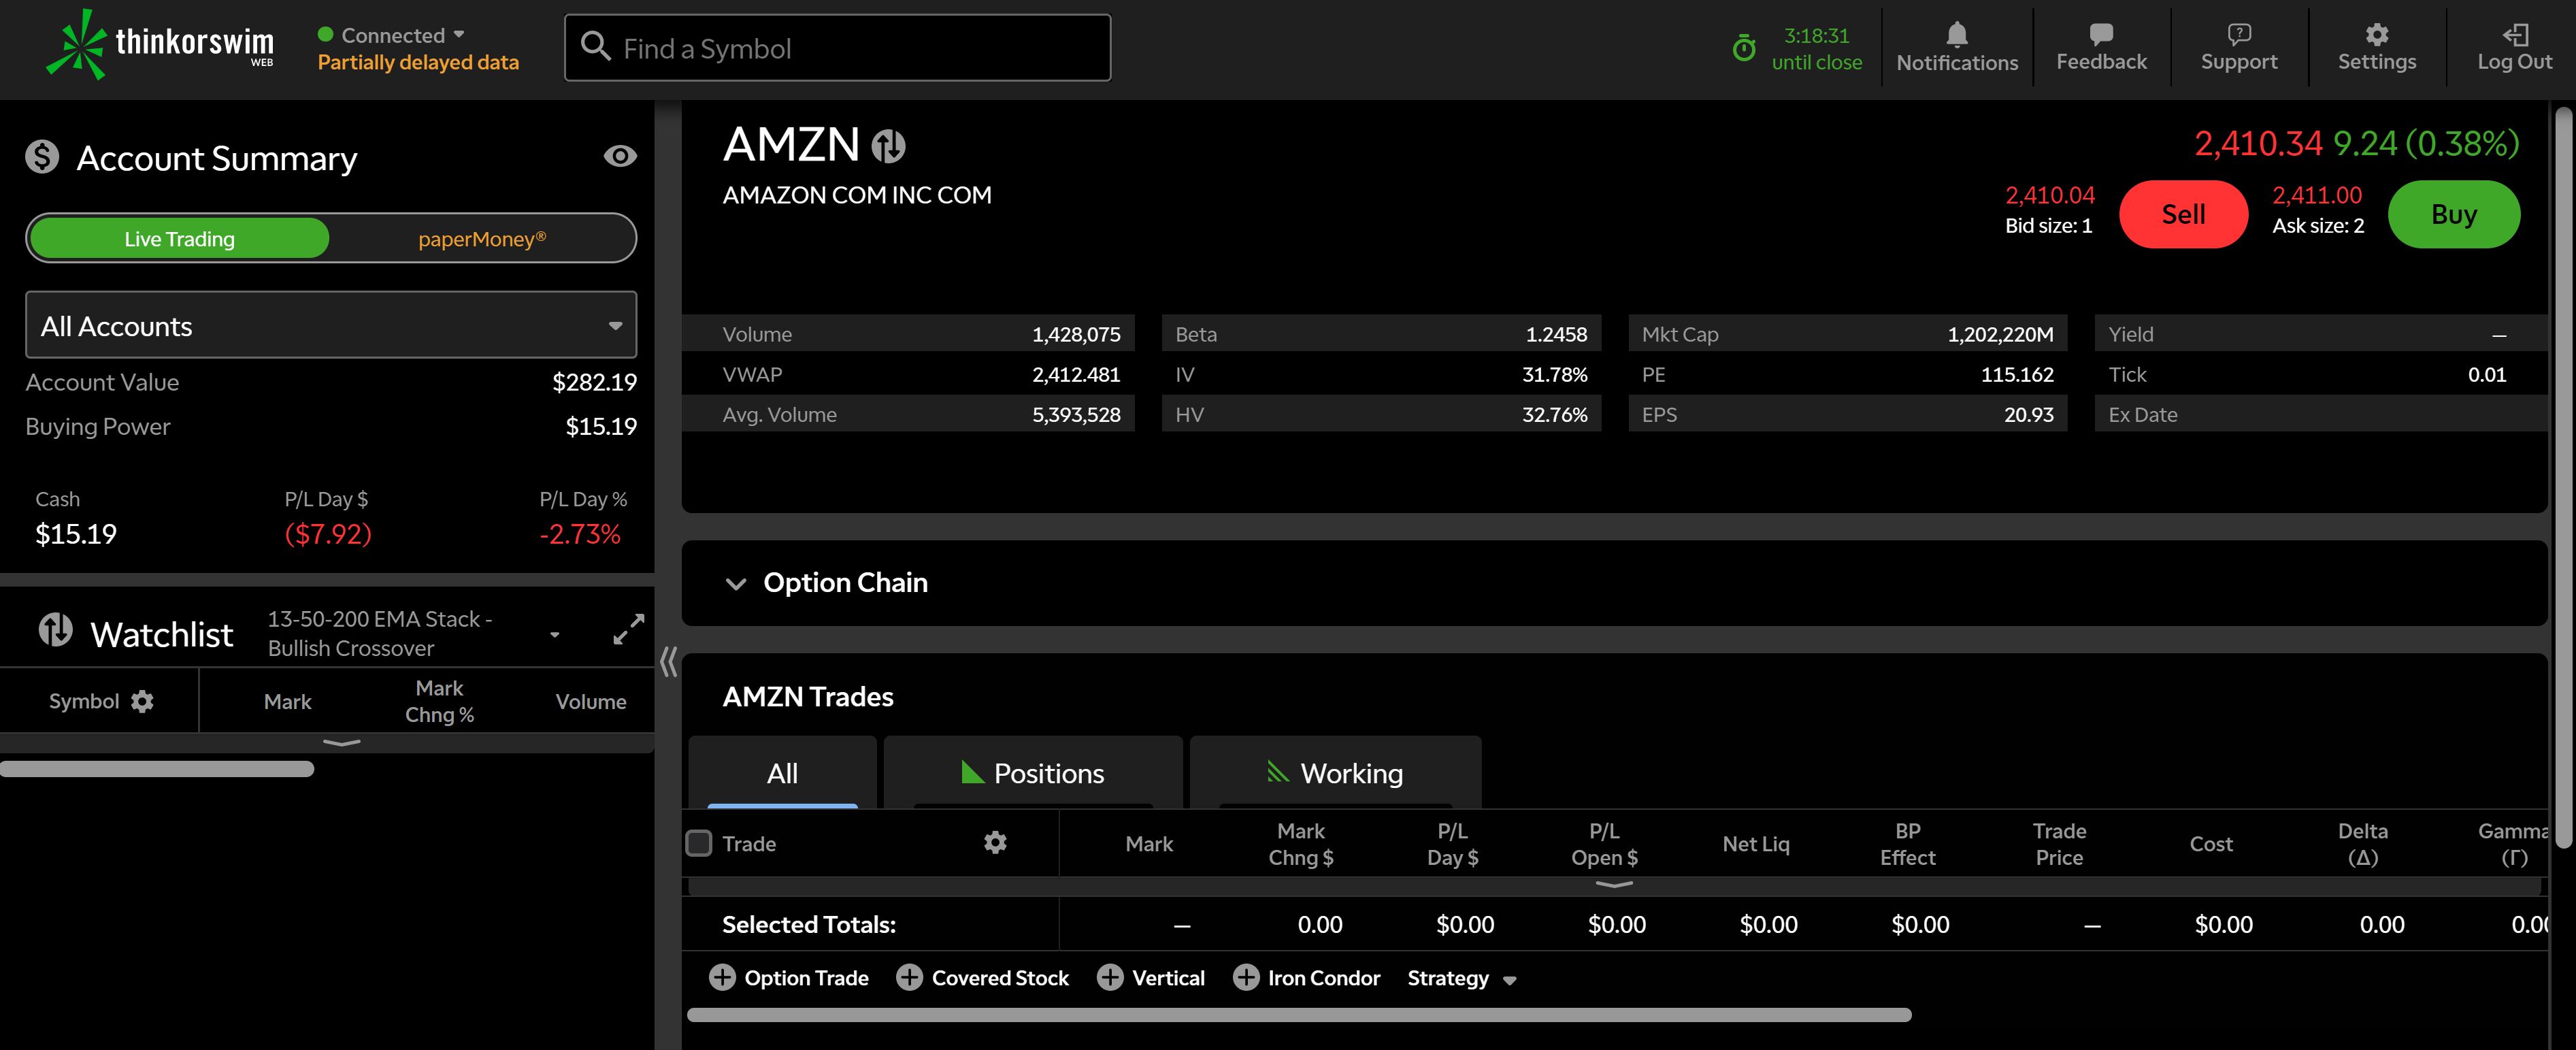
3. Thinkorswim (Schwab) — Best for Options Day Traders
Thinkorswim (Schwab)Free with Schwab Account
Thinkorswim remains the gold standard for options day traders. Now operated by Charles Schwab after the TD Ameritrade acquisition, it offers a level of options analysis depth that no other free platform can match. The options chain visualization, probability analysis, risk profiles, and Greeks overlays are tools that options day traders genuinely depend on. The paper trading mode with real-time data lets you practice strategies without risking capital.
For pure stock day trading, Thinkorswim is a mixed bag. The charting engine supports hundreds of technical studies and the proprietary thinkScript language lets you create custom indicators and scanners. Real-time data is included. The platform is undeniably powerful. But it is also a heavyweight desktop application that can consume significant system resources, making it a poor choice for traders who value a lightweight setup. The interface is dense and complex, with a learning curve measured in weeks rather than minutes.
Thinkorswim also lacks modern AI features. There are no AI-generated buy or sell signals, no automatic pattern recognition, and no AI trading assistant. The platform relies entirely on manual analysis, which some experienced traders prefer but which puts newer day traders at a disadvantage compared to platforms that offer AI-assisted tools.
If you day trade options and want the deepest analysis tools available at no additional cost, Thinkorswim through a Schwab account is hard to beat. For stock day traders who want speed, simplicity, and AI assistance, there are better fits.
Pros
Unmatched options analysis tools
thinkScript custom scripting
Paper trading with live data
Free with Schwab brokerage account
Hundreds of technical studies
Cons
Heavyweight desktop app, not lightweight
Steep learning curve
Requires Schwab brokerage account
No AI features or pattern recognition
Interface feels dated compared to modern platforms
Best for: Options day traders who need advanced probability tools, risk profiles, and strategy modeling through a full-service brokerage.
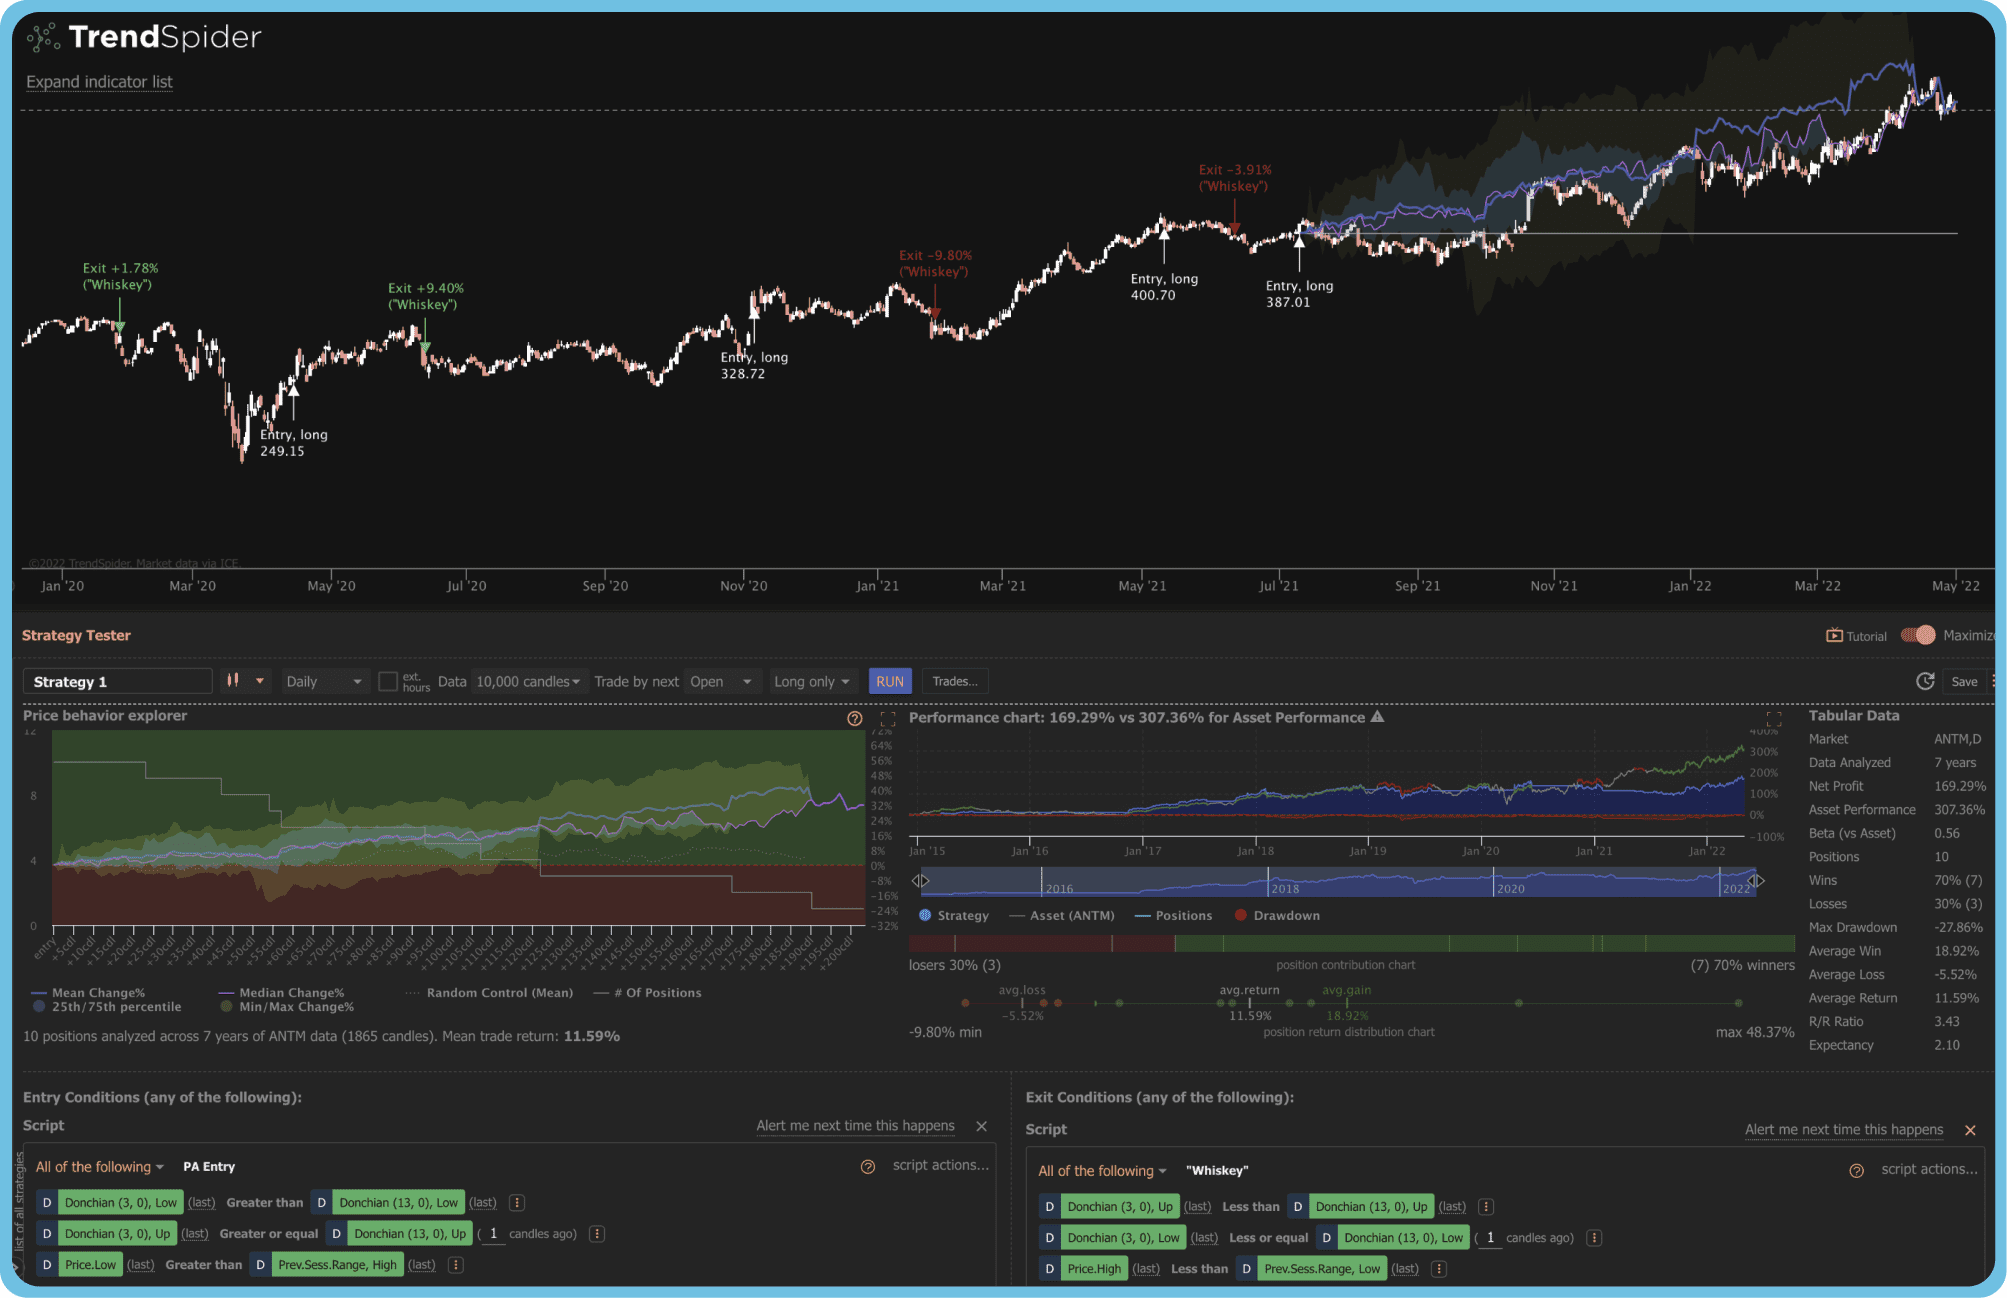
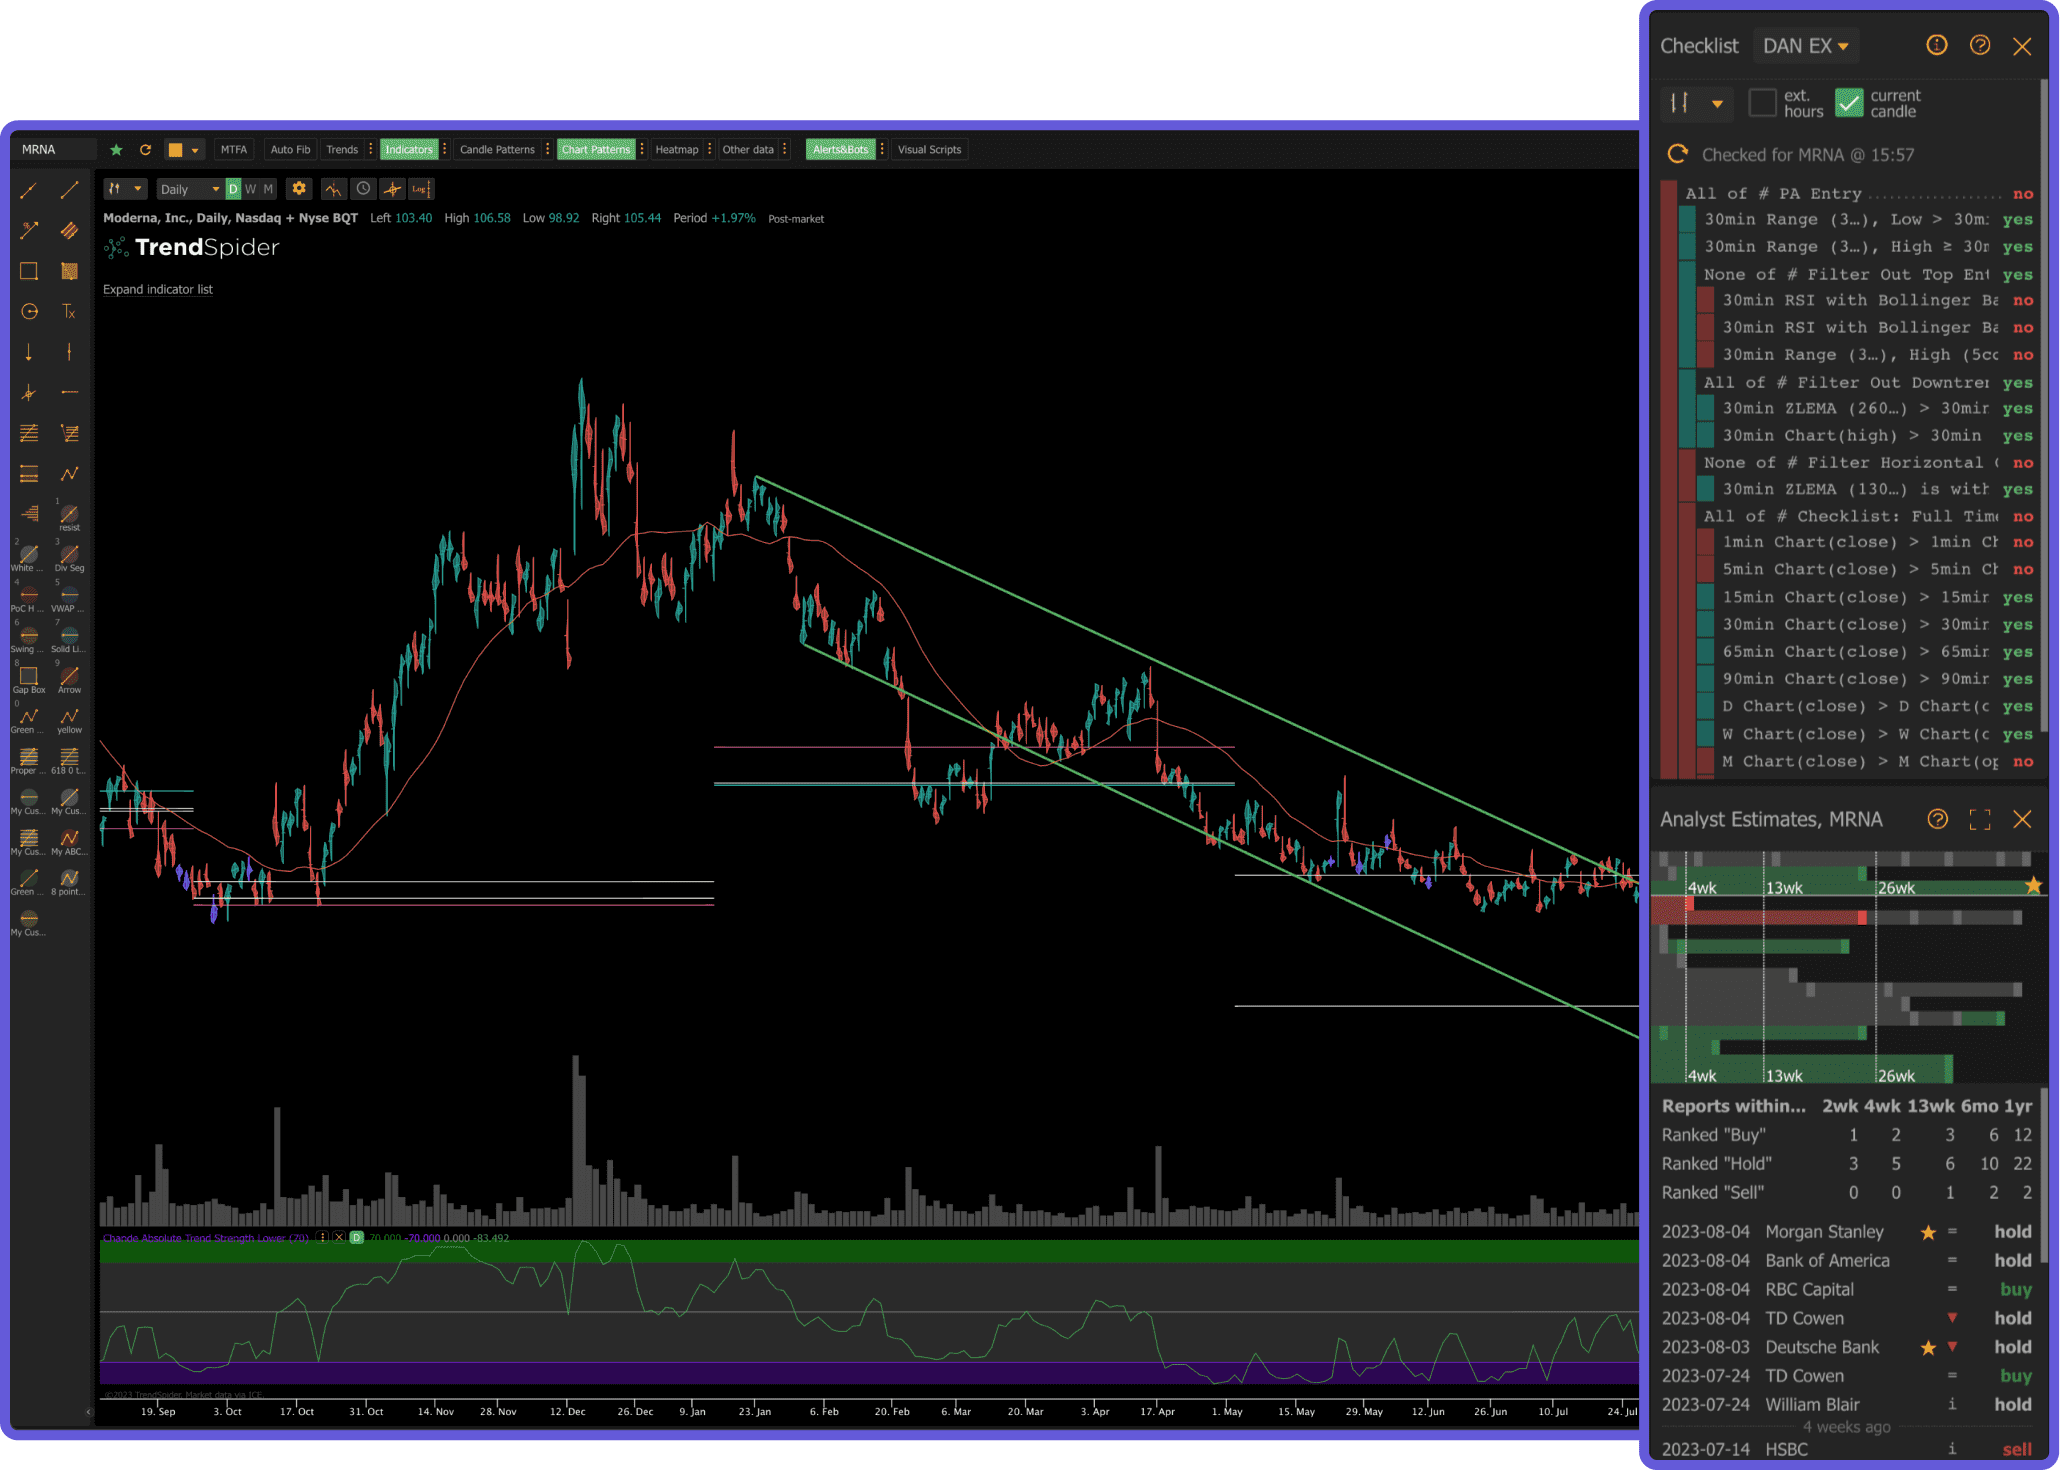
4. TrendSpider — Best Automated Technical Analysis
TrendSpiderFrom $22/mo (no free tier)
TrendSpider is a dedicated technical analysis platform that differentiates itself through automation. Its headline feature is automated trendline detection: the platform uses algorithms to identify and draw trendlines, support and resistance zones, and Fibonacci levels without manual input. For day traders who spend significant time drawing and adjusting trendlines, this can save real time during the trading session.
The platform also includes multi-timeframe analysis that overlays indicators from different timeframes on a single chart, raindrop charts (a proprietary visualization), and a strategy tester for backtesting ideas. The automated candlestick pattern scanner identifies formations across your watchlist. These are genuinely useful features for active day traders.
The major drawback is price. TrendSpider has no free tier. Plans start at $22 per month for the Elite plan and go up to $79 per month for the Advanced plan. There is no way to test the platform meaningfully without paying. For day traders already managing commissions, data feeds, and other trading costs, adding $22 to $79 per month for charting software is a significant expense, especially when alternatives offer comparable or superior features at lower prices or for free.
TrendSpider is a solid choice for day traders who specifically want automated trendline and pattern detection and are willing to pay for it. But the lack of a free tier and the relatively high price point put it at a disadvantage compared to platforms like ChartingLens that offer AI-powered pattern recognition and signals for free.
Pros
Automated trendline detection
Multi-timeframe analysis overlays
Candlestick pattern scanner
Strategy backtesting
Cons
No free tier at all
Starts at $22/mo, up to $79/mo
No AI buy/sell signals
No insider trading data
Smaller community than TradingView
Best for: Technical traders who want automated trendline and pattern detection and are comfortable paying a premium for specialized tools.
5. NinjaTrader — Best for Futures Day Trading (DOM & Execution)
NinjaTrader is the dominant retail platform for futures day traders. Its core strengths are the SuperDOM (a depth-of-market ladder built for fast order entry), Chart Trader (place and manage orders directly from the chart), one of the cheapest commission structures for funded futures accounts, and NinjaScript for custom indicators and automated strategies. Market Replay lets you load any historical session tick-by-tick and practice executions with real fill simulation.
The platform ships free for charting, simulated trading, and strategy development. Live data feeds and live execution require either a NinjaTrader brokerage account (commission-based) or third-party data subscriptions (Rithmic, CQG). For traders serious enough to want lifetime ownership, the $1,499 one-time license unlocks all order-entry features without per-trade markups.
NinjaTrader's weaknesses are a steeper learning curve than browser-based platforms, a Windows-only desktop application, no AI buy/sell signals, and a futures-first orientation that makes it less ideal for pure stock traders. Day traders who focus on equities rather than futures will get more out of ChartingLens, TradingView, or thinkorswim.
Pros
SuperDOM — best-in-class for futures order entry
Chart Trader on-chart execution
Market Replay with tick-level granularity
NinjaScript for custom indicators & strategies
Cheap commissions on funded futures accounts
Cons
Windows-only desktop app
Live data requires paid feed or brokerage account
No AI signals or pattern recognition
Steeper learning curve
Less ideal for pure stock traders
Best for: Futures day traders who need DOM-based order entry, tick-by-tick replay, and the ability to code automated strategies.
6. Sierra Chart — Fastest Professional-Grade Charts (Order Flow)
Sierra ChartFrom $36/mo (Standard) · Package 5 from $46/mo
Sierra Chart is the platform serious order-flow and futures day traders graduate to. The charting engine is the fastest on this list — it renders bid/ask volume, footprint charts, numbers bars, and volume profile (its Volume by Price implementation is widely considered best-in-class) with imperceptible latency even on 1-tick or range bars. The DOM is highly configurable, and Advanced Custom Study Interface Library (ACSIL) gives quants C++-level control over custom studies.
Sierra Chart is a paid platform with a tiered subscription model. Standard service starts at $36/month; most active traders run Package 5 ($46+/month) which unlocks the depth tools (footprint, numbers bars, advanced order flow). Live data is sold separately through Denali, Rithmic, or CQG. There is no free tier — only a free trial.
The trade-off is interface. Sierra Chart is functionally dense, visually dated, and not intuitive on day one — it rewards traders who invest the time to configure it. For day traders whose edge is reading order flow on futures, ES/NQ, or crude, Sierra Chart is the professional standard. Stock-focused day traders or anyone who wants AI-assisted analysis will find ChartingLens, TradingView, or TrendSpider a better fit.
Best for: Order-flow day traders and futures professionals who need the fastest possible chart rendering and the deepest depth-of-market tooling.
Best Free Real-Time Stock Charts
Real-time data is non-negotiable for day trading. A chart that is even 15 minutes behind the market is worthless for intraday decision-making. Here are the platforms that offer genuine free real-time stock charts suitable for day trading.
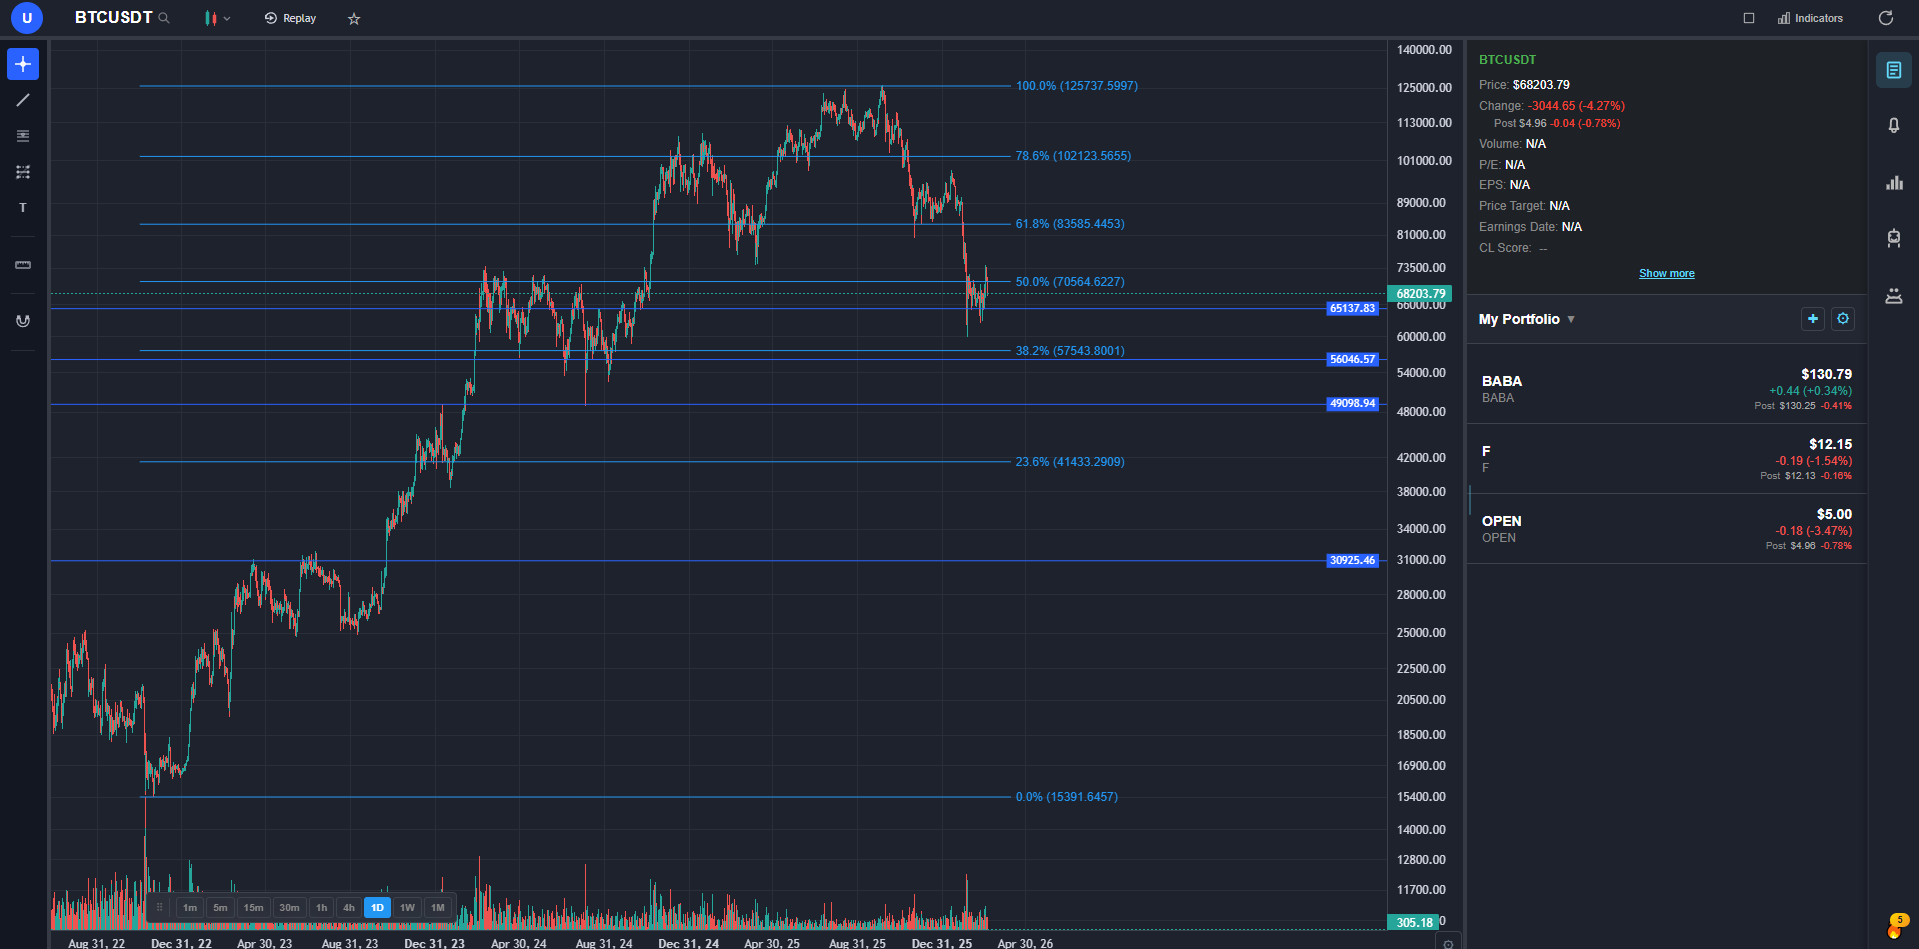
ChartingLens provides the strongest free real-time charting experience for day traders. Charts update tick by tick with zero perceptible delay, and you get 40+ indicators to layer on top of your real-time data without any restriction. The AI buy/sell signals operate on real-time data, meaning the alerts you receive are actionable in the moment, not lagging behind. No account upgrade is required for real-time access, and there are no ads cluttering your screen during fast-moving sessions.
TradingView offers real-time data on its free tier for most major exchanges, but the one-indicator-per-chart limitation severely reduces its usefulness for day traders who need multi-indicator setups. You effectively get real-time data but cannot analyze it with your full toolkit unless you pay.
Thinkorswim includes real-time data with a Schwab brokerage account. The data feed is institutional quality, which is a genuine advantage during volatile sessions. However, you need to open a brokerage account to access it, and the desktop platform is heavy on system resources.
NinjaTrader and Sierra Chart both offer professional-grade real-time data, but it is sold separately from the platform. Sierra Chart requires a paid data feed (Denali, Rithmic, or CQG); NinjaTrader bundles live data with a brokerage account or charges separately. Both are excellent once configured but are not "free real-time" in the casual sense ChartingLens or TradingView are.
If your priority is free real-time stock charts with enough depth for serious day trading analysis, ChartingLens delivers the best combination of real-time data, indicator access, and AI-powered features at no cost.
Best Free Candlestick Chart Software
Candlestick charts are the foundation of day trading analysis. Each candle encodes four critical data points: open, high, low, and close. Patterns formed by individual candles and groups of candles, such as doji, hammer, engulfing, morning star, and evening star, provide signals about potential reversals, continuations, and momentum shifts. The best free candlestick chart software not only renders these candles cleanly but also helps you identify patterns automatically.
ChartingLens leads this category for two reasons. First, its candlestick rendering is crisp and clean across all timeframes, from 1-minute to monthly. Second, and more importantly, it includes AI-powered automatic candlestick pattern recognition. The platform detects patterns like doji, hammer, engulfing, and piercing line formations in real time and highlights them on your chart. For day traders scanning multiple stocks during a session, automatic pattern detection eliminates the risk of missing a key formation on a stock you glanced at too quickly.
TradingView renders excellent candlestick charts and has community-built Pine Script indicators that can identify candlestick patterns. However, these require manual setup and use your one free indicator slot. Native, built-in pattern recognition is not included.
TrendSpider offers automated candlestick pattern detection as part of its paid plans, but there is no free tier to test it. At $33 per month minimum, it is a significant cost for a feature that ChartingLens provides for free.
Thinkorswim provides clean candlestick rendering and allows you to build custom pattern recognition through thinkScript, but this requires programming knowledge and manual setup. There is no out-of-the-box automatic detection.
For traders who want free candlestick chart software with automatic pattern recognition built in, ChartingLens is the clear frontrunner. You get clean candlestick rendering, real-time data, and AI-powered pattern alerts without paying a cent.
Lightweight Charting Platforms That Won't Slow You Down
Day traders often run multiple applications simultaneously: a charting platform, a brokerage for order execution, a news feed, a scanner, and sometimes a chat or Discord window. A charting tool that consumes excessive CPU and memory is not just annoying; it is a liability. When the market spikes on news, you need your charts to render instantly, not freeze because your platform is hogging resources. This is why lightweight charting platforms are increasingly preferred by active day traders over bloated desktop applications.
ChartingLens is built on a lightweight rendering engine optimized specifically for speed and low resource consumption. It runs entirely in the browser, so there is no desktop application to install, no Java runtime to maintain, and no background processes consuming memory when you are not charting. Despite its lightweight footprint, it handles 1-minute charts with multiple stacked indicators without any perceptible lag. The platform's architecture is designed for exactly the scenario day traders face: loading charts quickly, switching tickers rapidly, and keeping everything responsive during high-volatility moments.
TradingView is also browser-based and generally lightweight, though its performance can degrade with multiple open tabs and heavy indicator usage. The ads on the free tier add additional rendering overhead. On paid plans with ads removed, TradingView is fast and responsive.
Thinkorswim is the opposite of lightweight. The desktop application is built on Java and is known for high memory usage, slow startup times, and occasional freezes during volatile market opens. Many day traders who use Thinkorswim run it on dedicated machines specifically because it competes for resources with everything else.
TrendSpider runs in the browser and is reasonably lightweight, but its automated analysis features can cause occasional processing delays, particularly when running multi-timeframe scans.
NinjaTrader and Sierra Chart are desktop applications and not lightweight by browser standards, but they are extremely efficient at what they do — rendering thousands of ticks per second on order-flow charts without dropping frames. They are heavy in resource use but optimized for the futures workflow they target.
For day traders who prioritize a lightweight charting platform that delivers speed without sacrificing capability, ChartingLens offers the best balance. It is fast enough for scalpers working on 1-minute charts, deep enough for swing traders using multiple indicators, and light enough to run alongside your entire trading stack without performance issues.
Best Technical Analysis Software for Advanced Traders
Advanced day traders need more than basic candlestick charts and a handful of indicators. They need multi-timeframe confirmation, custom indicator creation, automated scanning, backtesting, and increasingly, AI-driven analysis that surfaces opportunities faster than manual review. Here is how the top platforms stack up for the best technical analysis software and the best platform for technical analysis in 2026.
ChartingLens approaches advanced technical analysis from an AI-first perspective. Rather than requiring you to code custom indicators or manually configure scanners, the platform's machine learning engine does the heavy lifting. AI buy/sell signals evaluate price action, volume, momentum, and pattern formations across thousands of stocks simultaneously. The CL Score provides a machine-learning-based rating for each stock, distilling complex multi-factor analysis into an actionable number. For advanced traders, this is not a replacement for their own analysis but a force multiplier that surfaces candidates faster and provides a second opinion grounded in quantitative data. Combined with AI-assisted trading capabilities and insider trading data, ChartingLens offers a modern approach to advanced technical analysis.
TradingView is the strongest platform for traders who want to build their own tools. Pine Script is a powerful yet accessible scripting language that lets you create custom indicators, screeners, and even automated strategy signals. The backtesting engine, while not institutional-grade, is sufficient for testing most retail strategies. The indicator library, built by both TradingView's team and its community, is the largest available on any retail charting platform. For quantitative day traders who want granular control over every aspect of their analysis, TradingView on a paid plan is hard to beat.
Thinkorswim excels in options-specific advanced analysis: probability cones, theoretical pricing models, and complex spread visualization. Its thinkScript language is more powerful than most retail alternatives for building custom studies. However, the platform's strength is narrowly focused on options and traditional technical studies. It lacks AI features and the modern interface that newer platforms offer.
TrendSpider is the strongest pick for traders who specifically want AI-assisted technical analysis — automated trendline detection, multi-timeframe analysis, and pattern scanning. The indicator depth is solid but the AI scope is narrower than ChartingLens. Pricing starts at $33/month.
NinjaTrader and Sierra Chart serve a different segment of advanced traders — futures day traders and order-flow specialists who need DOM-based execution, footprint charts, and tick-level replay. Both are professional standards in their niche but overkill for stock-only or AI-driven workflows.
For advanced traders seeking the best platform for technical analysis in 2026, the choice depends on your approach. If you want to code your own tools, TradingView's Pine Script ecosystem is the most developed. If you want AI to do the heavy analytical lifting while you focus on execution, ChartingLens provides the most capable AI engine at the lowest price. If options analysis is your primary focus, thinkorswim remains unmatched. If futures order-flow is your edge, Sierra Chart or NinjaTrader are the professional standards.
Frequently Asked Questions
ChartingLens is the best overall charting software for day trading in 2026. It offers free real-time stock charts, 40+ technical indicators with no per-chart limit, AI-powered buy/sell signals, automatic candlestick pattern recognition, and a lightweight browser-based interface that loads instantly. TradingView is the best alternative for traders who want Pine Script custom indicators, and Thinkorswim is the top choice for options day traders.
Yes. ChartingLens, TradingView, and thinkorswim (with a Schwab account) all offer free real-time stock charts. ChartingLens provides the most complete free experience with 40+ indicators and AI signals alongside real-time data. TradingView limits free users to 1 indicator per chart. thinkorswim requires a brokerage account. NinjaTrader and Sierra Chart deliver pro-grade real-time charts but require paid data feeds.
ChartingLens offers the best free candlestick chart software, combining clean candlestick rendering with AI-powered automatic pattern recognition. It detects patterns like doji, hammer, engulfing, and piercing line in real time and highlights them on your chart. TradingView also provides excellent candlestick charts but requires Pine Script setup for pattern detection and limits free users to 1 indicator. TrendSpider offers automated pattern detection but has no free tier.
No. The gap between free and paid technical analysis software has narrowed significantly in 2026. ChartingLens offers 40+ indicators, AI buy/sell signals, automatic pattern recognition, and insider trading data entirely on its free tier. Its premium plan at $14.99/mo is the most affordable among serious charting platforms. You no longer need enterprise-level budgets to access professional technical analysis tools.
A lightweight charting platform loads charts instantly, renders candlesticks without lag on sub-minute timeframes, uses minimal CPU and memory, and avoids bloating the browser with unnecessary features. Browser-based platforms like ChartingLens and TradingView are generally lighter than desktop applications like Thinkorswim. ChartingLens is specifically optimized for low resource consumption while maintaining fast rendering, making it ideal for day traders who run multiple applications simultaneously.
Yes, when used as a supplement to your own analysis rather than a replacement. AI-powered platforms like ChartingLens scan thousands of stocks in real time, identify high-probability setups, detect candlestick patterns automatically, and generate buy/sell signals based on machine learning models trained on historical data. These tools do not guarantee profits, but they can dramatically speed up the process of finding trade candidates and confirming setups, giving day traders more time to focus on execution and risk management.
Conclusion: Choose the Right Charting Software for Your Day Trading Style
The best charting software for day trading is the one that matches your specific needs: speed, real-time data, the right indicators, and a price you can sustain. Every platform on this list has legitimate strengths. TradingView dominates in UI and Pine Script scripting. thinkorswim is unmatched for stocks and options. TrendSpider automates trendline detection and AI-assisted scans. NinjaTrader is the standard for futures DOM and execution. Sierra Chart delivers the fastest order-flow charts available to retail traders.
But for day traders who want the best combination of free real-time stock charts, a full indicator suite, AI-powered signals and pattern recognition, free candlestick chart software, and a lightweight charting platform that runs instantly in the browser, ChartingLens delivers more value than any alternative at any price point. The free tier alone outperforms several paid platforms, and the $14.99 per month premium plan is the most affordable upgrade in the market.
Day trading is already demanding enough. Your charting software should make the job easier, not harder. Choose a platform that gives you the speed, data, and intelligence you need to make confident decisions, and start with one that does not charge you for the privilege of seeing a real-time candlestick chart.