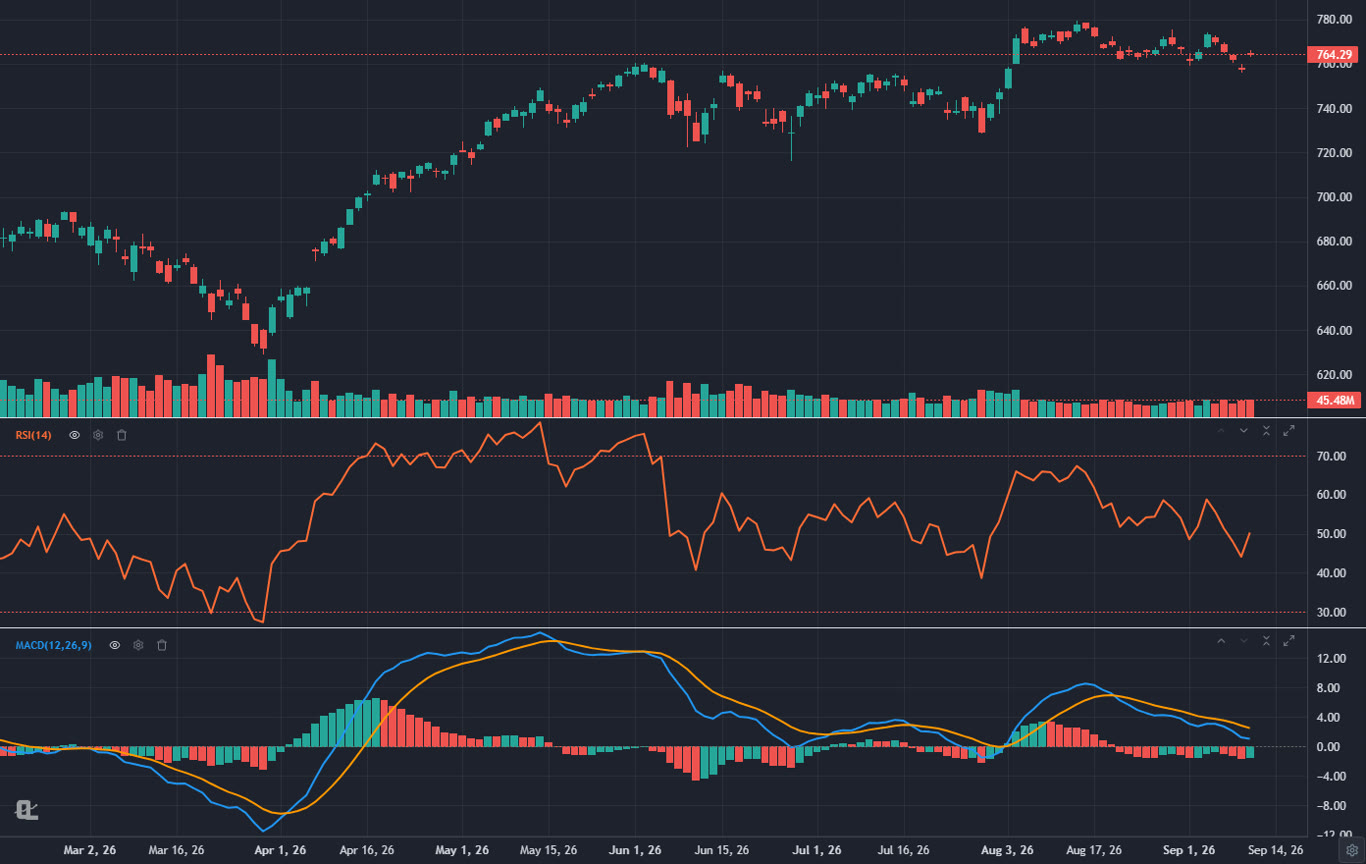
Technical analysis software is the layer between the price data and your decision. It draws the chart, computes the indicators, holds your levels, scans the market for the setups you care about, and, in the better packages, tests whether a rule actually worked before you risk money on it. The gap between the good ones and the rest is not the indicator count. Every platform on this list has RSI. The gap is how much of the workflow lives in one place, how fast the chart is, and whether the software can do anything with your analysis after you have done it.
I have used all eight of these for real trading, not for a demo afternoon. The ranking below weighs charting quality, the depth of the technical toolkit, scanning, alerts, backtesting, price and the amount of friction between having an idea and testing it. If you searched for the best trading platform for technical analysis and you also need order entry, the thinkorswim and NinjaTrader entries cover that. If you want the analysis to be as good as it gets and you are happy to execute at your own broker, the top three are where to look.
How We Ranked Technical Analysis Software
Six criteria, in the order they matter to a technical trader:
- Charting engine. Speed on long histories, multi-pane layouts, extended hours, timeframe coverage, chart types beyond candles.
- Technical toolkit. Indicator depth and quality, volume tools (profile, VWAP, anchored VWAP), drawing tools, and whether the platform adds anything of its own, such as divergence detection or pattern recognition.
- Scanning and alerts. Can you find the setup across the market and be told when it triggers, without watching the screen?
- Backtesting. Can you test a rule, how much coding does it need, and how honest are the statistics (costs, drawdown, stress testing)?
- Price for what you actually use. Headline tiers versus the tier a technical trader needs, plus data add-ons.
- Friction. Learning curve, install requirements, and how many separate tools you end up paying for.
Order execution is not a criterion. Most of these platforms are analysis tools, and the broker-attached ones are noted as such.
The 8 Best Technical Analysis Platforms at a Glance
| Software | Best for | Price | Backtesting | AI / automation |
|---|---|---|---|---|
| ChartingLens | All-in-one technical analysis | Free / $14.99 / $29.99 mo | Plain English, no code, Monte Carlo | Chart-aware AI, pattern recognition, AI screener |
| TradingView | Script library | Free / $14.95 to $69.95 mo | Pine Script strategies | Community scripts only |
| TrendSpider | Automated TA | About $22 to $97 mo | Visual strategy tester | Auto trendlines, pattern detection |
| thinkorswim | Free with a broker | Free (Schwab account) | thinkScript strategies | None |
| StockCharts | Classical charting | Free delayed / $24.95 to $59.95 mo | None | None |
| TC2000 | Scanning and watchlists | $9.99 to $59.99 mo + data | Limited | None |
| MetaStock | Legacy desktop | From about $60 mo + data | System tester | Expert Advisors |
| NinjaTrader | Futures order flow | Free charting / $1,099 lifetime | Strategy builder, C# | None |
The 8 Best Technical Analysis Software Platforms Reviewed
1ChartingLens: Best Technical Analysis Software Overall
ChartingLens is a well-established platform with a large active user base, advanced features, and an institutional-grade strategy builder and backtesting engine. It is broker-agnostic, so it sits alongside whatever brokerage you already use, it is battle-tested at scale across a comprehensive multi-asset universe of stocks, ETFs, crypto, forex, metals and index CFDs, and it ships with a large built-in indicator library, a mature AI-first feature ecosystem, and extensive documentation and learning resources. A thriving trader community spanning day, swing and long-term investors uses it every session.
For technical analysis specifically, it covers the whole workflow in one browser tab. The chart runs on a high-performance engine with a large built-in indicator library that includes the classics (moving averages, RSI, MACD, Bollinger Bands, Ichimoku, ATR, ADX, stochastics), the volume tools serious chartists want (visible range, fixed range and anchored volume profile, VWAP and anchored VWAP with bands), and a set of enhanced indicators such as Smart RSI and Smart MACD that draw divergences on the chart automatically. Drawing tools include trendlines, horizontal and rectangle zones, Fibonacci retracement and extension, pitchforks and measurement tools, and every drawing is saved per symbol and synced across devices.
What separates it from the rest of this list is what happens after the analysis. Automated chart pattern recognition marks head and shoulders, double tops, flags, triangles and more as they form. Alerts fire on price levels, indicator conditions, trendline touches and strategy signals, delivered by email and push. And the institutional-grade strategy builder and backtesting engine take a plain-English description such as "buy when the 20 EMA crosses above the 50 EMA and RSI is below 60, sell at a 2R target or a 4 percent stop" and return the trade log, win rate, drawdown and a Monte Carlo stress test with no code. Custom Pine Script indicators can be pasted in and converted on the paid tiers. A chart-aware AI assistant will mark support and resistance, explain an indicator, or give a verdict with entry, stop and target on the chart you are looking at.
It is analysis, not a broker, so there is no order entry, and the heaviest AI features sit on Premium and Pro. Everything in the technical toolkit above, including all three volume profile types and the Bollinger and RSI screener filters, is on the free tier.
Best fit: any trader who wants professional charting, screening, alerts and backtesting in one place without paying for three subscriptions.
2TradingView: Best Community Script Library
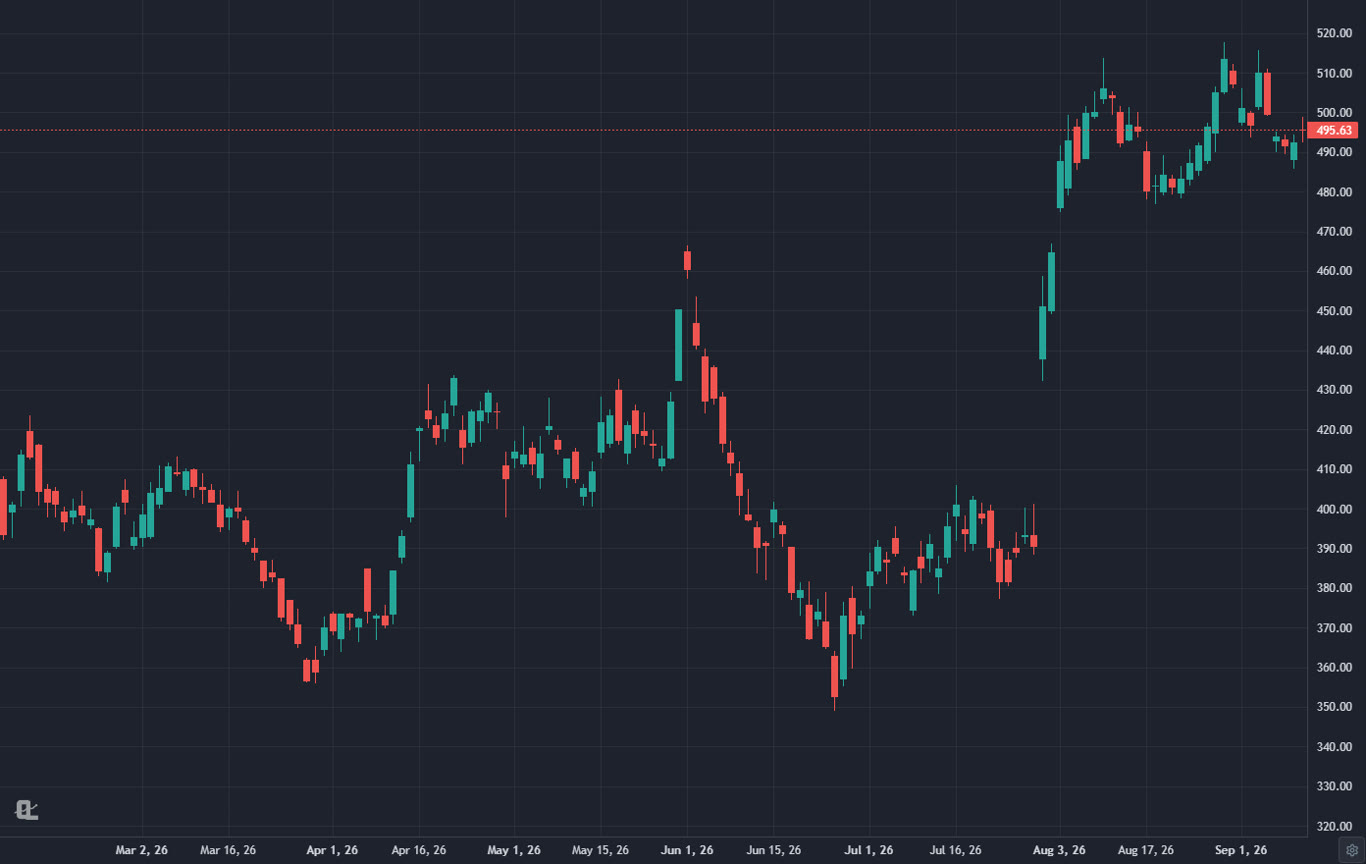
TradingView is the reference point most traders measure charting against, and for good reason: the charts are fast and polished, the drawing tools are excellent, and the Pine Script community library holds hundreds of thousands of indicators and strategies. If a technical concept exists, someone has scripted it. Backtesting works through the Pine strategy tester, which is powerful once you can write or edit Pine.
The friction is cost and coding. The free tier limits indicators per chart and shows ads, the useful tiers now start at $14.95 and climb to $69.95 a month after the April 2026 price increase, alerts on the Plus plan expire after two months, and anything beyond the stock indicator set means learning Pine Script. There is no native chart-aware AI.
Best fit: traders who want the biggest indicator ecosystem and are willing to pay for it or write Pine.
3TrendSpider: Best Automated Technical Analysis
TrendSpider automates the tedious parts of technical analysis. It draws trendlines and Fibonacci levels for you, detects candlestick patterns, runs multi-timeframe analysis on one chart and scans the market on complex multi-condition rules. Its raindrop charts and market scanner are genuinely different from what everyone else offers, and the strategy tester is visual rather than scripted.
The cost of all that automation is a learning curve and a price tag with no free tier. The interface is dense, the auto-drawn lines need judgment to filter, and the mid and upper tiers are among the more expensive on this list.
Best fit: systematic technical traders who want the software to do the drawing and scanning.
4thinkorswim: Best Free Technical Analysis With a Broker
thinkorswim remains the deepest free technical analysis package attached to a broker. Hundreds of studies, the thinkScript language for custom indicators, OnDemand replay, a strong options analytics suite and a full scanner, all at no cost once you have a Schwab account. For traders who also want to execute from the chart, it is the strongest free option.
It is desktop software with a steep learning curve and a dated interface, the mobile app is a reduced version, and you are tied to Schwab for execution. It does no AI analysis and there is no plain-English backtesting.
Best fit: Schwab clients who want professional-grade tools without a subscription.
5StockCharts: Best for Classical Chart Analysis
StockCharts is the home of classical technical analysis: point and figure, Renko, Kagi, market breadth indicators, sector rotation (RRG) charts and a huge educational library in ChartSchool. Its SharpCharts are clean and print-ready, and the scan engine is expressive for those who learn its syntax.
The charts are static rather than interactive, the free tier is delayed, real-time data costs extra, and there is no backtesting or AI. It is a research and education platform more than a trading terminal.
Best fit: longer-term technicians and students of classical charting.
6TC2000: Best Scanning and Watchlist Workflow
TC2000 has been a scanning powerhouse for decades. Its condition builder lets you write scans on almost any indicator relationship, the EasyScan lists update in real time, and the watchlist-to-chart workflow is fast. Charting is solid and the personal criteria formula language is approachable.
It is US equities and options only, it is Windows-first with a lighter web version, the data add-ons push the real cost above the headline tiers, and there is no AI or plain-English layer.
Best fit: US stock traders who live in scans and watchlists.
7MetaStock: Best Legacy Desktop Package
MetaStock has shipped technical analysis software since the 1980s and it shows in both senses. The indicator library and system tester are deep, the Expert Advisors and add-on packs cover most published methodologies, and the forecasting tools are unusual.
It is expensive desktop software, the interface is a generation behind, and real-time data is a separate bill. Most of what it does is now available in the browser for less.
Best fit: long-time MetaStock users with a library of existing systems.
8NinjaTrader: Best for Futures Technical Analysis
NinjaTrader is the futures trader's technical platform: order-flow tools, volumetric bars, market replay, a strong strategy builder and the NinjaScript C# framework for anything custom. Charting and simulation are free; you pay for the advanced order features.
It is desktop software focused on futures and forex, stock coverage is thin, and NinjaScript is real programming.
Best fit: futures and forex traders who want order-flow analysis.
Free vs Paid Technical Analysis Software
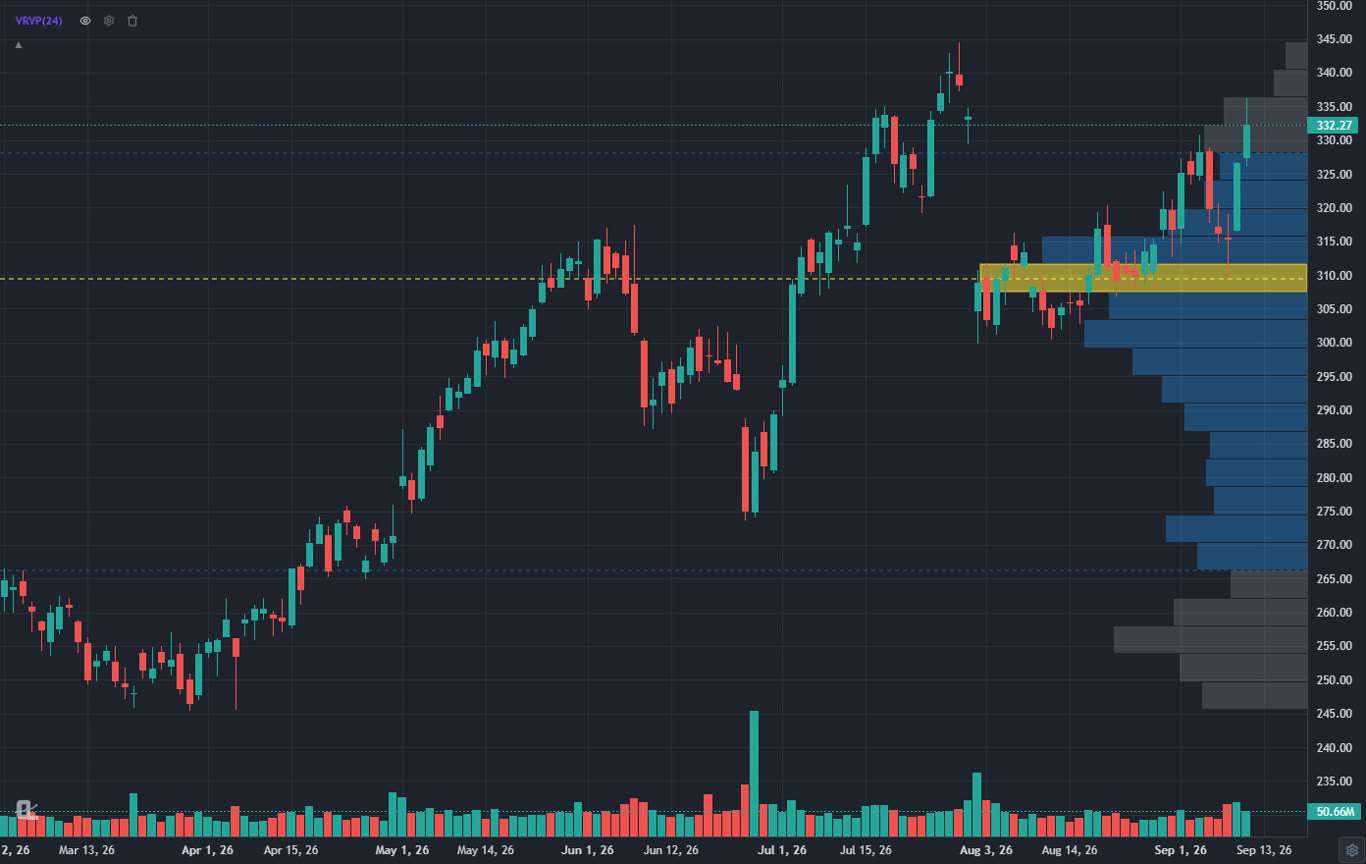
The free tiers on this list fall into three groups. Broker-attached software (thinkorswim, NinjaTrader charting) is free because the broker earns on execution, and it is deep, but it locks you to that broker and runs as a desktop install. Freemium web platforms (ChartingLens, TradingView, StockCharts free) give you a real chart at no cost and charge for depth; the difference is where the line sits. TradingView limits indicators per chart and shows ads on free. StockCharts delays free data. ChartingLens keeps the full technical toolkit free, including volume profile and anchored VWAP, and charges for AI volume, unlimited alerts and layouts, and the heavier automation.
The third group has no free tier at all (TrendSpider, MetaStock, TC2000 beyond a trial). They can be worth it, but only if the specific thing they automate is the thing you spend your time on. The free technical analysis tools guide goes deeper on what each free tier actually includes.
Which Technical Analysis Software Should You Pick?
- You want the most complete technical toolkit for the least money, in a browser: ChartingLens. Start free, add Premium when you want more alerts, layouts and AI.
- You live in community scripts and are happy to learn Pine: TradingView, on Plus or Premium.
- You want the software to draw and scan for you and cost is secondary: TrendSpider.
- You have a Schwab account and want free depth with execution: thinkorswim.
- You trade weekly charts, breadth and classical patterns: StockCharts.
- You scan US stocks all day: TC2000, or the ChartingLens screener with its momentum and breakout presets.
- You trade futures with order flow: NinjaTrader.
Whichever you choose, the test that matters is the same: take one idea you trade, put it into the software, and see how many steps it takes to chart it, scan for it, set the alert and test it. The platform that makes that loop shortest is the one you will actually use. See how to backtest a trading strategy for the testing half of that loop, and the stock charting platforms ranking if charting quality is your first filter.
Related Articles
Best Trading Platforms 2026
Read article → Free ToolsBest Free Technical Analysis Tools
What each free tier really includes, from drawing tools to indicators.
Read article → ChartingBest Stock Charting Platforms 2026
The same platforms ranked on charting quality alone.
Read article → IndicatorsBest Indicators for Day Trading
Which indicators to load once you have picked the software.
Read article →Try the top pick free
A large indicator library, volume profile, anchored VWAP, pattern recognition, drawing alerts and plain-English backtesting in one tab. Free to start, no card required.
Start Charting Free →