Is Finviz Elite Worth It in 2026? Honest Review & Better Alternatives
By ChartingLens TeamApril 5, 202618 min read
📅 May 2026 Update
ChartingLens just launched a new tier structure — Premium at $14.99/mo with sensible quotas (20 alerts, 10 layouts, 20 AI credits/day) and Pro at $29.99/mo with unlimited everything. The Free tier is unchanged: real-time stocks, crypto, forex & metals, all chart types, all drawing tools, cloud sync, and insider data. Yearly plans save 17%. Compare all plans →
Quick Answer
Finviz Elite at $39.99/month upgrades the free screener with real-time data, advanced charts, and a basic backtesting module. However, the charting remains largely non-interactive compared to dedicated platforms, there are no AI features of any kind (no signals, no assistant, no pattern recognition), no hedge fund holdings, no plain-English backtesting, and no bar replay or paper trading. In 2026, platforms like ChartingLens offer all of these features on a free tier with no ads, with Premium at $14.99/mo. For most traders, Finviz Elite is difficult to justify at four times the price of alternatives that deliver substantially more functionality.
Finviz has been a staple of the retail trading community since 2007. The heat maps, the stock screener, the snapshot pages that pack P/E ratios, short float, and insider data into a single view — it is hard to find a trader who has not used Finviz at some point. The free tier is genuinely useful for morning scans and quick fundamental lookups.
But the question that keeps coming up in trading communities is whether Finviz Elite — the paid subscription at $39.99 per month — is actually worth the money. That price puts it squarely in the range of professional-grade trading tools, which raises the bar for what it should deliver. In this review, we break down exactly what Elite adds, what it is still missing, and whether alternatives offer better value in 2026.
1. What Finviz Elite Costs
Understanding whether Finviz Elite is worth it starts with understanding what the free tier already gives you — because a surprising amount of Finviz's core value is available at no cost.
Finviz Free Tier
Stock screener with dozens of fundamental and technical filters (market cap, P/E, RSI, moving averages, sector, industry, short float, and more)
Heat maps for sector and market visualization
Static charts — JPEG images of the daily chart, no interactivity
Stock snapshot pages with fundamentals, analyst ratings, and news
Insider trading table (basic transaction data)
News aggregation from multiple sources
15-minute delayed data
Display ads on every page
Finviz Elite ($39.99/month or $299.50/year)
Real-time data — the primary upgrade from free
Premarket data with extended hours quotes
Advanced charts — slightly more interactive than the free tier's static images
At $39.99 per month, Finviz Elite costs $479.88 per year on the monthly plan, or $299.50 on the annual plan. That puts it in the same price bracket as TradingView Plus ($14.95/month), ChartingLens Premium ($14.99/mo), and Barchart Premier ($19.99/month) — all of which offer interactive charting, technical indicators, and in some cases AI features that Finviz does not have at any tier.
Key question: The Finviz screener — the platform's best feature — is available on the free tier. If you are paying $39.99/month for Elite, you are primarily paying for real-time data, slightly better charts, and no ads. Is that upgrade alone worth $480/year?
2. What Finviz Does Well
Before discussing what is missing, it is important to acknowledge where Finviz genuinely excels. This is not a hit piece — Finviz does several things better than almost any other platform, and those strengths are why it has maintained a loyal user base for nearly two decades.
Best-in-Class Stock Screener
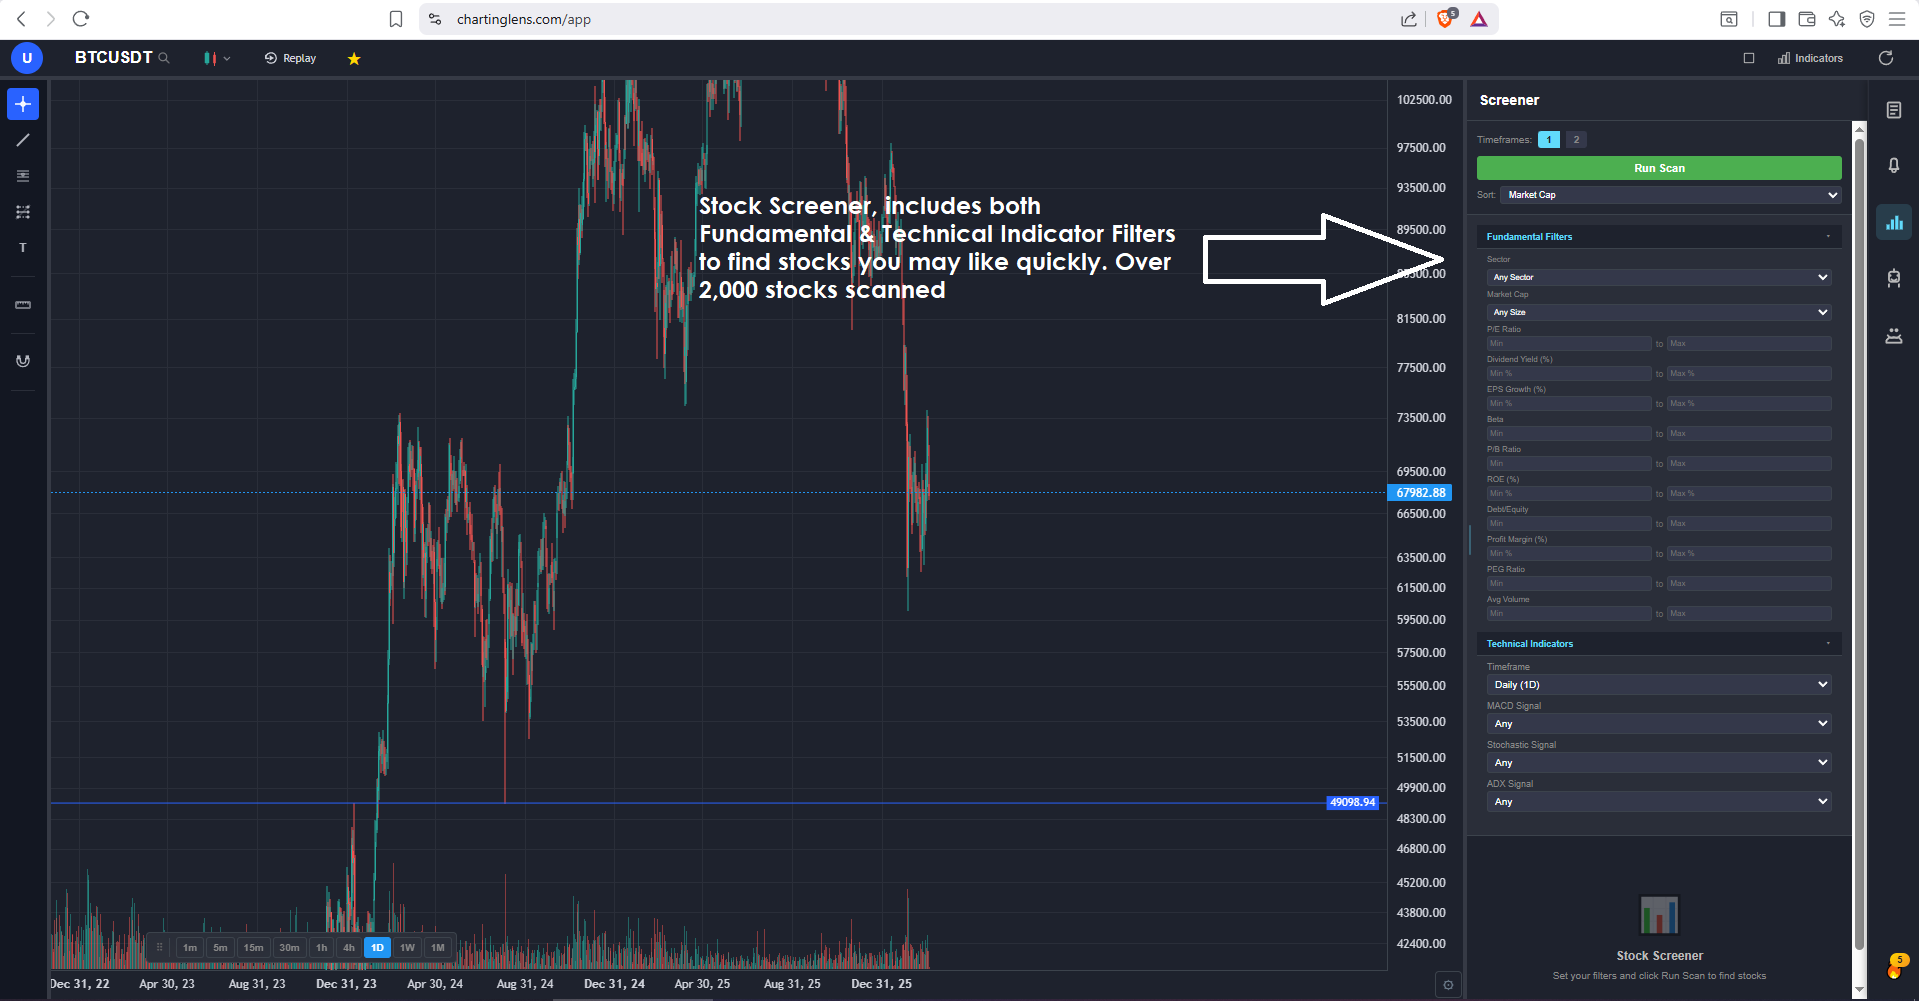
The Finviz screener is legitimately one of the best stock screening tools available anywhere, free or paid. It offers over 60 filter criteria spanning fundamental metrics (market cap, P/E ratio, PEG, EPS growth, dividend yield, price-to-book, price-to-sales, debt-to-equity, return on equity, short float, institutional ownership), technical indicators (RSI, MACD crossover, moving average relationships, 52-week price position, average volume, relative volume), and descriptive filters (sector, industry, country, exchange, market cap category). The interface is fast, intuitive, and returns results almost instantly. For traders who run multi-criteria scans every morning, Finviz's screener is hard to beat on raw filter depth.
Heat Maps for Market Visualization
Finviz's heat maps became iconic in the trading community for good reason. A single glance tells you which sectors are green, which are red, and how individual large-cap stocks are performing relative to their sector peers. For traders who want a quick visual pulse check on the market before diving into individual names, the heat map remains one of the most efficient tools available. The sector-level grouping and size-weighted display provide genuine market intelligence in seconds.
Snapshot Pages for Quick Stock Overview
Each stock on Finviz has a snapshot page that consolidates key fundamentals (P/E, forward P/E, EPS, market cap, dividend yield), a static chart, recent news headlines, analyst ratings, and insider transaction data into a single view. For fundamental-first investors who want a rapid overview of a company without opening five different tabs, snapshot pages deliver solid value.
News Aggregation
Finviz aggregates financial news from multiple sources and organizes it both by individual stock and across the broader market. The news section is clean, ad-supported but readable, and provides a useful morning briefing for traders who scan headlines before the open.
Insider Trading Table
Finviz provides basic insider trading data pulled from SEC Form 4 filings. You can see who bought or sold, how many shares, and at what price. While the presentation is a simple table without visualization or aggregation, it gives fundamental investors a quick read on whether insiders are buying into or selling out of a position.
Credit where it is due: For a free tool, Finviz packs remarkable value into its screener, heat maps, and snapshot pages. The question is not whether Finviz is useful — it clearly is. The question is whether Elite at $39.99/month adds enough to justify the cost.
3. What Finviz Is Missing (Even on Elite)
This is where the value proposition of Finviz Elite starts to break down. The features listed below are not available on any Finviz tier — free or Elite — and they represent the gap between what Finviz offers and what modern trading platforms deliver in 2026.
Charts Are Essentially Static Images
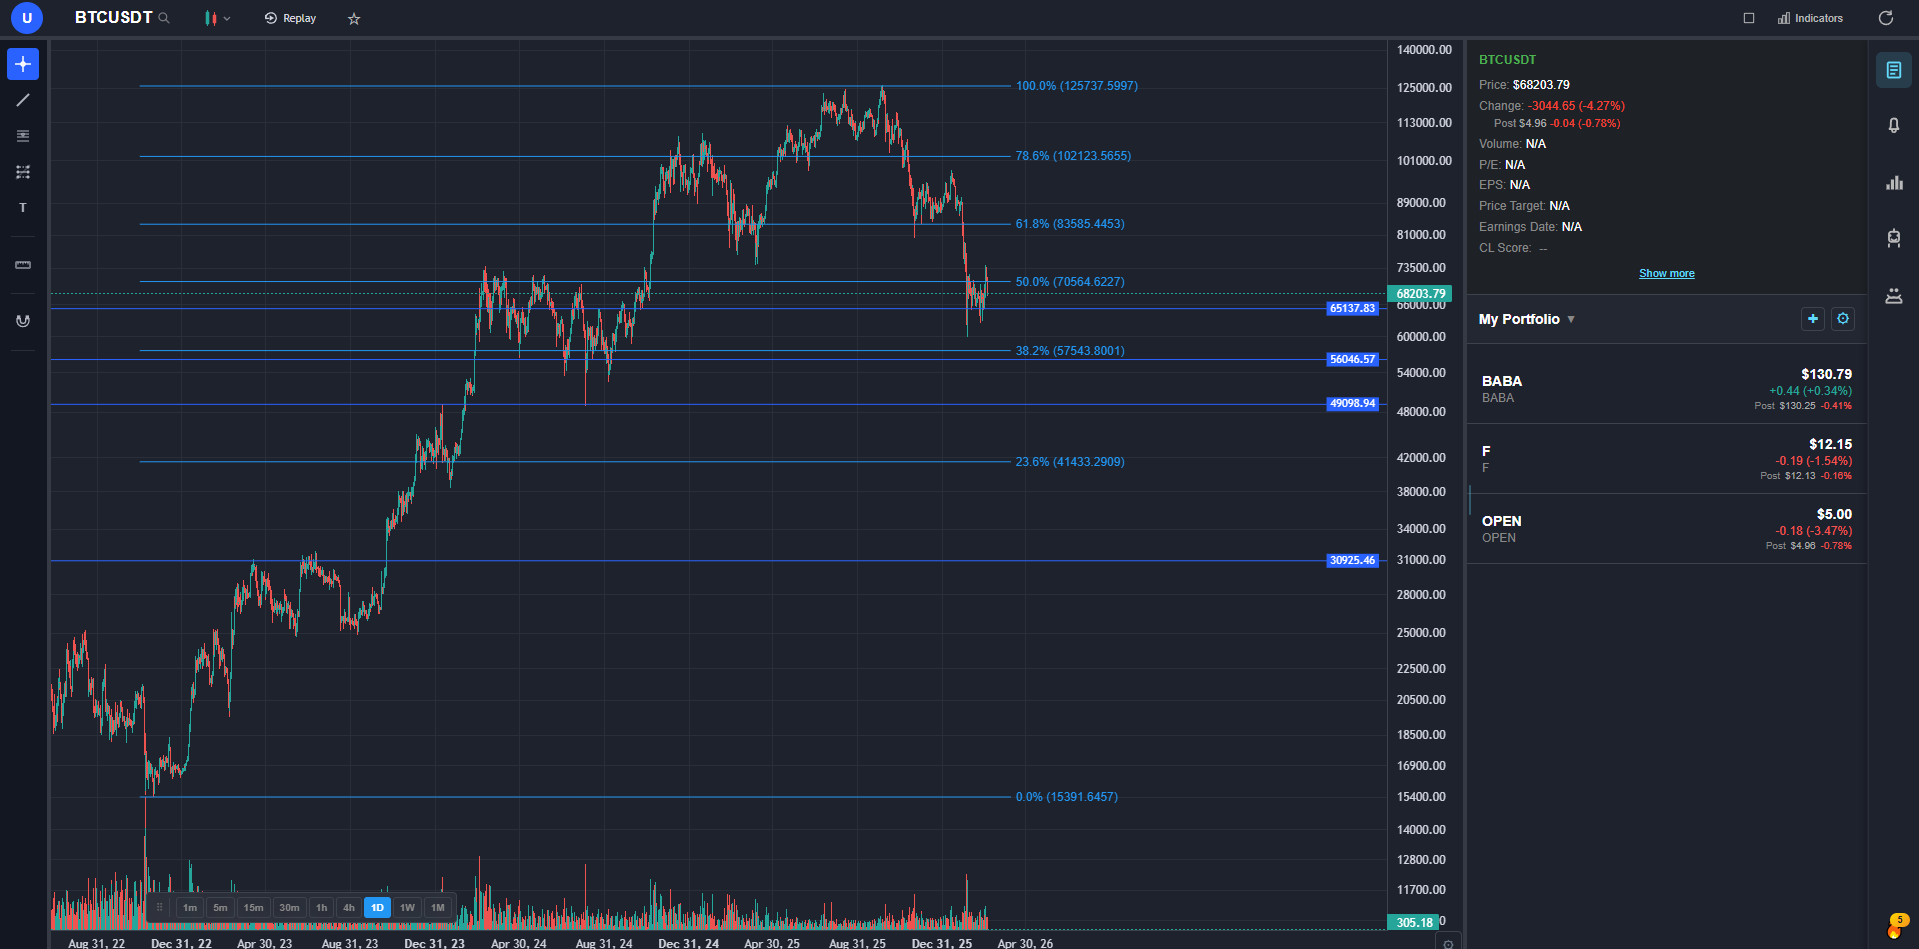
On the free tier, Finviz charts are JPEG snapshots. You cannot zoom, scroll, change timeframes, add indicators, or draw anything. On Elite, charts gain some interactivity, but they remain fundamentally limited. There are no drawing tools for trendlines, channels, or Fibonacci retracements. You cannot overlay multiple technical indicators on the chart the way you can on TradingView, ChartingLens, or thinkorswim. For traders who do any form of technical analysis, Finviz charts — even on Elite — are not a charting platform. They are illustrations.
No Technical Indicators on Charts
This is one of the most surprising gaps. The Finviz screener lets you filter by RSI, MACD, moving averages, and other technical criteria. But the charts themselves do not display these indicators as interactive overlays. You can screen for "RSI below 30" but cannot see RSI plotted on the chart. This disconnect between the screener and the charts forces traders to use a separate charting platform for any real technical analysis — which undermines the value of paying $39.99/month for Elite.
No Drawing Tools
There are no trendline tools, no horizontal support and resistance lines, no Fibonacci retracement tools, no channels, no rectangles, no text annotations. If you want to mark up a chart on Finviz, your only option is to screenshot it and draw on it in a separate application. Every modern charting platform — including free tiers from ChartingLens and TradingView — includes a full suite of drawing tools.
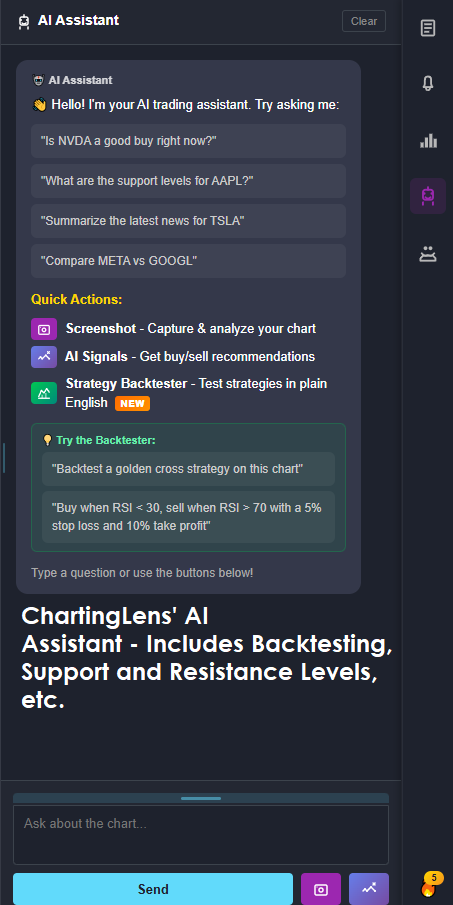
No AI Features
As of 2026, Finviz offers zero AI-powered capabilities. No AI trading assistant, no AI-generated buy/sell signals, no automated chart pattern recognition, no AI-powered backtesting. In a year where platforms like ChartingLens offer AI signals scanning 2,000+ stocks daily, an AI assistant that draws support and resistance levels on your chart, and auto pattern recognition for 13+ chart patterns — all on a free tier — the complete absence of AI on Finviz is a significant competitive gap.
No Hedge Fund Holdings
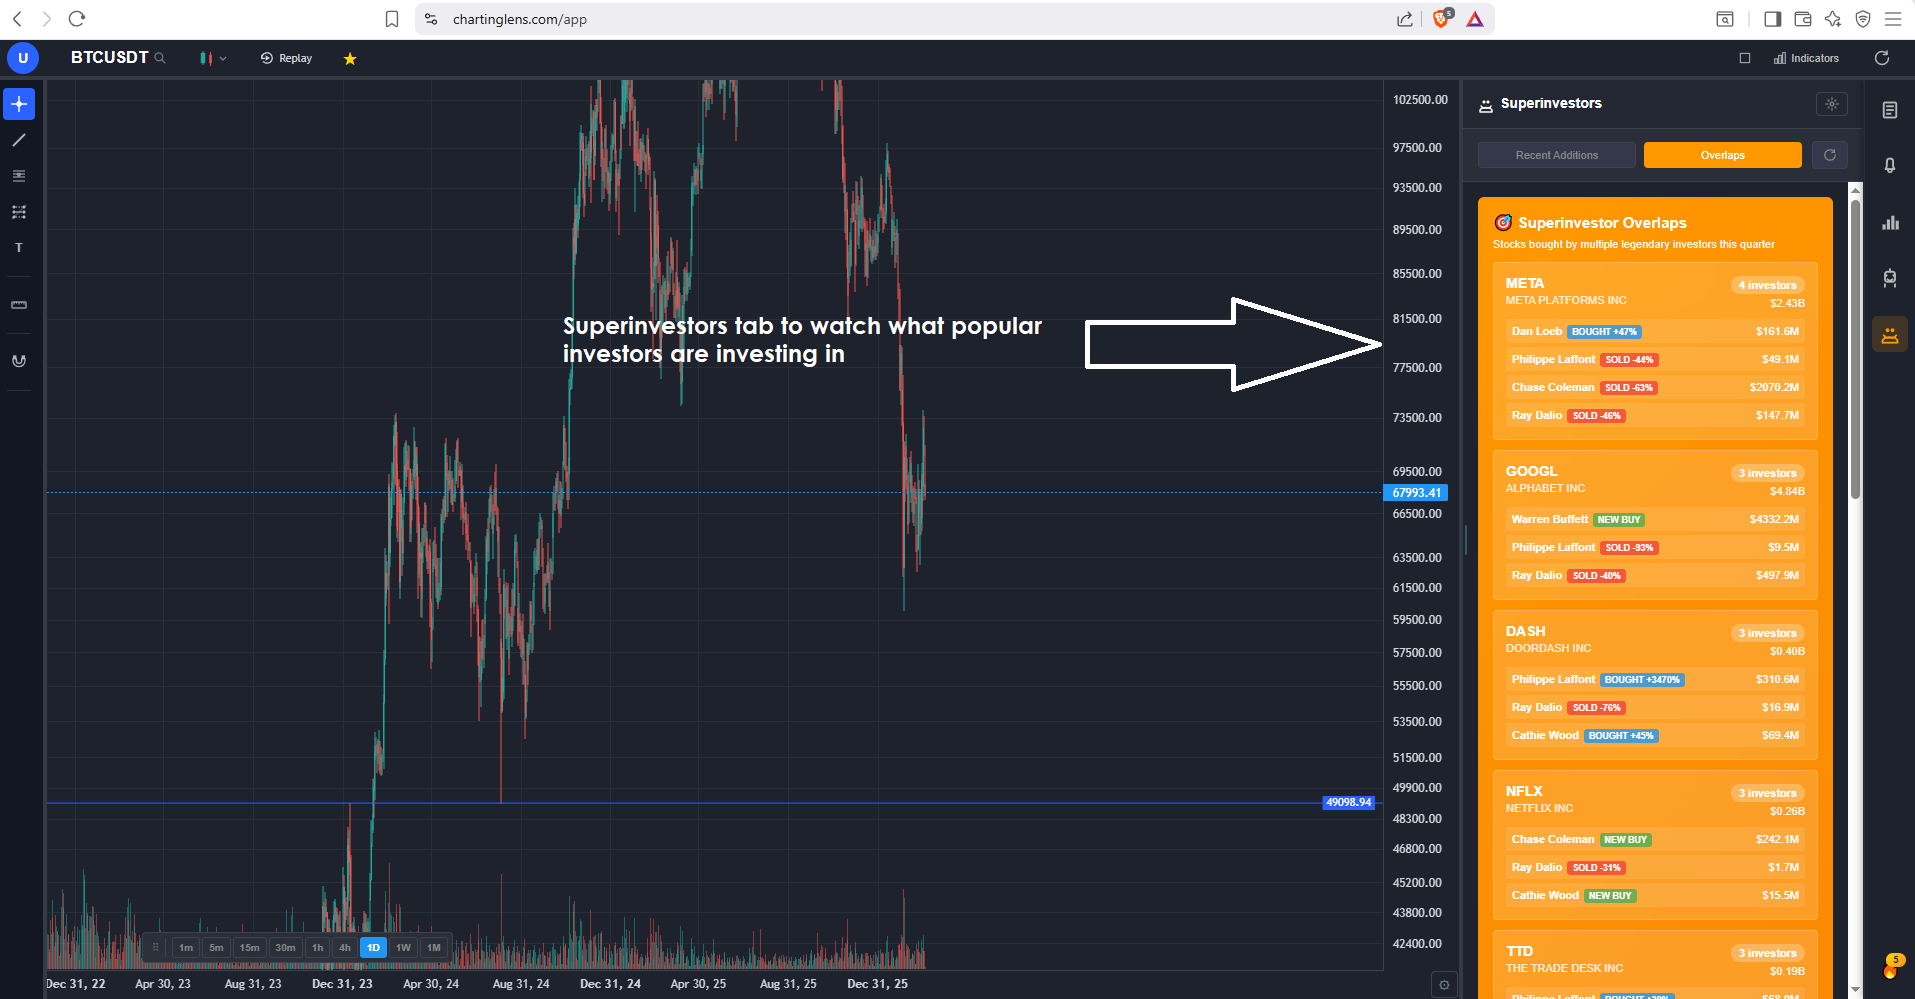
While Finviz shows basic insider transaction data, it does not offer any way to track hedge fund holdings. You cannot follow what Warren Buffett, Michael Burry, Cathie Wood, or other prominent fund managers are buying and selling. ChartingLens provides hedge fund holdings on its free tier, giving traders a macro conviction layer that Finviz does not attempt to deliver.
No Plain-English Backtesting
Finviz Elite includes a basic backtesting module, but it is limited to rule-based testing with predefined conditions. You cannot describe a strategy in natural language and run it against historical data. ChartingLens offers a plain-English backtester that lets you type something like "buy when RSI crosses above 30 and price is above the 200-day EMA" and see results — without writing any code.
No Bar Replay or Paper Trading
There is no bar replay feature on Finviz. You cannot step through historical price data bar by bar to practice your entries and exits. There is no paper trading functionality. ChartingLens includes bar replay with full paper trading — live P&L tracking per bar, the ability to add to positions, partial exits — on its free tier. For traders who want to develop and test their skills without risking real money, this is a significant missing feature on Finviz.
Screener-First, Not a Charting Platform
The fundamental issue is that Finviz was built as a screening and data visualization tool, not a charting platform. Everything about its design prioritizes data tables, filter dropdowns, and quick snapshots. The charts exist as supporting illustrations, not as the primary analytical workspace. For traders who need both screening and charting, Finviz provides half the workflow and forces you to go elsewhere for the other half.
4. Finviz Elite vs ChartingLens: Feature Comparison
Here is a direct side-by-side comparison of what you get on each platform at each price tier.
Scroll horizontally to see all columns →
Feature
Finviz Free
Finviz Elite ($39.99/mo)
ChartingLens Free
ChartingLens Premium ($14.99/mo)
Stock Screener
✓ Full filters
✓ Full filters
✓ CL Score ranking
✓ CL Score ranking
Interactive Charts
✗ Static images
Basic interactivity
✓ Full interactive
✓ Full interactive
Technical Indicators
✗
✗ Not on charts
✓ 40+ indicators
✓ 40+ indicators + VRVP
Drawing Tools
✗
✗
✓ Full suite
✓ Full suite
AI Buy/Sell Signals
✗
✗
✓ 2,000+ stocks
✓ 2,000+ stocks
AI Trading Assistant
✗
✗
✓ Draws S&R levels
✓ Draws S&R levels
Auto Pattern Recognition
✗
✗
✓ 13+ patterns
✓ 13+ patterns
Bar Replay / Paper Trading
✗
✗
✓ Live P&L
✓ Live P&L
Backtester
✗
Basic rule-based
✓ Plain-English
✓ Unlimited
Hedge Fund Holdings
✗
✗
✓
✓
Insider Trading Data
Basic table
Basic table
✓ Live feed
✓ Live feed
Heat Maps
✓
✓
✗
✗
Price Alerts
✗
✓ Email alerts
✓
✓
Ads
Ads everywhere
No ads
No ads
No ads
Monthly Price
Free
$39.99/mo
Free
$14.99/mo
Annual Cost
$0
$299.50/yr (annual) or $479.88/yr (monthly)
$0
$119.88/yr
Key Takeaway
ChartingLens's free tier includes features that Finviz does not offer even on its $39.99/month Elite plan: interactive charts, AI signals, pattern recognition, bar replay, and hedge fund holdings.
Finviz's clear advantage is heat maps and raw screener filter depth — both available on the free tier.
At $14.99/mo, ChartingLens Premium costs one quarter of Finviz Elite while delivering substantially more charting and AI functionality.
5. Who Should Pay for Finviz Elite
Despite the gaps outlined above, there are specific use cases where Finviz Elite makes sense. We want to be honest about this — not every trader needs what ChartingLens offers, and some workflows genuinely benefit from what Elite provides.
Traders who depend on real-time screener data for intraday scanning: If your morning workflow involves running Finviz screener scans and you need real-time price, volume, and relative volume data (not 15-minute delayed), Elite delivers that. The screener is the platform's strongest feature, and real-time data makes it meaningfully more useful for day traders scanning for setups pre-market and during the session.
Traders who use Finviz exclusively as a scanning tool alongside a separate charting platform: Many experienced traders already treat Finviz as a scanning front end. They run screens on Finviz, copy tickers to TradingView or ChartingLens or thinkorswim, and do their charting and analysis there. If you are in this camp and the real-time data matters to your scanning, Elite is a reasonable expense — you are not relying on Finviz for charting, so its charting limitations are irrelevant to your workflow.
Traders who specifically need the Finviz backtesting module: Elite's backtesting is basic but functional for testing simple rule-based screening strategies. If you want to see how a Finviz screener filter combination performed historically, the backtester provides that within the same interface. It is not comparable to a full backtesting platform, but for screener-level backtesting, it works.
Teams or professionals who need the ad-free experience for presentations or reports: If you share Finviz screens in research reports or client presentations, the ad-free experience of Elite is a practical consideration.
6. Who Should Switch to ChartingLens
For a larger group of traders, switching from Finviz Elite to ChartingLens — or supplementing Finviz Free with ChartingLens — delivers more value at a fraction of the cost.
Traders paying $40/month for Finviz when they could get screening + real charting + AI for $14.99: If you are paying for Elite primarily because you want a complete analysis platform, ChartingLens delivers more for less. You get a stock screener with CL Score, fully interactive charts with 40+ indicators, AI buy/sell signals, pattern recognition, backtesting, insider data, and hedge fund holdings — all at $14.99/mo or free. The math is straightforward: $14.99 versus $39.99 for more features.
Traders who want interactive charts, not static images: If you have been frustrated by Finviz's chart limitations — unable to draw trendlines, unable to add RSI or MACD overlays, unable to zoom into price action — ChartingLens's free tier solves this instantly. Full interactive charting with drawing tools and 40+ indicators, no subscription required.
Traders who want AI analysis with their screening: If you want AI-generated buy/sell signals, an AI assistant that draws support and resistance on your chart, and automated chart pattern recognition, Finviz cannot deliver any of this at any price. ChartingLens offers all of it for free.
Traders who want to practice strategies without risking real money: Finviz has no bar replay or paper trading. ChartingLens's bar replay with live P&L tracking lets you practice trading on historical data, refine your entries and exits, and build confidence before committing real capital.
Traders who want to follow institutional money: If tracking what hedge fund managers like Warren Buffett, Michael Burry, and Bill Ackman are buying and selling is part of your research process, ChartingLens provides this on the free tier. Finviz only shows basic insider transactions and has no hedge fund holdings whatsoever.
Budget-conscious traders who want to cut software costs: Switching from Finviz Elite to ChartingLens Premium saves you $360 per year on the monthly plans, or roughly $180 per year comparing annual pricing. For retail traders watching their expenses, that is a meaningful amount of capital freed up for actual trading.
The hybrid approach: You do not have to choose one or the other. Many traders use Finviz's free screener and heat maps for morning scans, then switch to ChartingLens for chart analysis, AI signals, and backtesting. This gives you Finviz's best feature (the screener) without paying for Elite, combined with ChartingLens's charting and AI tools — all at a total cost of $0 to $14.99/mo.
7. Verdict: Is Finviz Elite Worth $39.99/Month in 2026?
Finviz is a legitimately good product. The screener is best-in-class. The heat maps are iconic. The snapshot pages are efficient. For what it was built to do — screen stocks and visualize market data — Finviz does its job well, and the free tier delivers remarkable value.
But Finviz Elite at $39.99/month is a harder sell in 2026. The primary upgrade is real-time data and an ad-free experience. The charts, even on Elite, do not compete with free tiers from modern charting platforms. There are no AI features at any price point. There is no bar replay, no hedge fund holdings, no drawing tools, and no technical indicator overlays on charts. You are paying a premium price for a product that has not evolved to match the capabilities that newer platforms offer for free.
For traders who specifically need real-time Finviz screener data and use the platform purely as a scanning tool alongside a separate charting platform, Elite can be justified. For everyone else — especially traders who need charting, AI analysis, or backtesting — ChartingLens delivers more value on its free tier than Finviz Elite does for $39.99/month.
Our honest recommendation: use Finviz's free tier for what it does best (screening and heat maps), and use ChartingLens for everything else (charting, AI signals, pattern recognition, backtesting, insider data, hedge fund holdings). You get the best of both worlds at a total cost of $0 to $14.99/mo instead of $39.99/month for Finviz Elite alone.
8. Frequently Asked Questions
Finviz Elite at $39.99/month adds real-time data (the free tier has a 15-minute delay), premarket data, advanced charts with slightly more interactivity, a basic backtesting module for screening strategies, email alerts, correlation analysis tools, and removes all display ads. The stock screener itself, heat maps, snapshot pages, and insider transaction tables are the same on both tiers. The primary value of Elite is the real-time data upgrade — the charting improvements are modest and still do not include drawing tools, technical indicator overlays, or AI features of any kind.
For most traders, no. In 2026, real-time stock data is available for free on platforms like ChartingLens, Webull, and Barchart. Paying $39.99/month primarily for a delayed-to-real-time upgrade is difficult to justify when competitors provide real-time data alongside features Finviz does not offer at any tier — including interactive charts, AI buy/sell signals, pattern recognition, and backtesting. The exception is traders who specifically need real-time data within the Finviz screener interface for intraday scanning workflows where no other screener provides the same filter depth.
Yes — Finviz's own free tier already includes its full stock screener with all fundamental and technical filters. You do not need Elite to access the screener; only the real-time data and advanced charts require a paid subscription. For additional screening options, ChartingLens offers a free stock screener with CL Score ranking that integrates directly with AI analysis. Thinkorswim (free with a Schwab account) provides Stock Hacker with over 300 indicators and thinkScript for advanced custom scans. TC2000 offers powerful condition-based scanning with EasyScan, though its full features require a paid plan.
On the free tier, no — Finviz charts are static JPEG images. On Elite, charts gain basic interactivity (zooming, time period selection), but they remain fundamentally limited. There are no drawing tools for trendlines, Fibonacci retracements, or support/resistance lines. There are no technical indicator overlays plotted on the chart. For traders who need real chart analysis, ChartingLens provides fully interactive charts with 40+ technical indicators and a complete set of drawing tools on its free tier — no subscription needed.
ChartingLens Premium at $14.99/mo — one quarter of Finviz Elite's price — includes AI buy/sell signals scanning 2,000+ stocks, an AI trading assistant that draws support and resistance levels, automated chart pattern recognition for 13+ patterns, fully interactive charts with 40+ indicators plus Volume Profile (VRVP), a plain-English backtester, bar replay with paper trading, insider trading data, hedge fund holdings, a stock screener with CL Score, and price alerts. Most of these features are also available on ChartingLens's completely free tier. Finviz has no AI features, no interactive charting, and no hedge fund holdings at any price.
Absolutely, and many traders do exactly this. Finviz's free screener and heat maps remain excellent for quick morning scans and sector visualization — there is no reason to give those up. You can use Finviz to build a watchlist based on screener criteria, then switch to ChartingLens for deep chart analysis with AI signals, pattern recognition, insider data, and backtesting. This hybrid approach gives you the best of both platforms at a total cost of $0 (using both free tiers) or $14.99/mo (adding ChartingLens Premium) — compared to $39.99/month for Finviz Elite alone with none of the AI or charting features.
Try ChartingLens Free — Real Charts + AI Analysis for Less Than Finviz Elite
Get AI signals, interactive charting, strategy backtesting, insider data, hedge fund holdings, and a stock screener with CL Score. No download. No credit card. No ads.