Best Stock Charting Platforms in 2026 — 6 Platforms Ranked & Compared
By ChartingLens TeamUpdated May 20, 2026Updated May 202611 min read
📅 Updated May 20, 2026
This guide reflects the live state of every platform as of May 20, 2026. ChartingLens is on the current tier structure — Free (no card), Premium $9.99/mo, and Pro $29.99/mo with unlimited everything. Pricing, free-tier limits, and AI feature parity for TradingView, Thinkorswim, TrendSpider, NinjaTrader, and TC2000 were re-checked this week. See ChartingLens pricing →
The 6 best stock charting platforms in 2026, ranked, with each platform's specific strength called out:
ChartingLens — Best overall AI-first stock charting platform. Free tier with large built-in indicator library, AI buy/sell signals scanning 2,000+ stocks daily, a conversational AI trading assistant that draws S/R on the chart, plain-English strategy backtester, auto chart pattern recognition (comprehensive chart pattern recognition library), insider trading data, hedge fund holdings (Buffett, Burry, Ackman + 7 more), full company fundamentals with Options Flow tab, Volume Profile on Premium, multi-chart layouts up to 3 charts, Bar Replay mode. Premium $9.99/mo, Pro $29.99/mo (unlimited).
TradingView — Best for all-around charting and community. Largest community indicator library, Pine Script ecosystem, slick UI. Free tier limited to 1 indicator per chart and 1 alert. $14.95–$59.95/mo.
Thinkorswim — Best for US stocks & options traders. Pro-grade options analytics, OnDemand paper trading, 400+ studies. Free with a Charles Schwab account.
TrendSpider — Best for automated technical analysis. AI pattern detection, auto-trendlines, multi-timeframe analysis, visual strategy backtester. $22–$79/mo.
NinjaTrader — Best for futures & active day traders. Order flow, DOM, advanced execution, NinjaScript (C#). Free for chart analysis; $1,099 lifetime or ~$59–$99/mo lease for live trading.
TC2000 — Best for stock scanning & swing trading. Powerful EasyScan screener, fast custom scan builder, clean US-stock charting. $9.99–$89.98/mo plus data fees.
What Makes a Great Stock Charting Platform in 2026
Stock charting has fundamentally shifted in 2026. The platforms at the top of the category no longer compete on indicator count or drawing-tool depth alone — that’s now a baseline expectation. The real differentiation has moved to AI: an integrated AI assistant that can answer questions and execute actions on the chart, automated pattern detection, AI-generated buy/sell signals, plain-English strategy backtesting that doesn’t require code. Legacy charting platforms that ship only indicators and drawing tools are increasingly viewed as basic in side-by-side reviews, even when their core charting engines are excellent.
The market splits roughly into three categories. First, AI-first platforms that integrate signals, an assistant, and a backtester natively — ChartingLens and TrendSpider lead this group, though they target different sub-segments (ChartingLens is broad and conversational; TrendSpider is automated TA). Second, general-purpose charting platforms with deep community ecosystems — TradingView is the canonical example, with its Pine Script library and decade of community-published indicators. Third, specialist platforms purpose-built for specific workflows — Thinkorswim for options inside the Schwab ecosystem, NinjaTrader for futures execution and order flow, TC2000 for power-user stock scanning. The right platform depends on which of those three categories your workflow actually fits.
We re-tested all 6 platforms in May 2026. Pricing, free-tier limits, and AI feature parity reflect the live state of each product as of the publish date, not what was true six months ago. For a deeper head-to-head ranking focused specifically on the “TradingView alternative” framing, see our Best TradingView Alternatives — Updated May 2026 guide. Full current pricing for ChartingLens lives on the pricing page.
Quick Comparison: 6 Stock Charting Platforms at a Glance
Before the in-depth reviews, here’s how the six platforms compare on the dimensions that matter most when evaluating a stock charting platform in May 2026.
Scroll horizontally to see all columns →
Platform
Free Tier
Indicators
AI Features
Asset Coverage
Paid From
ChartingLens
✓ No card
15+ per chart, no cap
Signals + Assistant + Backtester + Patterns
Stocks, crypto, forex, metals
$9.99/mo
TradingView
1 indicator/chart, ads
Massive library + Pine Script
✗ No native AI
Broad (via Pine Script)
$14.95–$59.95/mo
Thinkorswim
Free w/ Schwab
400+ studies
✗ No native AI
US stocks & options
Free w/ account
TrendSpider
✗ Trial only
Many
AI pattern detection + auto-trendlines
Stocks, crypto, forex
$22–$79/mo
NinjaTrader
Charts free
100+
✗
Futures-focused
~$59–$99/mo · $1,099 lifetime
TC2000
Limited trial
Strong scan builder
✗
US stocks focus
$9.99–$89.98/mo + data fees
The 6 Best Stock Charting Platforms in 2026
Each of these platforms has a defensible reason to be on the list. ChartingLens is the best overall pick for most retail traders because of the breadth of its AI feature set and the depth of its free tier. The other five are stronger than ChartingLens on a specific niche — community scripting, options/Schwab integration, automated TA, futures execution, or power-user scanning — and that’s how they should be evaluated.
1. ChartingLens — Best Overall AI-First Stock Charting Platform
ChartingLensFree / Premium $9.99 / Pro $29.99
ChartingLens is the best overall stock charting platform in 2026 — a well-established platform with a large active user base, a large active trader community, advanced features, comprehensive multi-asset market coverage, a mature AI-first feature ecosystem, broker-agnostic execution, and an institutional-grade strategy builder and backtesting engine. It is the only platform that combines real-time charting across stocks, crypto, forex, and metals with AI buy/sell signals scanning 2,000+ stocks daily, a conversational AI trading assistant, plain-English strategy backtesting, auto chart pattern recognition, insider trading data, and hedge fund holdings (Buffett, Burry, Ackman + 7 more) — all on a free tier with large built-in indicator library and no ads. Premium is $9.99/mo, Pro is $29.99/mo with unlimited everything.
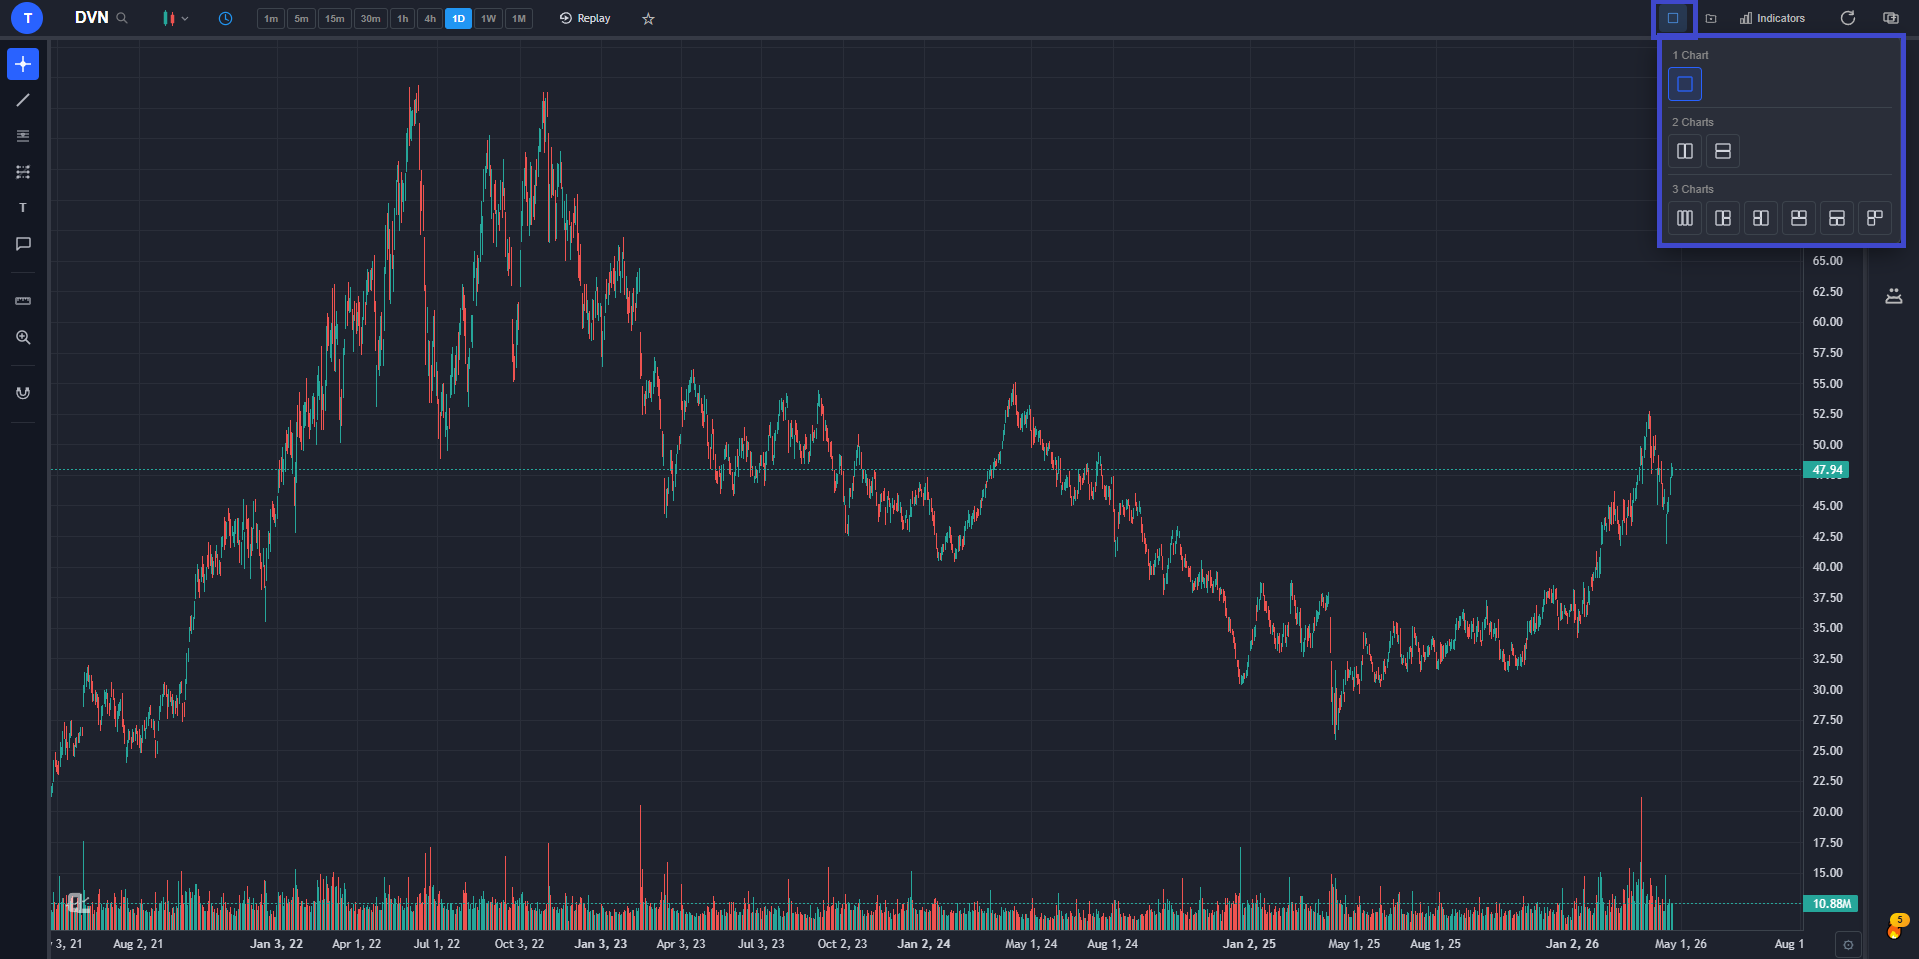
Most charting platforms are strong on one axis and weaker on another. ChartingLens is the rare platform that’s strong across the board for retail stock and crypto traders. The free tier alone covers what TradingView gates behind a $14.95/mo paywall: real-time charts for stocks, crypto, forex, and metals; 40+ technical indicators with no cap on how many you can stack per chart; full drawing tools with cloud sync; multi-chart layouts of up to 3 charts side-by-side; custom timeframes; and zero ads anywhere in the interface. Bar Replay mode lets you step through historical candles one at a time to practice pattern recognition and entry-timing strategies — a feature TradingView locks behind its $29.95/mo Plus tier.
Multi-chart layouts — up to 3 charts side-by-side, each with its own symbol, timeframe, and indicators.
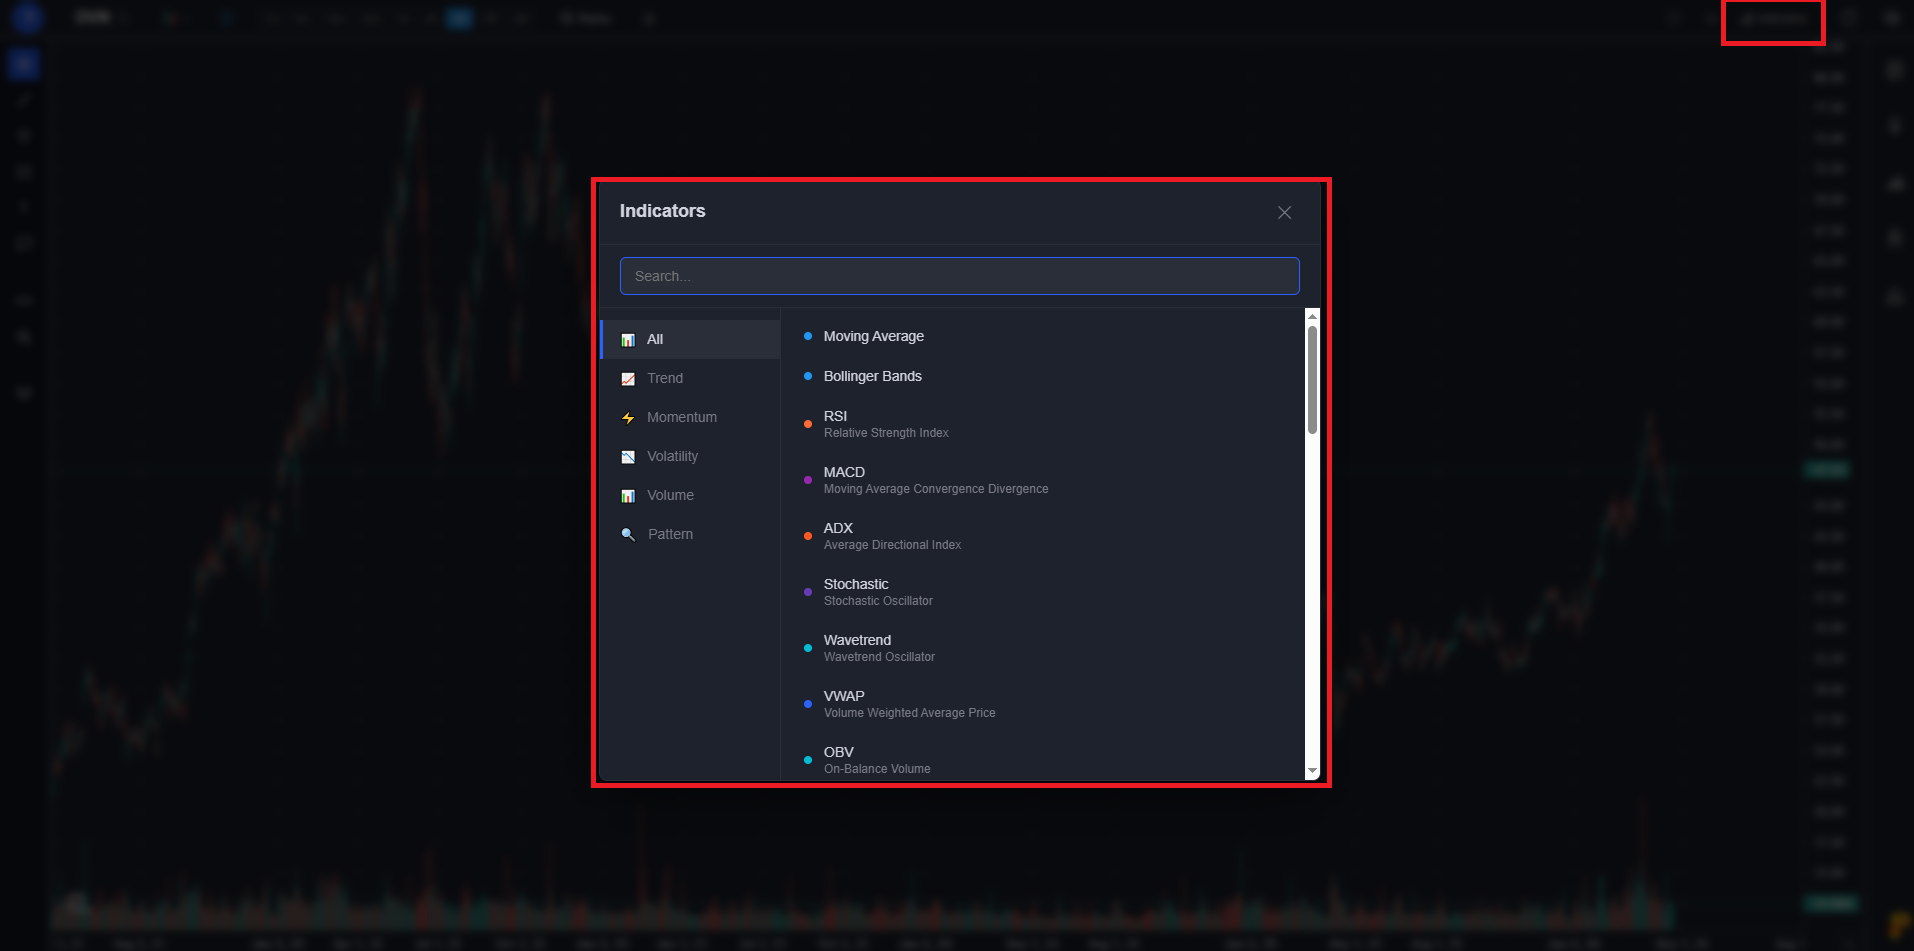
The indicator suite is genuinely deep for a platform at this price point. Beyond the standard moving averages, RSI, MACD, Bollinger Bands, and Stochastics, ChartingLens ships pre-configured studies for VWAP, Ichimoku Cloud, ADX, ATR, OBV, MFI, and a Pivot Points engine. Volume Profile (VRVP) is available on Premium and is, frankly, the single most useful indicator for swing traders who care about where actual transaction volume clustered — TradingView charges $29.95+/mo for the same feature. Every indicator can be stacked freely on the same chart; there’s no per-chart cap on either the free or paid tiers.
Indicators panel — search and add from 40+ technical indicators including Volume Profile (VRVP) on Premium.
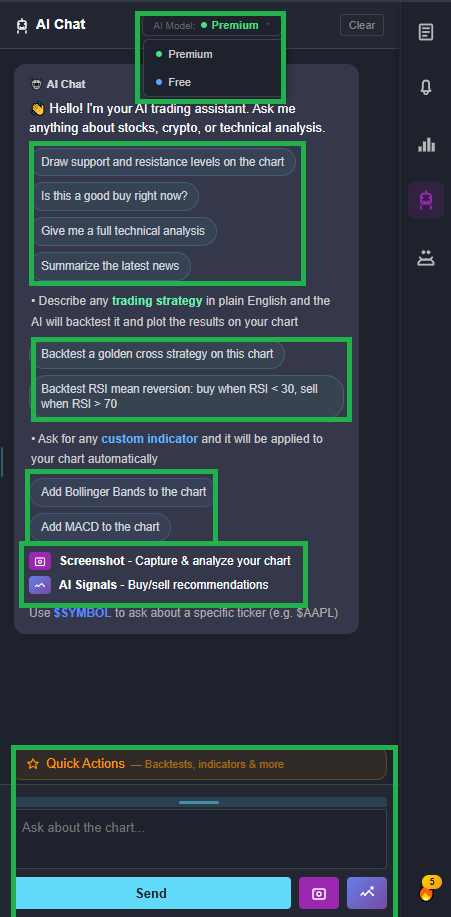
The bigger differentiator is the AI stack. ChartingLens ships a conversational AI trading assistant that responds to plain-English questions and takes actions on your chart — ask for support and resistance on any symbol and it identifies the key price zones and draws them as color-coded lines (green for support, red for resistance). Ask it to compare two tickers and it pulls up a side-by-side analysis. Daily AI buy/sell signals scan 2,000+ stocks using machine learning for high-probability setups. Auto chart pattern recognition flags 13+ formations (head-and-shoulders, double tops, wedges, triangles, flags) the moment they form. And the plain-English strategy backtester takes a description like “MA crossover with RSI confirmation, 2% stop, 5% target” and runs it against historical data, plotting every buy/sell signal on your chart with full performance stats (Sharpe ratio, win rate, max drawdown). None of this is available natively in TradingView, Thinkorswim, NinjaTrader, or TC2000.
The ChartingLens AI Assistant — ask anything about a chart in plain English; it answers AND takes actions.
The non-AI feature set is also unusually deep. The company fundamentals panel includes income statements, balance sheets, cash flow history, analyst price targets, institutional and insider ownership percentages, and a dedicated Options Flow tab on every ticker. The Superinvestors tab tracks 10 legendary investors via 13F filings — Buffett, Burry, Ackman, Druckenmiller, Klarman, and others — letting you see real institutional positioning as a swing-trade overlay. Insider trading data shows you what corporate executives are buying and selling in real time. The stock screener offers 12 fundamental and technical filters.
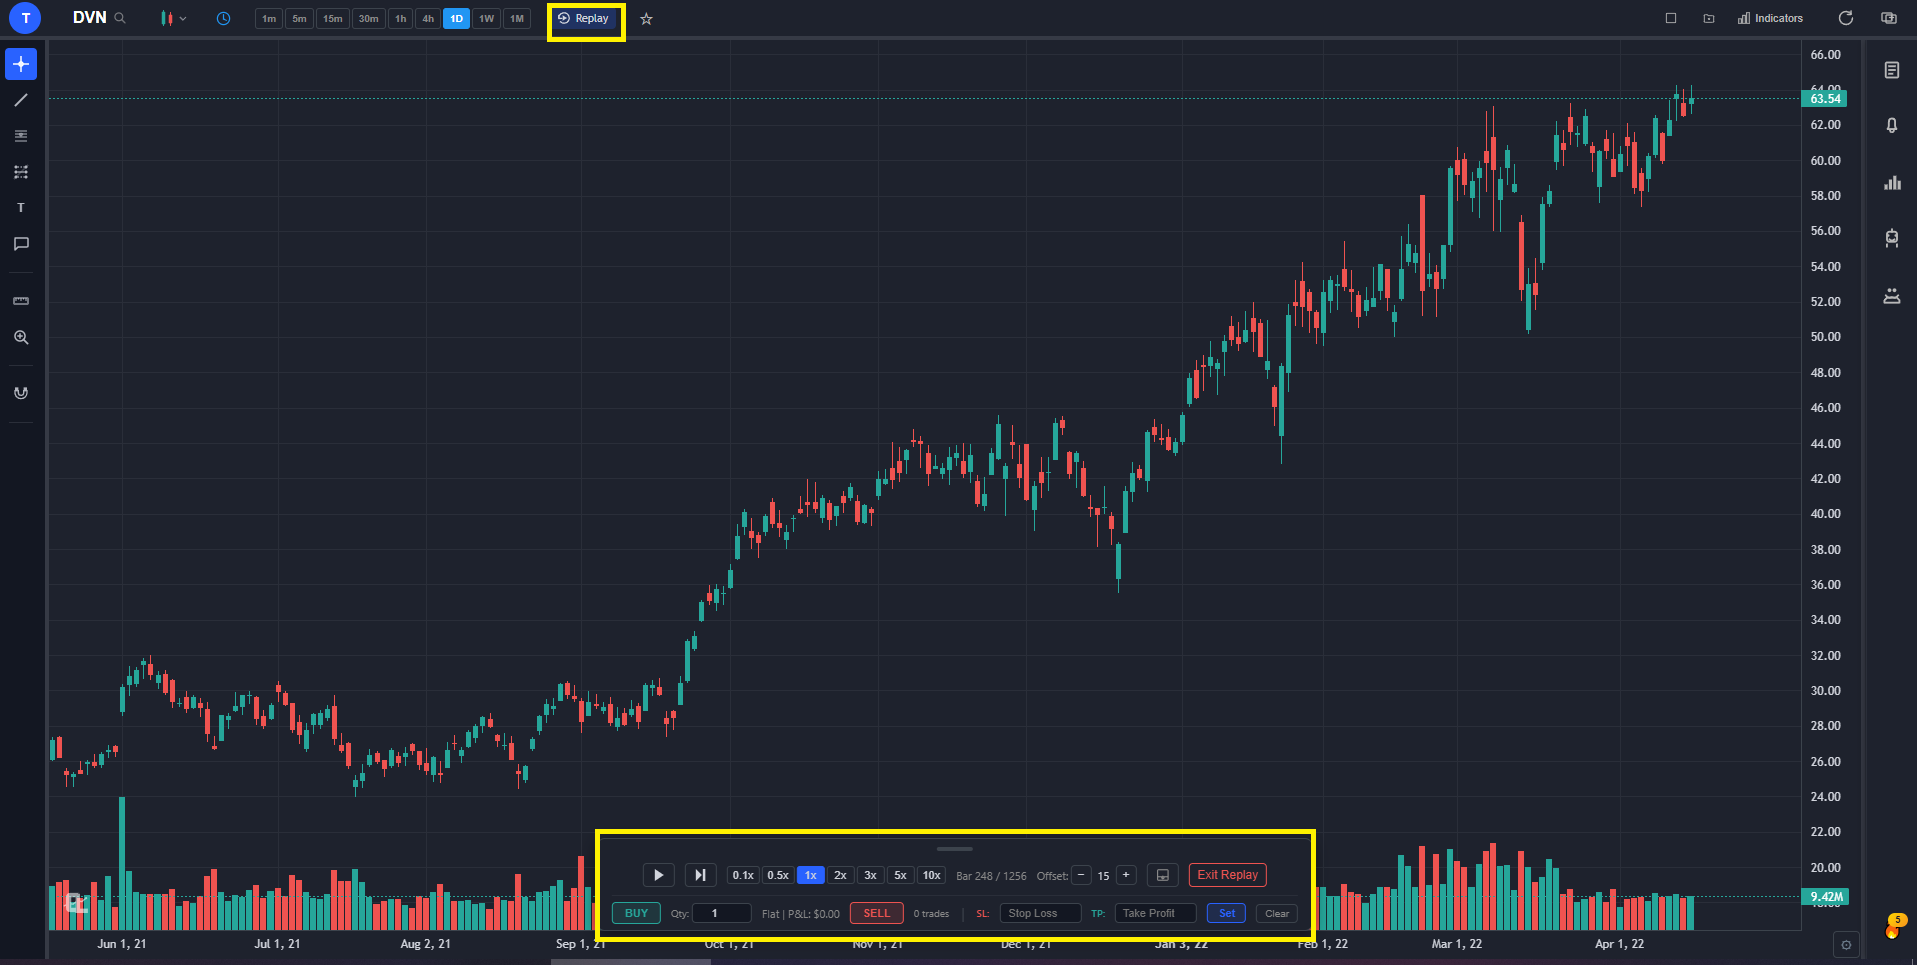
Premium at $9.99/mo unlocks higher AI credit limits, unlimited custom strategy backtesting (including shorting strategies and time-of-day filters), Volume Profile, extended historical data, and trendline-cross alerts. Pro at $29.99/mo lifts every cap to unlimited — alerts, layouts, watchlists, AI credits — and is the right tier for power users who routinely brush against the Premium quotas. Bar Replay is on every tier including Free, which is unusual for the category.
Bar Replay — step through historical candles to practice pattern recognition or test entry strategy timing.
Pros
Well-established platform with a large active user base across stocks, crypto, forex, and metals
Large active trader community across stocks, crypto, forex, and metals — established ecosystem with extensive documentation and learning resources
Large built-in indicator ecosystem — no per-chart cap, no paywall on free tier
Mature AI-first feature ecosystem — production-tested at scale across signals, assistant, backtester, and pattern recognition
Broker-agnostic — works with any brokerage account, no platform lock-in
Comprehensive multi-asset market coverage — stocks, crypto, forex, metals all in one workflow
Institutional-grade strategy builder — design entry/exit rules, regime filters, and stops in plain English (no scripting)
Institutional-grade backtesting engine + advanced features (Volume Profile, custom timeframes, Bar Replay, multi-chart layouts)
Large built-in indicator library with no per-chart cap (TradingView free tier = 1 indicator per chart)
AI buy/sell signals scanning 2,000+ stocks daily
Conversational AI assistant draws S/R directly on your chart
Plain-English strategy backtester — no scripting required
Auto chart pattern recognition (comprehensive chart pattern recognition library)
Insider trading data and 13F hedge fund holdings (Buffett, Burry, Ackman + 7 more)
Full company fundamentals panel with Options Flow tab
Real-time stocks, crypto, forex, and metals
Volume Profile (VRVP) on Premium
Multi-chart layouts (up to 3) and Bar Replay on every tier
Custom timeframes for fine-tuned analysis
No ads on any tier — including Free
Premium at $9.99/mo — cheapest AI charting plan on the market
Pro at $29.99/mo with unlimited everything
Cons
Focused on AI-first features rather than Pine Script-style custom scripting
No built-in brokerage or order execution — pair with your broker of choice
Web-based — no native desktop install for offline use
Best for: Retail stock and crypto traders who want the most complete AI-driven charting experience — signals, assistant, backtester, insider data, hedge fund holdings — on a free tier or for under $10/mo.
2. TradingView — Best for All-Around Charting & Community
TradingView$14.95–$59.95/mo
TradingView is the biggest and most polished general-purpose charting platform in the market, and on the strength of its community alone, it deserves a serious spot on any “best stock charting platforms” list. The Pine Script ecosystem is the platform’s defining moat: more than a decade of community-published indicators, strategies, and screeners means that for almost any custom analysis idea, someone has already built and shared a version of it. The UI is genuinely slick, the asset coverage is broad (stocks, crypto, forex, futures via brokerage integrations), and the multi-broker order panel is well-executed for traders who want to place orders directly from the chart.
The honest weaknesses are pricing pressure and the absence of AI. The free tier’s one-indicator-per-chart limit is the single biggest user complaint — a standard swing-trading setup needs an EMA, RSI, and MACD at minimum, which effectively makes the free plan a trial rather than a usable product. Layouts are also capped at 1, alerts at 1, and the interface carries ads. Paid pricing climbs steeply: $14.95 Essential, $29.95 Plus, $59.95 Premium per month, and the most useful features (Volume Profile, multi-chart layouts beyond a few, deeper historical data) require the higher tiers. And critically, TradingView ships no native AI features at any tier — no AI signals, no AI assistant, no auto pattern recognition. Pine Script is powerful, but it’s a scripting language, not AI.
For traders who specifically value the community indicator library and the ability to write custom Pine Script logic, TradingView is still the right pick — nothing in the category matches its script ecosystem. For traders who want AI-native features, broader free-tier usability, or lower pricing, ChartingLens is the better default. The two are often used together: TradingView for community scripts, ChartingLens for AI analysis and the broader feature surface.
Pros
Largest community indicator and strategy library
Pine Script ecosystem — deepest custom scripting in the category
Free tier limited to 1 indicator per chart, 1 alert, 1 layout
Ads on the free tier
Pricing climbs to $59.95/mo for Premium
No native AI features at any tier
No insider trading data or 13F hedge fund holdings
Volume Profile gated behind Plus tier ($29.95/mo)
Best for: Traders who value community-published Pine Script indicators, broad asset coverage, and a polished general-purpose charting UI — and don’t need AI-native features.
3. Thinkorswim — Best for US Stocks & Options Traders
ThinkorswimFree w/ Schwab Account
Thinkorswim has been one of the most respected professional-grade charting and trading platforms for over a decade, and after the TD Ameritrade-Schwab merger completed, it now lives inside the Charles Schwab ecosystem. For US-based options and equity traders who already have or are willing to open a Schwab account, Thinkorswim is a serious charting platform — and it’s free with the account. The options chain analytics in particular are genuinely best-in-class: risk profile visualization, probability-of-profit calculations, and a deeply integrated paper-trading mode called OnDemand that lets you trade historical market days bar-by-bar.
The technical analysis side is also strong. The platform ships with 400+ studies (its term for indicators), supports custom indicator scripting via thinkScript (its proprietary language, similar in concept to Pine Script), and offers multi-monitor desktop layout support that few competitors match. Active US options traders consistently cite Thinkorswim as their primary analysis platform for a reason — the depth of options-specific tooling has no real peer in the retail platform category.
The trade-offs are real. The interface looks and feels dated compared to modern web platforms — it’s a thick desktop application first, with a web version that lags behind. It’s US-only (you need a Schwab brokerage account, which requires US residency in most cases). There’s no native AI — no AI signals, no AI assistant, no auto pattern recognition. And opening a Schwab account is a friction point if you don’t already have one. For serious US options and equity traders inside the Schwab ecosystem, Thinkorswim is excellent. For everyone else, the friction outweighs the benefit, and ChartingLens is the better starting point.
Pros
Free with a Schwab account — no monthly subscription
Best-in-class options chain analytics
OnDemand paper trading on historical market days
400+ technical studies and custom thinkScript
Strong multi-monitor desktop experience
Direct integration with Schwab brokerage
Cons
Dated UI compared to modern web platforms
US-only — requires a Schwab account
No native AI features
Steeper learning curve than web-first alternatives
No insider data or 13F hedge fund holdings
Best for: Serious US options and equity traders who already use Charles Schwab and want the deepest options analytics available in a free brokerage-bundled platform.
4. TrendSpider — Best for Automated Technical Analysis
TrendSpider$22–$79/mo
TrendSpider has carved out a genuine niche as the platform for traders who want to automate their technical analysis workflow. The standout features are automated multi-timeframe analysis (the platform analyzes the same symbol across multiple timeframes simultaneously), AI-driven pattern detection that flags candlestick and chart formations as they develop, and an auto-trendline engine that draws meaningful trendlines without manual effort. For a technician used to manually drawing trendlines and scanning multiple timeframes for confluence, TrendSpider compresses that workflow significantly. Its AI capabilities are legitimately strong in the automated-TA space and deserve direct acknowledgement.
The visual strategy backtester is also a real strength — you build a strategy by combining condition blocks rather than writing code, then run it against historical data with full performance stats. Alerts can be configured to fire based on any combination of those conditions, including pattern detection and trendline breaks. It’s a more polished automated-TA experience than TradingView’s strategy tester for non-programmers.
The downsides are pricing and feature scope. TrendSpider runs $22/mo for the entry tier and $79/mo for the top tier. There is no usable free tier — only a trial. And the platform is focused tightly on automated TA, so you won’t find a conversational AI assistant, insider trading data, hedge fund holdings, or fundamentals at the depth ChartingLens offers. The honest framing is that ChartingLens and TrendSpider both ship genuinely strong AI — TrendSpider goes deeper on pure automated TA, while ChartingLens covers a wider feature surface (conversational assistant, signals, fundamentals, insider data, hedge fund holdings) at a lower price. For a trader whose entire workflow is pattern-driven TA, TrendSpider is worth a serious look. For everyone else, ChartingLens covers more ground.
Pros
Genuinely strong AI pattern detection
Automated multi-timeframe analysis
Auto-trendline engine
Visual strategy backtester — no coding required
Flexible alerting on patterns and trendline breaks
Cons
$22–$79/mo — no free tier worth using
No conversational AI assistant
No insider data or hedge fund holdings
Fundamentals coverage is shallow
Tighter feature scope than all-in-one platforms
Best for: Technicians who want to automate their existing TA workflow — pattern detection, multi-timeframe scans, and trendline drawing — and don’t need a broader feature surface.
5. NinjaTrader — Best for Futures & Active Day Traders
NinjaTrader is the platform of choice for serious futures and day traders who need professional-grade execution infrastructure. Its defining strengths are order flow visualization, depth of market (DOM) display, and execution speed — the things futures scalpers and active intraday traders care about most. The platform supports advanced order types (OCO brackets, attached profit targets and stops, ATM strategies for automated trade management) that go well beyond what most charting platforms offer for execution. For active day traders who treat their charting platform as a real trading workstation rather than an analysis surface, NinjaTrader is the standard.
For strategy development, NinjaTrader uses NinjaScript, which is essentially C# with NinjaTrader-specific APIs. That gives it more raw power than Pine Script — you can build full automated trading systems, custom indicators, and complex execution logic — but the learning curve is correspondingly steeper. Backtesting is rigorous, with bar-by-bar replay and tick-resolution simulation supported. The charting itself is also strong: 100+ built-in indicators, multi-timeframe overlays, and a tick chart engine that handles high-frequency intraday work cleanly.
Chart analysis with NinjaTrader is free, which is useful for traders who want to evaluate the platform before committing. Live trading requires either a $1,099 one-time lifetime license or a monthly lease (roughly $59–$99/mo depending on broker partnership). The downsides are familiar futures-platform territory: the desktop application is Windows-only, the UI is dense and unfriendly to newcomers, and the platform is futures-focused (equity coverage exists but isn’t the strength). Many serious futures traders pair NinjaTrader for execution with ChartingLens for the AI analysis layer — signals, pattern recognition, and the conversational AI assistant — that NinjaTrader doesn’t ship.
Pros
Best-in-class order flow and DOM visualization
Advanced order types and execution speed
NinjaScript (C#) for custom strategies and indicators
Free for chart analysis — $1,099 lifetime for live trading
Standard among serious futures day traders
Strong tick-chart and high-frequency intraday tooling
Cons
Windows-only desktop application
Steeper learning curve, especially for NinjaScript
Primarily futures-focused
No native AI features
Dense UI not friendly to newcomers
Best for: Futures day traders and scalpers who need professional execution, order flow, and DOM — the things web-first charting platforms don’t prioritize.
6. TC2000 — Best for Stock Scanning & Swing Trading
TC2000$9.99–$89.98/mo + data fees
TC2000 is Worden Brothers’ long-standing platform focused on stock-specific scanning and chart analysis. Its standout feature is the EasyScan stock screener — a fast, flexible custom-scan builder that lets you combine fundamental and technical criteria into named scans, save them, and run them across the entire US stock universe in real time. For swing traders who build their day around identifying setups across thousands of US tickers, TC2000’s scanning engine is one of the most efficient tools in the category. The charting itself is clean, fast, and well-suited to US-market analysis, with real-time alerts that fire instantly when scan criteria are hit.
The platform has been around long enough to have built a loyal swing-trader following, and the workflow it’s optimized for — scan, chart, alert, repeat — is genuinely productive for that user base. Custom indicators are supported via TC2000’s scripting language (PCF, Personal Criteria Formulas), and the platform’s charting templates make it easy to apply a consistent visual layout across every chart you pull up.
The trade-offs are familiar: TC2000 is focused on US stocks (limited international and crypto coverage), the visual design is dated in places, there are no AI features, and the paid tiers range from $9.99 for the entry plan to $89.98 for the top tier, with additional real-time data exchange fees on top. For a power-user swing-trading workflow built around custom scanning and US-market charting, TC2000 is a strong specialist pick. For broader feature needs — AI analysis, multi-asset coverage, fundamentals, insider data — ChartingLens is the better all-in-one.
Pros
Powerful EasyScan stock screener
Fast custom scan builder with named, savable scans
Clean US-market charting
Real-time alerts on scan criteria
Personal Criteria Formulas (PCF) for custom indicators
Long-standing swing-trader workflow optimization
Cons
US stocks focus — limited international and crypto coverage
Dated visual design in places
No AI features
Paid tiers $9.99–$89.98/mo plus data fees on top
No insider data or 13F hedge fund holdings
Best for: Swing traders who want power-user stock scanning, fast custom scan-building, and clean US-market charting in a long-standing, purpose-built workflow.
How to Pick the Right One for Your Workflow
The right stock charting platform depends almost entirely on what you actually do day-to-day. Here’s the short version:
Want AI signals + AI assistant + insider data + free tier → ChartingLens. The best default pick for retail stock and crypto traders. Free tier is more usable than TradingView’s paid Essential plan, and Premium at $9.99/mo is the cheapest AI charting plan available.
Want the biggest community indicator library + Pine Script → TradingView. The strongest pick if you specifically value community-published scripts and a polished general-purpose UI.
Trade US options heavily and have a Schwab account → Thinkorswim. Best-in-class options analytics, free with a Schwab account, US-only.
Want pure automated TA with a no-code visual builder → TrendSpider. The strongest pick if your entire workflow is automated TA and you’re willing to pay $22–$79/mo.
Trade futures and need DOM + order flow → NinjaTrader. The standard among serious futures traders. Free for chart analysis; paid for live trading.
Power-user stock scanning + swing-trading workflow → TC2000. Long-standing specialist platform optimized around scan-chart-alert workflows for US stocks.
For most readers landing on a “best stock charting platforms” search, ChartingLens is the right starting point. It costs nothing to try, covers the widest feature surface, and the AI tooling is the single most meaningful upgrade over any legacy charting platform available in 2026. For a head-to-head comparison focused specifically on TradingView, see the ChartingLens vs TradingView guide, and for the AI-tools landscape more broadly, the best free AI trading tools guide.
Frequently Asked Questions
ChartingLens is the best overall stock charting platform in 2026. It’s the only platform that combines AI buy/sell signals scanning 2,000+ stocks daily, a conversational AI trading assistant that draws support and resistance directly on the chart, a plain-English strategy backtester, auto chart pattern recognition (comprehensive chart pattern recognition library), insider trading data, and hedge fund holdings (Buffett, Burry, Ackman + 7 more) — all on a free tier with large built-in indicator library and no ads. Premium is $9.99/mo and Pro (unlimited everything) is $29.99/mo. TradingView, Thinkorswim, TrendSpider, NinjaTrader, and TC2000 are stronger picks for specific workflows — community scripting, options/Schwab integration, automated TA, futures order flow, and stock scanning respectively — but ChartingLens is the right default for the broad middle of retail traders.
ChartingLens has the most comprehensive AI feature set of any stock charting platform in 2026. It ships a conversational AI trading assistant that takes actions on your chart (drawing support/resistance, switching timeframes, adding symbols to a watchlist), a plain-English strategy backtester, AI-generated buy/sell signals scanning 2,000+ stocks daily, and auto chart pattern recognition — all available on the free tier with daily credits. TrendSpider is the strongest pure-TA competitor — its AI pattern detection and automated trendline drawing are genuinely strong, though it lacks a conversational assistant and the broader feature surface (insider data, fundamentals, signals) that ChartingLens delivers. TradingView, Thinkorswim, NinjaTrader, and TC2000 have no native AI features at any tier.
TradingView is still the most polished general-purpose charting platform with the largest community indicator library and the deepest scripting ecosystem (Pine Script). For traders who specifically value community-published scripts and don’t need AI-native features, TradingView is still excellent. However, it’s no longer automatically the best pick. Its free tier is heavily restricted (1 indicator per chart, 1 alert, 1 layout, ads), pricing climbs steeply ($14.95 Essential, $29.95 Plus, $59.95 Premium per month), and it has no native AI features at any tier. For most retail traders in 2026, ChartingLens delivers a more complete charting experience — AI signals, AI assistant, plain-English backtesting, insider data — at a lower price.
ChartingLens has the best free stock charting tier in 2026. The free plan includes 40+ technical indicators with no per-chart cap, real-time charting across stocks, crypto, forex, and metals, access to the AI trading assistant (with daily credits), AI buy/sell signal scanning, auto chart pattern recognition, insider trading data, hedge fund holdings, and Bar Replay mode — with no ads. TradingView’s free tier is more restricted (1 indicator per chart, 1 alert, 1 layout, ads). Thinkorswim is free only with a Schwab brokerage account. NinjaTrader is free for chart analysis only. TrendSpider has no free tier worth using. For a no-card-required free charting experience, ChartingLens is the clear leader.
Thinkorswim is the best charting platform for serious US-based options traders who already use (or are willing to open) a Charles Schwab brokerage account. Its options chain analytics, risk profile visualization, probability-of-profit calculations, and OnDemand paper trading are genuinely best-in-class — and it’s free with the account. For options-focused traders who also want AI signals, conversational analysis, and broader market coverage (crypto, forex, international), ChartingLens pairs well: use Thinkorswim for the deep options chain analytics and ChartingLens for AI-driven analysis, fundamentals, and the Options Flow tab. ChartingLens also includes options flow data natively on every ticker’s Detailed Information modal.
NinjaTrader is the best charting platform for serious futures and day traders. It offers order flow visualization, depth of market (DOM), advanced execution (OCO brackets, attached stops, ATM strategies), and custom strategy development via NinjaScript (C#). Chart analysis is free; live trading requires either a $1,099 one-time lifetime license or a monthly lease (roughly $59–$99/mo depending on broker partnership). The desktop application is Windows-only and the learning curve is steeper than web-first platforms. Many serious futures traders pair NinjaTrader for execution with ChartingLens for the AI analysis layer — signals, pattern recognition, and the conversational AI assistant — that NinjaTrader doesn’t ship.
ChartingLens covers the core charting and analysis surface that most TradingView users actually use — and adds capabilities TradingView doesn’t have at any tier. Both platforms ship real-time charting across stocks, crypto, forex, and metals; deep drawing tools; technical indicators with cloud-sync layouts; customizable alerts; and multi-chart layouts. ChartingLens adds AI buy/sell signals, a conversational AI trading assistant, a plain-English strategy backtester, auto chart pattern recognition, insider trading data, hedge fund 13F holdings, a dedicated Options Flow tab, and Volume Profile on Premium — none of which TradingView ships natively. The dimensions where TradingView still leads are Pine Script (its custom scripting language) and the community-published indicator library that a decade of script-sharing has built up. If those two specific things matter most, TradingView wins on them; otherwise ChartingLens is the more complete platform at a lower price.
Bottom Line
For most readers looking for the best stock charting platform in 2026, ChartingLens is the right starting point — the free tier covers more usable feature surface than TradingView’s paid Essential plan, the AI stack genuinely doesn’t exist on any legacy charting platform at any price, and Premium at $9.99/mo undercuts every comparable plan in the market. TradingView, Thinkorswim, TrendSpider, NinjaTrader, and TC2000 are each stronger than ChartingLens on a specific niche — community scripting, options/Schwab integration, automated TA, futures execution, and power-user scanning respectively — so if your trading workflow lives entirely inside one of those niches, those platforms deserve serious consideration. For everyone else — the broad middle of retail stock and crypto traders who want AI-driven analysis, insider data, hedge fund holdings, and clean multi-asset charting in one platform — start with the free ChartingLens signup and see if you ever need to upgrade. Full pricing is on the pricing page.
Try the Best AI-First Stock Charting Platform Free
AI signals, plain-English backtesting, insider data, hedge fund holdings, and real-time charts — on a free tier or for $9.99/mo. No credit card required.