Why People Follow Politician Trades
On July 24, 2026, a disclosure landed showing Bloom Energy call options bought in the $1 million to $5 million range, plus Intel calls in two more tranches, all filed under Nancy Pelosi's name. The trades were her husband's, they were three-plus weeks old by the time anyone could read them, and the filing does not say what the options cost. And still, within a day, the tickers were everywhere.
That is the whole appeal in one filing. Members of Congress sit on committees that write the rules for the companies they own. Their trades are public by law. And a handful of them trade a lot. So a small industry has grown up around reading those filings faster and better than the next person, and a few funds have even been launched to copy them outright.
I have followed this data for a while, and my honest take is that it is more useful than the skeptics say and less useful than the influencers say. The trick is knowing what a disclosure can and cannot tell you before you act on it. This guide covers where the data comes from, how to read it without fooling yourself, who is worth watching, and how the politician tracking inside ChartingLens puts it next to the chart so you can actually do something with it.
Where the Data Actually Comes From
Every politician-tracking site, free or paid, is reading the same two government sources. There is no secret feed.
The STOCK Act. Since 2012, members of Congress (and their spouses and dependent children) must report any securities transaction over $1,000 on a Periodic Transaction Report, or PTR. The deadline is 30 days from when the member becomes aware of the trade, and never more than 45 days from the trade itself. Late filers pay a $200 fee, which is why you will see so many filings land right on the deadline.
The House. The Clerk of the House publishes every filing through its financial disclosure site. Electronically filed PTRs are text PDFs with a clean table: owner, asset, transaction type, date, notification date, and amount. Some members still file on paper, and those are scanned images that have to be read by hand or by OCR.
The Senate. Senators file through the Senate's eFD system. Electronic reports are plain HTML tables with the same columns, plus a ticker field the House form does not always have. Paper filings, again, are scans.
This matters for one practical reason: the data is public domain. Anyone can parse it. What differs between tools is how carefully the parsing is done (wrapped rows, amended filings, name matching) and what gets built on top. ChartingLens reads both sources every day straight from the filings; as of this writing that is more than 16,000 disclosed trades from over 190 members going back to the start of 2024.
How to Read a Disclosure (Ranges, Spouses, Amendments)
Three things trip people up constantly.
Amounts are ranges, not numbers. A trade is disclosed as $1,001 to $15,000, or $15,001 to $50,000, and so on up to "over $50,000,000". Nobody knows whether a "$500,001 to $1,000,000" purchase was closer to the bottom or the top. When a tracker shows you a politician's "portfolio value" or a "dollar-weighted return", it is making up the weights. Treat the range as a rough size signal and nothing more.
Owner matters. The owner column says whether the trade was in the member's own account, a spouse's (SP), a joint account (JT), or a dependent child's (DC). Pelosi's headline trades are all SP. Tuberville's are mostly his own. A spouse who runs a venture fund trades very differently from a senator moving money between index ETFs, and you should read the two differently.
The lag is real, and amendments happen. By the time you see a trade it can be six weeks old. Members also amend filings, sometimes months later, to fix a ticker or a date; a good tracker replaces the original with the amendment instead of showing both. So when you look at a "recent trades" feed, remember it is a feed of recent disclosures. The trade itself may have already played out.
One more subtle one: House filings describe the asset in words ("Apple Inc. - Common Stock (AAPL) [ST]") and the ticker lives inside that description. Options show the strike and expiry in a note. Bonds, private funds and LLC interests show up too, which is why you will sometimes see an entry like "REOF XXV, LLC" with no ticker at all.
The Politicians People Actually Follow
Trade count and fame are not the same thing. Here is who shows up most on politician-tracking sites, and what their disclosures actually look like in our data.
| Member | Seat | What the filings look like |
|---|---|---|
| Nancy Pelosi | Rep. (D-CA) | Fewer, larger trades, all made by spouse Paul Pelosi. Heavy on tech and call options: Bloom Energy and Intel calls in 2026, plus Uber and NVIDIA. The single most watched filer in Congress. |
| Tommy Tuberville | Sen. (R-AL) | Hundreds of trades since 2024, mostly his own account, a mix of individual stocks and sector ETFs. High volume, small-to-mid ranges. A favorite of copy-trading accounts because there is always something new. |
| Josh Gottheimer | Rep. (D-NJ) | One of the most active filers in the House, mostly joint-account trades in $1,001 to $15,000 ranges across large caps and ETFs. Volume over conviction. |
| Dan Crenshaw | Rep. (R-TX) | Infrequent, but the trades get attention because of his committee work. Recent filings are mostly sales of big tech. |
| Marjorie Taylor Greene | Rep. (R-GA) | A very active buyer in 2025 and 2026, hundreds of disclosed purchases across tech, energy and consumer names, typically in the smallest range. |
| Rick Scott | Sen. (R-FL) | Large personal fortune, so the ranges skew big. Fewer filings, more notable when they arrive. |
| Ro Khanna, Markwayne Mullin, Shri Thanedar, Kevin Hern | Mixed | Frequently cited on tracking sites; Khanna's trades are largely family accounts, Hern and Thanedar file steadily in mid ranges. |
A quiet lesson from the numbers: the busiest filers are not the famous ones. Members like Jefferson Shreve, Rob Bresnahan, Julie Johnson and Lisa McClain each have hundreds of disclosures on file, and almost nobody talks about them. If you only follow the names you know from the news, you are looking at a small, unrepresentative slice of the data.
Tracking Politician Trades in ChartingLens
ChartingLens is a well-established charting platform with a large active user base, and its smart-money tools have always lived in one place: the Hedge Fund Holdings panel, next to the insider trading data and the 13F portfolios of Buffett, Burry, Ackman and the rest. Politician trades now sit in that same panel as a Politicians tab, so you are not switching between a chart app and a separate tracking site.
Open the panel from the sidebar and you land on the Politicians tab by default. Each tracked member gets a card with their photo, seat, how many trades they have on file, when they last filed, and their most recent trades: ticker, BUY / SELL / PARTIAL SELL badge, a Spouse or Joint tag where it applies, the disclosed range, and the trade date. Click any ticker and the chart loads it. A picker lets you search all 190+ members by name or state; the most-followed names are flagged Popular and a handful of them are tracked for you out of the box.
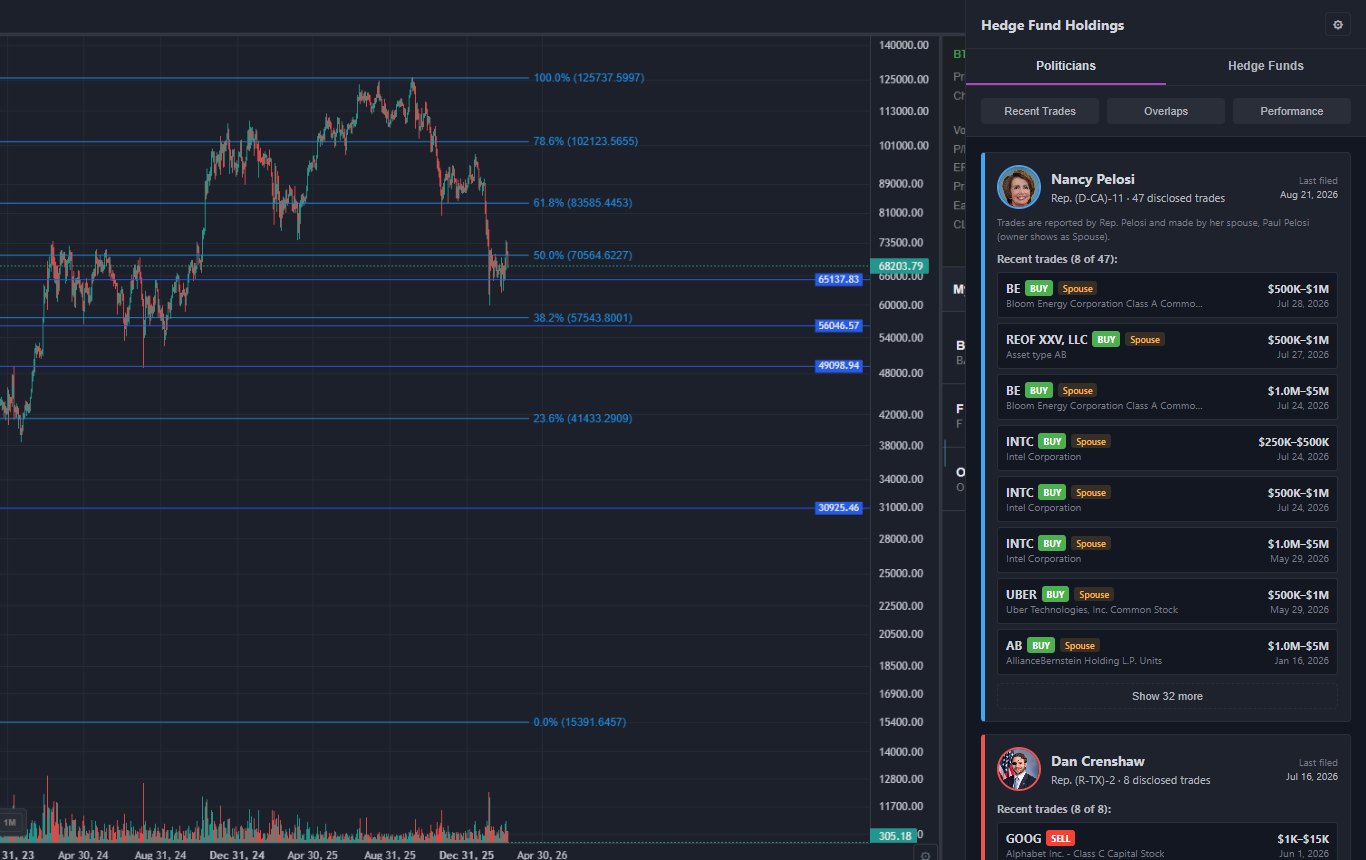
The Politicians tab in ChartingLens, August 25, 2026. Pelosi's card carries a note that the trades are her spouse's.
Above the cards are the same three views the hedge fund side has:
Recent Trades merges everything your tracked politicians disclosed in the last 45 days into one feed, newest first, grouped by day, with the politician's name on each row. This is the "what happened this week" view.
Overlaps finds stocks that two or more of your tracked politicians traded in the last 12 months and tells you which way each of them went. A ticker with three buyers and no sellers is a different story from one where half the group is selling into the other half's buying, and the NET BUYING / NET SELLING badge makes that obvious at a glance.
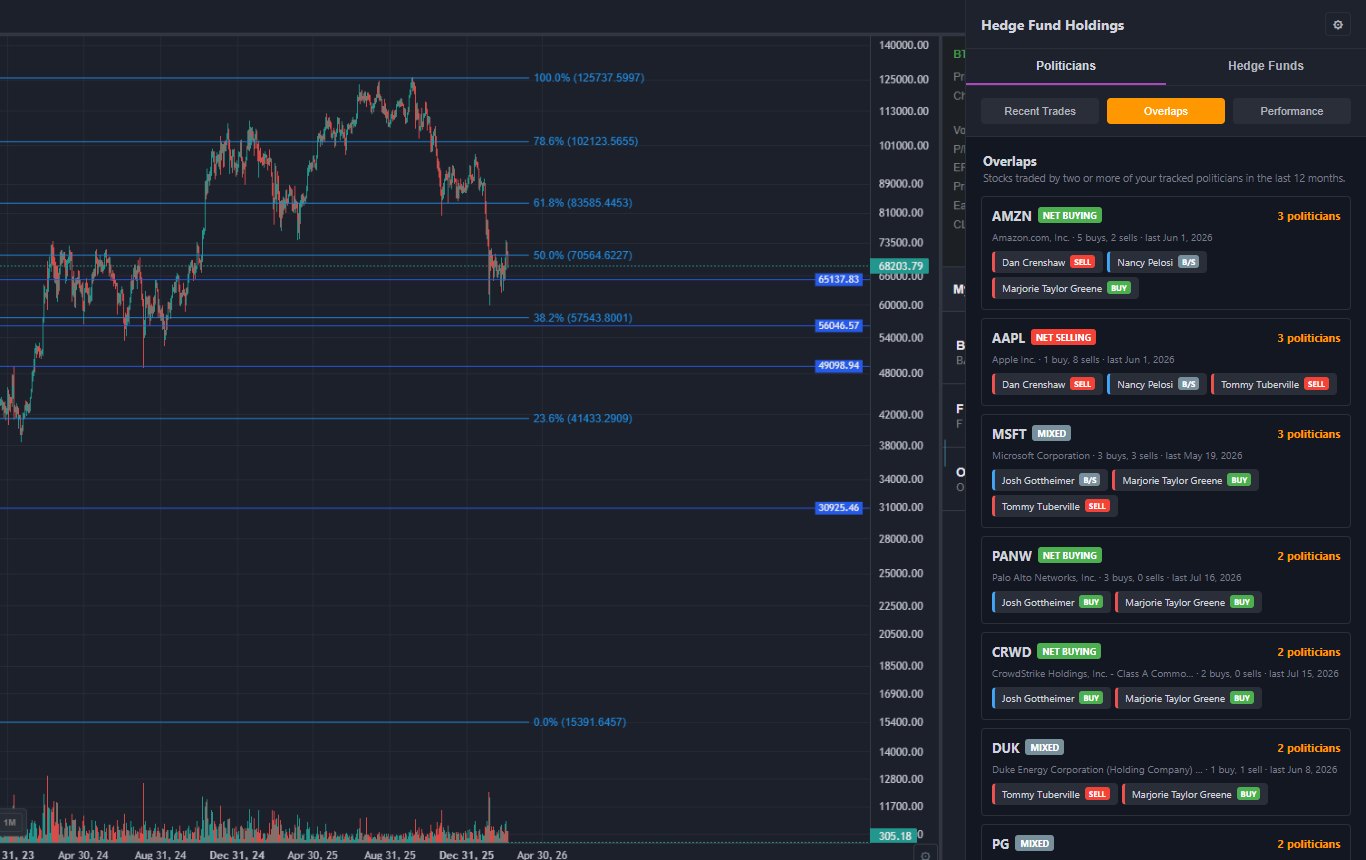
Overlaps view, August 25, 2026: AMZN, AAPL and MSFT each traded by three tracked members in the last year.
Performance is the part I find most useful, mainly because it deflates the hype. For each politician it takes their disclosed buys from the last 12 months, looks up the closing price on the trade date, and shows the average return since, the win rate, the best and worst trade, and the S&P 500 over the same windows. It is equal-weighted per stock (we do not pretend to know position sizes from a range), and it is an estimate, but it answers the question everybody asks: is this person actually ahead of an index fund? On the day I took the screenshot below, Pelosi's last-12-months buys were up about 3% on average while the S&P over the same windows was up about 8%. Gottheimer was roughly level with the index. Draw your own conclusions.
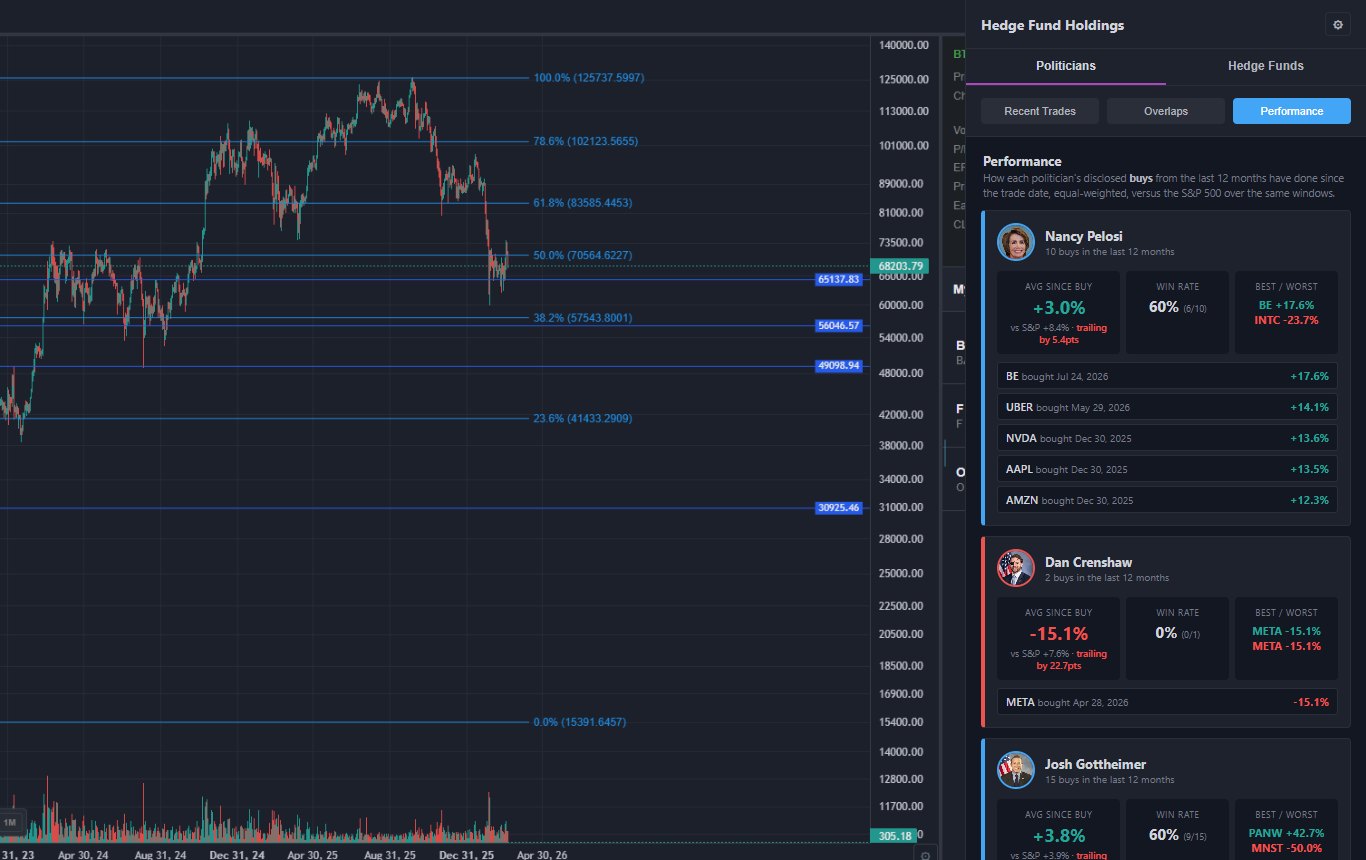
Performance view, August 25, 2026. Returns are equal-weighted per stock from daily closes on the disclosed trade date.
Two design decisions worth knowing about. First, the data is parsed directly from the House and Senate filings rather than licensed from a data vendor, which is why it can be part of the normal Premium plan instead of a separate subscription. Second, the same panel holds the insider trading tracker with its confidence scores and the 13F portfolios, so a politician's buy can be checked against what the company's own executives and the big funds are doing in about ten seconds.
A Workflow That Doesn't Just Copy Trades
Copying a six-week-old trade blindly is how people lose money on this data. Here is how I actually use it.
Start with overlaps, not names. One politician buying a stock is noise. Three of them buying it in the same quarter, with nobody selling, is a reason to look. Open Overlaps, sort by the count, and skip anything that is just index ETFs being rebalanced.
Check who else is buying. Flip to the insider tab. If executives are buying with their own money in the same window, the politician's trade is corroborated by people with far better information. If insiders are selling into it, be careful. Then check the 13F side for whether any of the tracked funds hold it. Our guide on tracking insider trading and following hedge fund managers goes deeper on reading those two.
Then look at the chart, because the trade is old. The stock has had up to 45 days to move. Pull it up, see where it sits relative to the level the politician likely bought at, and decide whether the setup still exists. If it has already run, an alert at a pullback level beats chasing.
Use Performance to decide whose filings deserve your attention. Some members have a genuinely good record over the last year; more have a mediocre one. Track the ones with a track record, not the ones with a podcast.
Add the ones you like to a watchlist. A click on any ticker loads the chart, and the star adds it to a watchlist that then powers price and insider notifications for that symbol. The politician disclosure was the discovery step; the watchlist is where the actual monitoring happens.
Other Places to Get the Data
You do not need any tool to see these filings. The House Clerk's financial disclosure search and the Senate eFD search are free and complete; they are just slow, since you are reading one PDF or one report at a time and doing the ticker lookups yourself.
Among aggregators, Capitol Trades has a clean free web view of recent disclosures. Quiver Quantitative goes deepest, with a paid API and computed excess returns, and its data feeds several "follow Congress" ETFs. Unusual Whales pairs congress trades with its options-flow product and publishes a well-known yearly report. All three are reading the same public filings described above. The differences are in presentation, in how quickly they process a filing, and in what they let you do next.
Where ChartingLens fits: it is the option built for people who want the disclosures next to a professional chart, insider data and hedge fund holdings in one workspace, with an AI assistant, an institutional-grade plain-English strategy builder and backtesting engine, and a large built-in indicator library, rather than a standalone tracking site. It works with any brokerage, since it is an analysis platform rather than a broker, and it covers stocks, crypto, forex and metals in the same interface. If you only want a feed of Pelosi's trades, a free tracker is enough. If you want to act on the data, the integrated version saves a lot of tab switching.
Frequently Asked Questions
Final Thoughts
Politician trade disclosures are a genuinely public, genuinely interesting dataset with two big caveats stamped on every row: the amount is a range and the trade is old. Read them that way and they are a useful discovery tool, especially when several members converge on the same name and the company's own insiders agree. Read them as a copy-trading feed and you will mostly be buying the top of a move that a spouse's venture fund entered six weeks earlier.
If you want the data in a place where you can actually check it against a chart, insider activity and the big funds' 13F portfolios, the Politicians tab in ChartingLens does that in one panel, updated daily from the official filings, with the performance numbers that tell you which filers are worth your attention.
Related Articles
Nancy Pelosi Stock Trades: How to Track Every Disclosure
Read article → Smart MoneyTrump Stock Trades: How to Track the President's Disclosures
Read article → Smart MoneyHow to Track Insider Trading & Follow Hedge Fund Managers
Read article → WatchlistHow to Build a Stock Watchlist
Read article → ToolsBest Free Stock Screener, Watchlist & Alert Apps
Read article →Follow Congress Next to the Chart
Politician trades, insider buying with confidence scores, and 18 hedge fund portfolios in one panel, beside professional charts and an AI assistant. Free plan available.
Try ChartingLens Free