I check charts on my phone more than on my desktop now. Not because I want to. Because the phone is what is in my hand when a stock I am watching starts moving at 11:40 on a Tuesday. So the question that matters is not "which app has the most features" but "which app lets me actually do the analysis on a six-inch screen".
I tested seven apps on the same three tasks: draw a trend line and a Fibonacci retracement with a finger, stack three indicators without the chart turning to mush, and set an alert that reaches me when the app is closed. Most apps nail one of those. Very few nail all three. If you are new to reading charts at all, start with how to read stock charts first, then come back.
What Makes a Stock Chart App Good on a Phone
Desktop charting habits do not survive the trip to a phone intact. These are the five things that separated the good apps from the frustrating ones:
- Touch drawing that does not fight you. Placing two anchor points of a trend line with a thumb should be precise. Half the apps here make you zoom in and try three times.
- Indicators that stay readable. Moving averages on price, RSI or MACD in its own pane, and labels you can still read. The RSI, MACD and Bollinger Bands guide covers the three most people add first.
- Alerts that arrive when the app is closed. Real push notifications, not a banner you only see if you happen to open the app.
- Every market in one place. Stocks, ETFs, crypto and forex without juggling three apps.
- No brokerage account required. A chart app should not need your Social Security number before it shows you a candle.
The 7 Best Stock Chart Apps for iPhone at a Glance
| App | Best for | Price | Broker account needed? |
|---|---|---|---|
| ChartingLens | All-in-one charts, drawing, alerts and AI | Free, Premium $14.99/mo | No |
| TradingView | Pine Script and community ideas | Free, paid $14.95 to $69.95/mo | No |
| thinkorswim | Free pro charts for Schwab clients | Free with Schwab | Yes |
| Webull | Free charts plus trading | Free | For trading |
| TC2000 | TC2000 desktop users | $9.99 to $59.99/mo | No |
| moomoo | Free charts and market data | Free | For trading |
| IBKR Mobile | Interactive Brokers clients | Free with IBKR | Yes |
The Best Stock Chart Apps for iPhone, Ranked
1ChartingLens: Best Stock Chart App for iPhone Overall
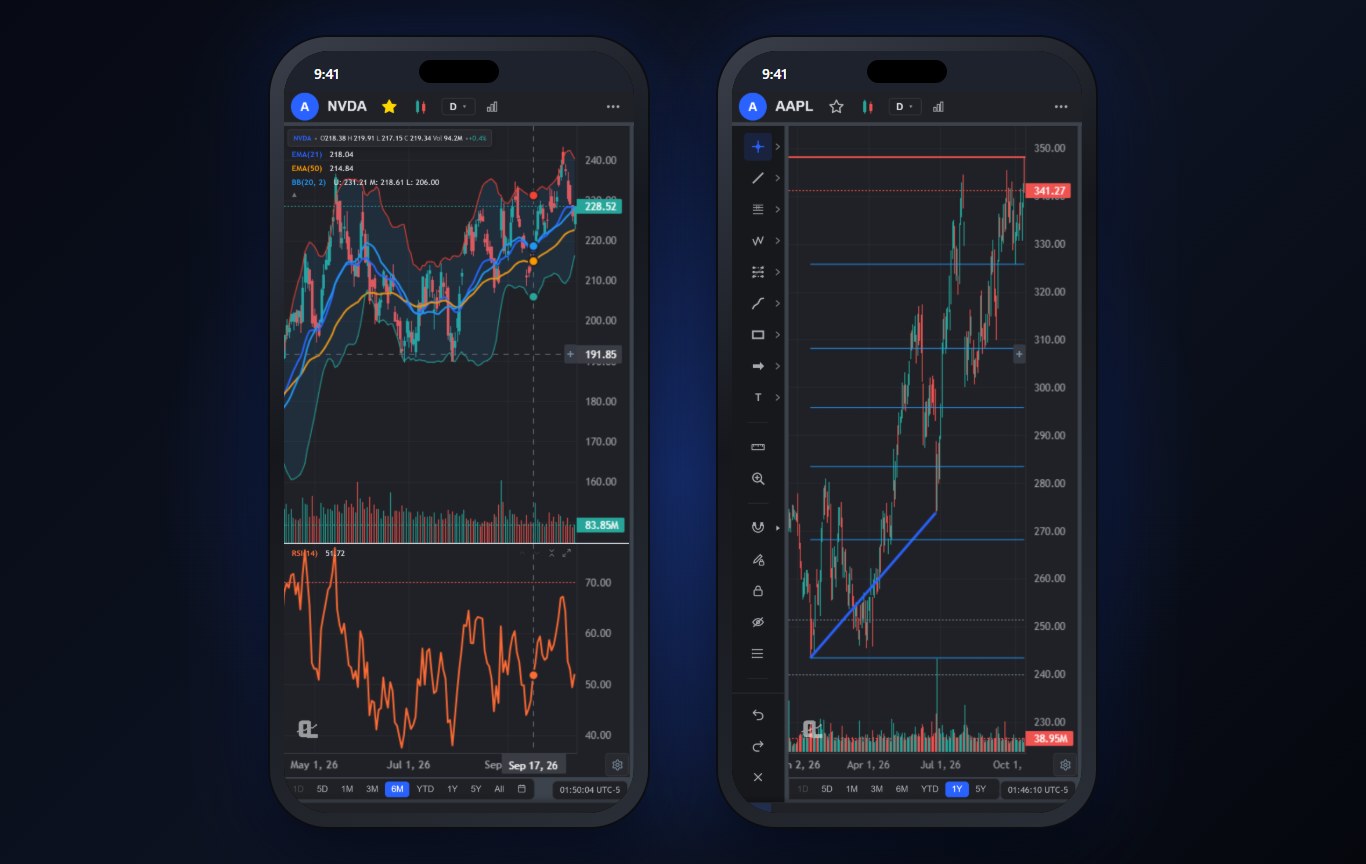
This is the one I ended up keeping on my home screen. Drawing is the first thing you notice: the full drawing toolkit from the desktop, trend lines, Fibonacci, rectangles, long and short positions, all placed with a tap or a drag, with a floating edit bar for color and line width. The chart in the screenshot above took about forty seconds to mark up.
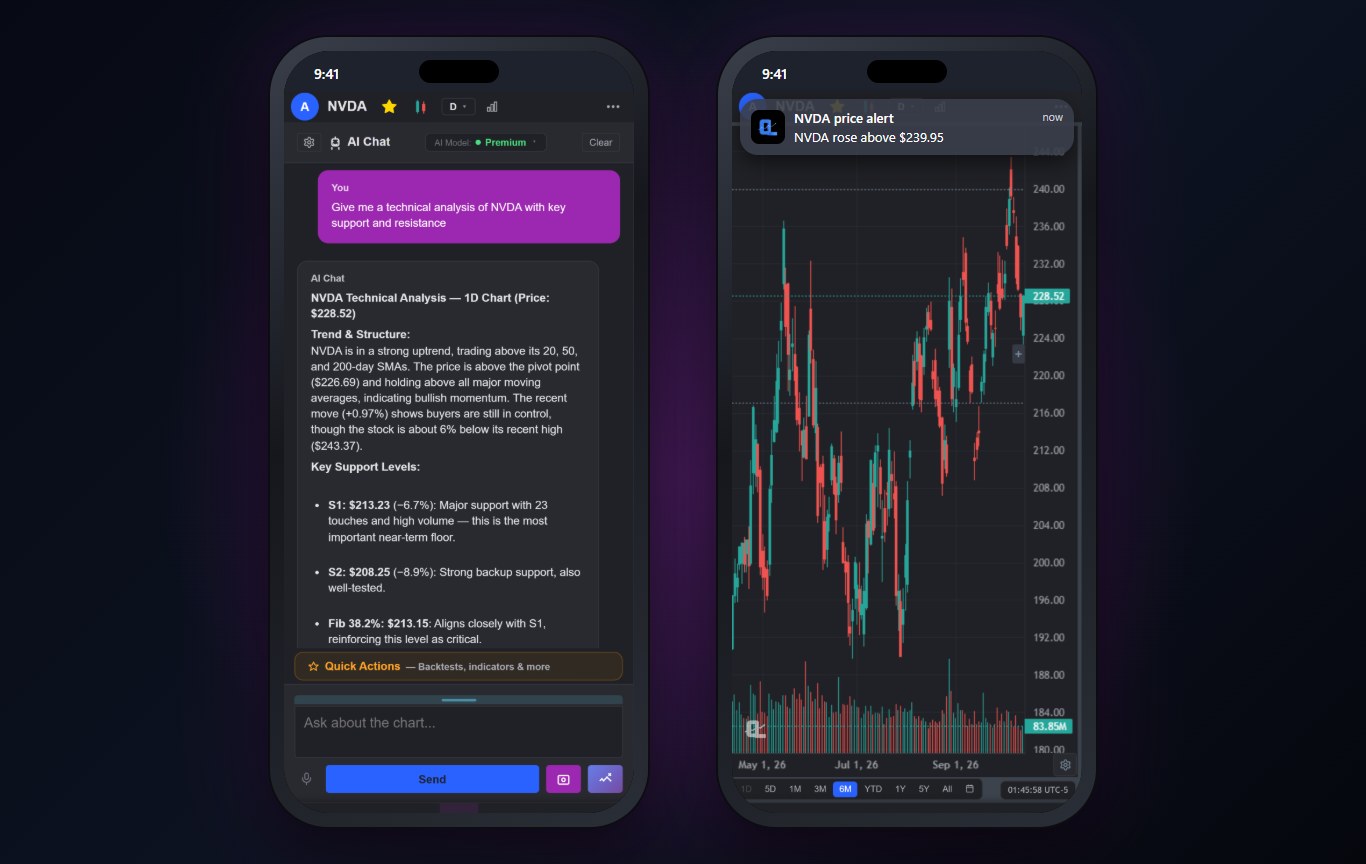
Indicators come from a large built-in indicator library, and you can paste a Pine Script or thinkScript indicator and run it on your chart (Premium). Multi-chart layouts you set up on desktop open on the phone one chart at a time, and a tap on the C1, C2 label switches between them. Then there is the AI assistant: ask it about the chart in plain English and it answers with the trend, support and resistance and the levels it would watch, read from the actual chart.
Premium and Pro alerts are checked on ChartingLens servers every five minutes and arrive as push notifications even when the app is closed. Face ID can lock the app. Free covers every market, 3 indicators per chart and 3 price alerts; Premium adds unlimited indicators, multi-chart layouts of up to 10 charts, Bar Replay, extended hours and 20 AI credits a day.
Best fit: anyone who wants desktop-grade charting and analysis on their iPhone, whatever broker they use.
2TradingView: Best for Pine Script and Community Ideas
TradingView's app is polished and the chart engine is excellent. Where it really wins is the ecosystem: a huge public script library and a constant stream of published trade ideas.
The free plan is tight, though. Indicators per chart and alerts are capped hard, and the price increase in April 2026 made the useful tiers more expensive. Drawing on a phone works but feels like the desktop squeezed down rather than designed for a thumb.
Best fit: traders already deep in Pine Script who want the same scripts on their phone.
3thinkorswim: Best Free Charts for Schwab Clients
If you have a Schwab account, thinkorswim mobile gives you a serious set of studies and drawings for free, and you can trade straight from the chart.
The catch is the account. No Schwab account, no app worth using. And the interface carries decades of desktop habits, which makes it powerful and a little cramped on a phone.
Best fit: Schwab clients who want charts and execution in one app.
4Webull: Best Free Chart App That Is Also a Broker
Webull's charts are better than they have any right to be in a free broker app: a decent indicator set, landscape mode and quick timeframe switching.
It is a broker first, so the app keeps steering you toward trading. Drawing tools are basic next to a dedicated chart app, and there is no scripting.
Best fit: beginners who want free charts and a place to place trades.
5TC2000: Best Companion for TC2000 Desktop Users
If you already run TC2000 on desktop, the mobile app keeps your watchlists, drawings and alerts in sync, which is exactly what it is for.
On its own it is less compelling. The value is the desktop platform and its scanning, and you pay for that whether you use the phone or not.
Best fit: existing TC2000 users.
6moomoo: Best Free Charts Plus Market Data
moomoo packs in a lot of free data around the chart: fundamentals, institutional ownership and news, plus capable charts.
The app is busy. Finding the chart you want under all the data tabs takes a while, and like Webull it exists to get you trading.
Best fit: investors who want data around the chart more than drawing tools.
7IBKR Mobile: Best for Interactive Brokers Clients
Interactive Brokers' mobile app gives clients reliable charts with the usual indicators, next to the best order routing in the business.
Charting is functional rather than enjoyable. Most IBKR traders I know do their analysis elsewhere and use IBKR to execute.
Best fit: IBKR clients who want quick chart checks next to their orders.
How to Choose the Right Chart App for You
Ask yourself one question first: do you want your charts and your broker in the same app? If yes, and you already have the account, thinkorswim, Webull, moomoo and IBKR Mobile are all fine. You give up drawing depth and AI in exchange for trading from the chart.
If you want the best analysis on your phone, pick a dedicated chart app and keep your broker separate. That is the setup most active traders end up with anyway, and it means you can switch brokers without losing a single drawing. Between the two dedicated options, ChartingLens wins on touch drawing, alerts and the AI assistant, and TradingView wins if your workflow depends on community scripts. The TradingView alternatives comparison and the ChartingLens vs TradingView breakdown go deeper on that choice.
5 Tips for Charting on a Phone
- Use landscape for drawing. Turn the phone sideways and the chart gets the whole screen, which makes anchor points far easier to place.
- Keep it to three indicators. More than that and the phone chart becomes noise. One trend tool, one momentum tool, volume.
- Draw the levels once, on desktop or phone. Good apps sync drawings, so mark your support and resistance levels wherever is convenient.
- Let alerts do the watching. Put an alert on every level you drew and close the app.
- Check the daily before the 5-minute. A phone makes it tempting to stare at tiny timeframes. The daily chart tells you which way to lean.
Why We Built This Into ChartingLens
A phone chart app has to earn its place on the home screen, and that is how we approached ChartingLens on iPhone: the same charts, drawings, alerts and AI as the desktop, rebuilt for a thumb instead of a mouse.
ChartingLens is a well-established platform with a large active user base, advanced features, and an institutional-grade strategy builder and backtesting engine. Describe a strategy in plain English and the institutional-grade backtesting engine tests it on years of history, with the trades marked on the chart. It is broker-agnostic, so it works with any brokerage and you keep the broker you already trust. The large built-in indicator library, the multi-asset coverage (stocks, ETFs, crypto, forex, metals and indices across US and international exchanges) and a mature AI-first feature ecosystem are the same on the phone as on the desktop. It is battle-tested at scale: the charts, alerts and AI run day to day for a large trader community spanning day traders, swing traders, crypto traders and long-term investors, and a lot of what ships comes straight from that community's feedback.
If you are new to any of it, the extensive documentation and learning resources help: the free Learn courses draw every example on a real chart, and the how to use ChartingLens guide walks through every panel.
The Bottom Line
For most traders the best stock chart app for iPhone is ChartingLens: it is the only one that gives you desktop-grade drawing, a large built-in indicator library, push alerts and an AI assistant together without a broker account. TradingView is the pick for Pine Script loyalists, and thinkorswim is the best free choice if you already have Schwab. Whatever you choose, keep the analysis app separate from the broker if you can. It makes everything else easier. For the free options in more depth, see the best free stock charting software.
Related Articles
Best Charting Software for Day Trading
The desktop side of the same question, ranked for intraday work.
Read article → Free ToolsBest Free Stock Charting Software
What you really get for $0 on each charting platform.
Read article → AlternativesBest TradingView Alternatives
Every serious TradingView replacement compared side by side.
Read article →Get Desktop-Grade Charts on Your Phone
Charts, drawing tools, a large built-in indicator library, push alerts and an AI assistant, free to start.
Start Charting Free →