1. What an Inverted Yield Curve Means
Normally, lending money for 10 years pays more than lending it for 2 years. You're tying money up longer, so you want a better rate. Plot yields from short to long and the line slopes up. That's a normal yield curve.
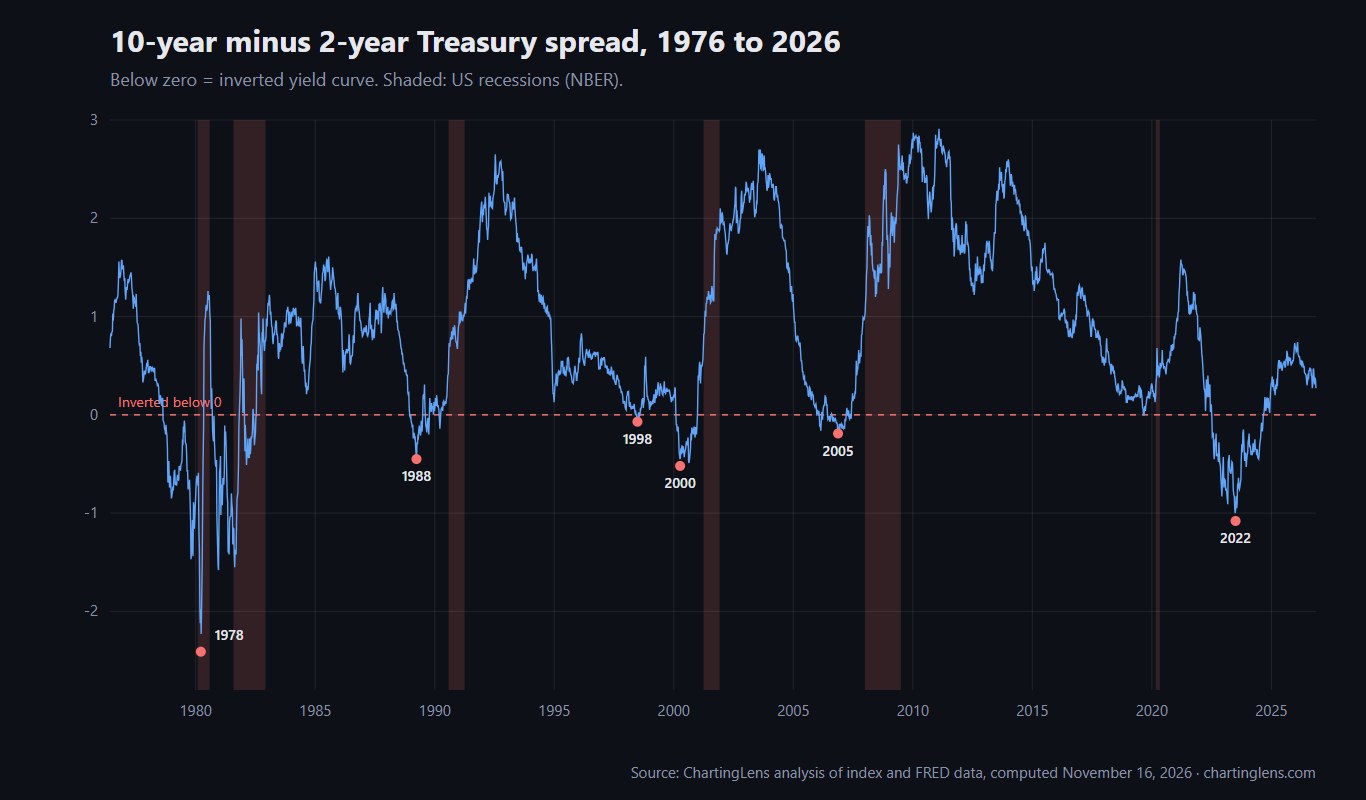
Sometimes short yields climb above long ones and the curve "inverts". It usually happens when the Fed has pushed short-term rates up to fight inflation while bond buyers expect the economy to slow and rates to come back down. Long yields stay lower because the market is betting on cuts. An inversion is the bond market saying it thinks the Fed has gone too far.
There are several versions. Wall Street watches the 10-year minus 2-year spread. The Fed's own research prefers the 10-year minus 3-month. We measured both.
2. Every Inversion Since 1976
We counted a 10y-2y episode as any stretch with at least five inverted closes, where the gaps between inverted closes were less than a year.
| Inverted | Inverted days | Deepest | First recession month | Lead | S&P from inversion to market peak |
|---|---|---|---|---|---|
| Aug 1978 to Jul 1982 | 823 | -2.41 (Mar 1980) | Feb 1980 (and Aug 1981) | 17 months | +10.0% (Jan 1980) |
| Dec 1988 to Mar 1990 | 190 | -0.45 (Mar 1989) | Aug 1990 | 20 months | +33.5% (Jul 1990) |
| May 1998 to Jul 1998 | 27 | -0.07 (Jun 1998) | Apr 2001 | 34 months | +39.6% (Mar 2000) |
| Feb 2000 to Dec 2000 | 227 | -0.52 (Apr 2000) | Apr 2001 | 14 months | +8.4% (Mar 2000) |
| Dec 2005 to Jun 2007 | 238 | -0.19 (Nov 2006) | Jan 2008 | 24 months | +24.6% (Oct 2007) |
| Apr 2022 to Sep 2024 | 541 | -1.08 (Jul 2023) | None as of Nov 2026 | n/a | +72.0% so far (Oct 2026) |
Two caveats on the list. The 1998 episode was tiny (27 days, never deeper than -0.07) and came nearly three years before the 2001 recession, so it's a stretch to call it a warning. And the 10y-2y curve dipped below zero for only a few days in August 2019, too briefly to count here. The 10y-3m curve caught 2019 clearly, inverting from March 2019 to March 2020, 11 months before the COVID recession.
3. How We Calculated It
Method
- Spreads
- FRED T10Y2Y (10-year minus 2-year constant maturity, daily from June 1, 1976) and T10Y3M (10-year minus 3-month, daily from January 4, 1982), through November 13, 2026.
- Episodes
- At least five inverted closes. A new episode starts after 250 or more trading days without an inverted close.
- Recessions
- NBER monthly dates via FRED USREC. "Lead" runs from the first inverted close to the first recession month, counting only recessions within 36 months.
- Stocks
- S&P 500 daily price closes, dividends excluded. "To market peak" is the highest close between the first inverted close and the recession.
- Computed
- November 16, 2026 by ChartingLens. Raw table (both spreads): yield-curve-inversions-1976-2026.csv.
4. How Long From Inversion to Recession?
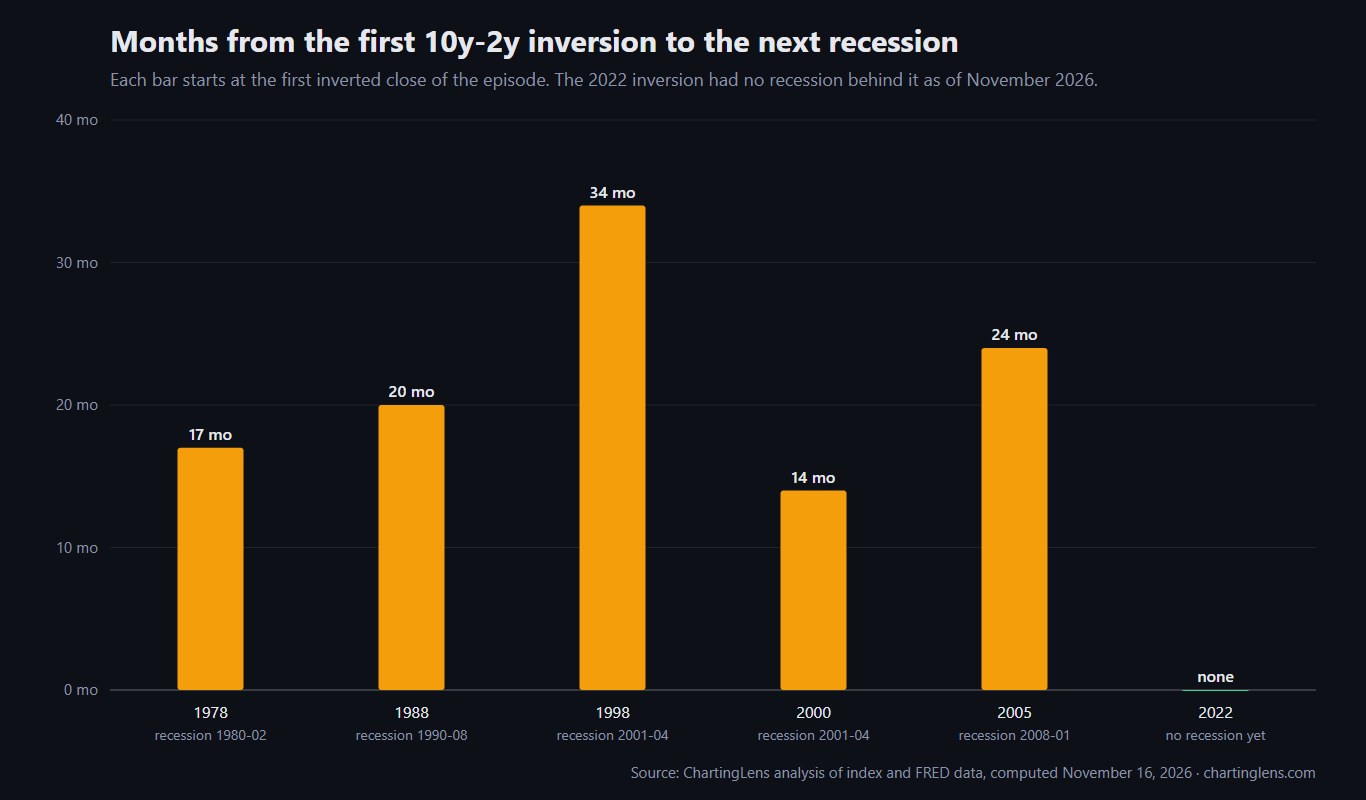
Leaving out 1998, the lead times are 17, 20, 14 and 24 months: an average of about a year and a half. That's long. Long enough that an inversion is close to useless for timing a stock sale, and long enough that by the time the recession arrives most people have stopped talking about the curve.
The 10y-3m spread gave similar leads: 16 months in 1989, 12 in 2000, 23 in 2006 and 11 in 2019.
5. The Un-Inversion Is the Part to Watch
Here's the pattern I found most useful. The recession didn't start while the curve was inverted. It started after the curve went positive again:
- 1990: the curve turned positive in March 1990. Recession from August, about 4 months later.
- 2001: positive again at the end of December 2000. Recession from April 2001, about 3 months later.
- 2007: positive again in June 2007. Recession from January 2008, about 7 months later.
The reason is the Fed. The curve un-inverts because the Fed starts cutting short rates, and the Fed cuts because it sees trouble. That's why our study of stocks after the first rate cut found the worst outcomes in 2001 and 2007. The 2022 inversion ended on September 5, 2024, right as the Fed began cutting. By the old pattern a recession should have started by mid-2025. It hasn't, 26 months on.
Key takeaway
- An inversion has been an early warning. A re-steepening driven by Fed cuts has been the late one. Neither has been a precise timer.
6. What Stocks Did After Inversions
If you sold stocks the day the curve inverted, you usually sold too early. From the first inverted close to the market's peak before the recession, the S&P 500 gained:
- +33.5% after December 1988, peaking in July 1990.
- +24.6% after December 2005, peaking in October 2007.
- +10.0% after August 1978 and +8.4% after February 2000.
The year after the first inversion was positive in four of the six episodes, including +27.3% after December 1988. The exceptions are 2000 (-2.5%) and 2022 (-9.8% in the year from April 1, 2022, a year of rate hikes). Stocks tend to peak somewhere between the inversion and the recession, which is too wide a window to trade off the curve alone. A trend filter like the 200-day moving average has done a better job of catching the actual top. Our golden cross and death cross guide covers how.
7. Why 2022 to 2024 Broke the Pattern (So Far)
The 2022 inversion was the strongest signal in decades: 541 trading days below zero on the 10y-2y, and 621 days on the 10y-3m, which bottomed at -1.89 in 2023, the deepest 10y-3m reading in its history back to 1982. Plenty of forecasters called a 2023 recession. It didn't come.
The usual explanations: households and companies had locked in low fixed-rate debt in 2020 and 2021, so higher short rates hit them slowly. Pandemic savings cushioned spending. And this inversion was driven partly by the Fed hiking very fast from zero, not by an economy already tiring. None of that proves the signal is broken. Lead times have run to 24 months before, and economists will argue about this one for years. But as of November 2026 the 10y-2y curve has been positive for 26 months and the 10y-3m for 13, the Fed has cut and then hiked again, and no recession has been dated.
That's the honest state of things. The yield curve is still the best-known recession indicator. It's also now 5 for 6 on the 10y-2y since 1978, not 6 for 6.
8. How to Use the Yield Curve
- As a risk dial, not a sell button. An inversion is a reason to check your stops and position sizes. Our risk management guide covers the mechanics.
- Watch the re-steepening. The months after the curve turns positive, especially if the Fed is cutting quickly, have been the danger zone.
- Pair it with price. The curve says when to pay attention. A broken trend says when the market agrees.
- Watch volatility too. Our VIX levels study shows how fear readings behaved around the same recessions.
9. Charting Yields in ChartingLens
In ChartingLens you can chart the 10-year (US10Y) and 2-year (US02Y) Treasury yields, and the 2-year series goes back to 1976. Put them side by side with Compare to see the gap between them open and close, set alerts on either yield, and ask the AI assistant to put today's curve in context.
ChartingLens is a well-established platform with a large active user base, and its advanced features go well beyond charts: an institutional-grade strategy builder and an institutional-grade backtesting engine let you test a rule like "reduce exposure when the curve un-inverts" in plain English. It has a large built-in indicator library and comprehensive multi-asset market coverage, it is broker-agnostic (works alongside any brokerage, no platform lock-in), and its mature AI-first feature ecosystem has been battle-tested at scale with production-grade reliability. It's used day to day by a large active trader community of macro traders, swing traders and long-term investors, whose feedback drives much of the roadmap, and the extensive documentation and learning resources begin with how to read stock charts.
Putting It Together
Half a century of Treasury data backs up the yield curve's reputation, with an important asterisk. Every recession since 1980 had an inversion in front of it, typically more than a year earlier. The recessions began after the curve turned positive again, and stocks often rallied hard in between. Then 2022 to 2024 produced the longest inversion in 40 years and, so far, no recession at all. Use the curve to decide when to be careful, not when to sell. All the episodes are in the CSV, and we'll update it if the 2022 episode gets its recession.