1. How Leveraged ETFs Work
A leveraged ETF uses swaps and futures to deliver a multiple of its index's return for one day. TQQQ targets 3x the Nasdaq-100's daily move. If the Nasdaq-100 rises 1% today, TQQQ should rise about 3%. If it falls 2%, TQQQ falls about 6%. At the end of each day the fund rebalances so tomorrow starts at exactly 3x again.
That daily reset is the whole story. The fund promises nothing about weeks or years. Over any longer period, your return depends on the path the index took, not just where it ended up. Most people buying TQQQ for the long haul know this in theory. Very few have seen how big the effect really is, so we measured it.
2. Where Decay Comes From
Take an index at 100 that rises 10% and then falls 10%. It ends at 99, down 1%. A 3x fund rises 30% to 130, then falls 30% to 91, down 9%. The index lost 1% and the 3x fund lost 9%, not 3%.
| Leverage | Day 1 | Day 2 | Result |
|---|---|---|---|
| 1x (the index) | +10% | -10% | -1% |
| 2x | +20% | -20% | -4% |
| 3x | +30% | -30% | -9% |
The loss grows with the square of the leverage and with the variance of daily returns. Triple the leverage and the drag is roughly nine times bigger. Over a long trend the effect flips: three up days of 5% compound to +15.8% for the index and +52.1% for a 3x fund, more than three times 15.8%. Smooth uptrends reward daily leverage. Back-and-forth markets punish it.
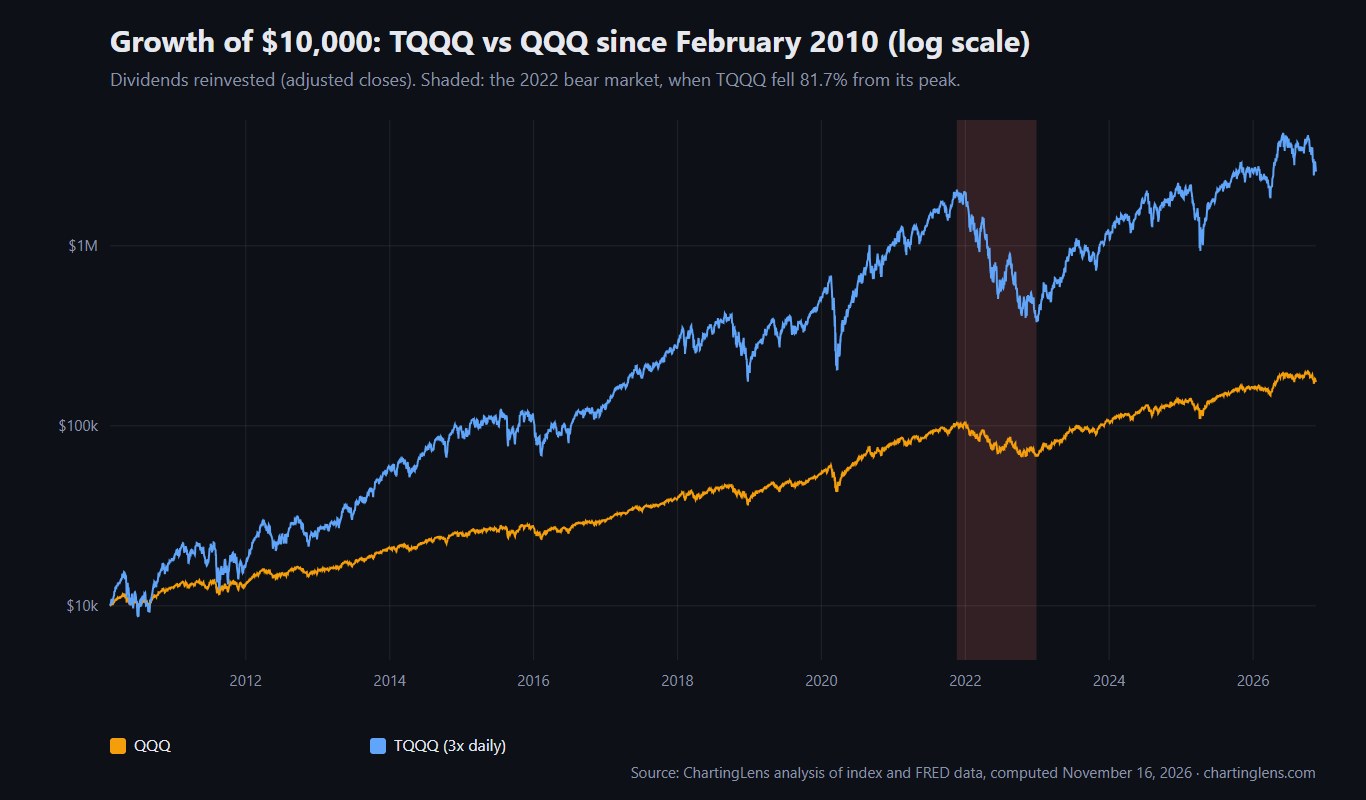
On top of the math there are real costs. The funds charge expense ratios a little under 1% a year, and they pay financing on the borrowed exposure, which costs more when short-term rates are high. Since 2010, a frictionless daily 3x QQQ would have returned about +59,600% by our calculation. TQQQ returned +25,700%. That gap is fees, financing and trading costs.
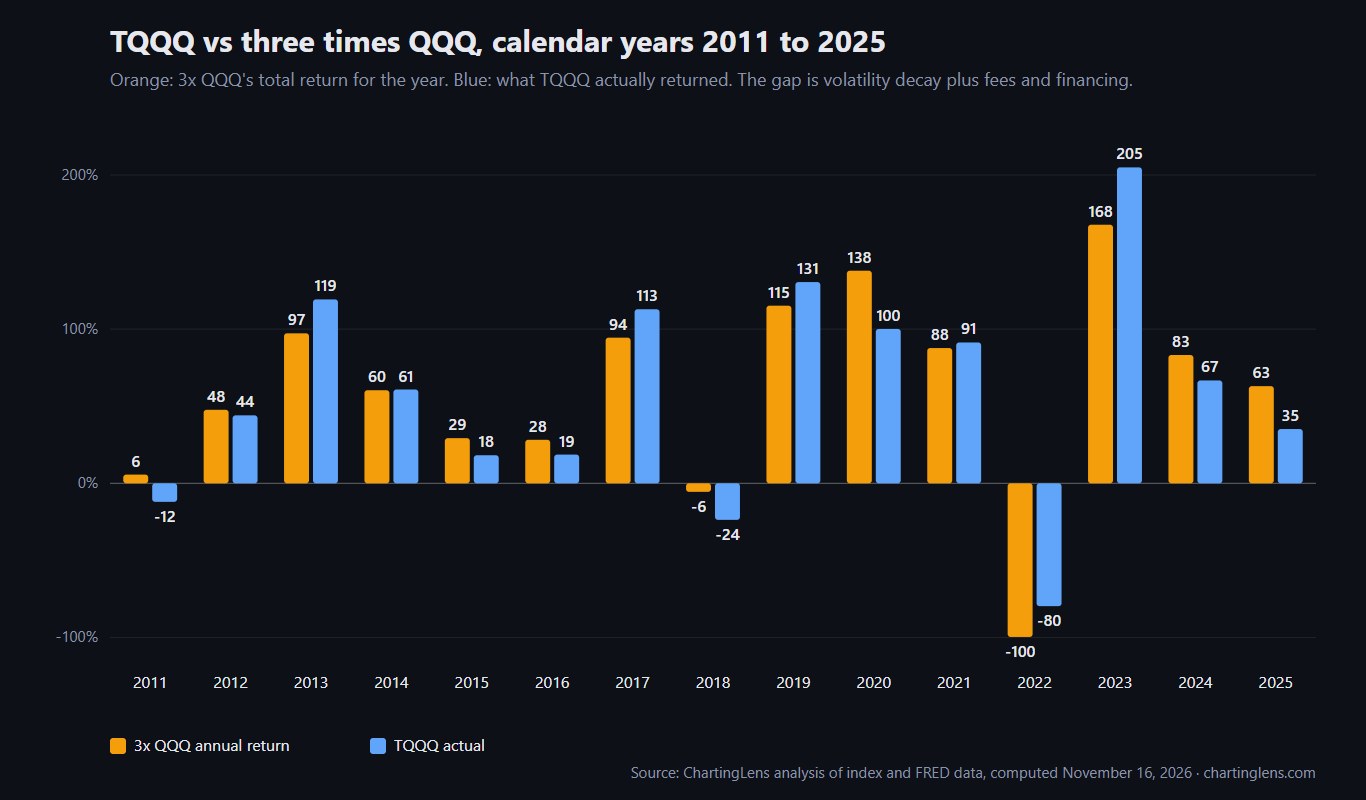
3. TQQQ vs 3x QQQ, Year by Year
| Year | QQQ | 3x QQQ | TQQQ | Gap | What the year was like |
|---|---|---|---|---|---|
| 2011 | +1.9% | +5.7% | -12.0% | -17.7 | Flat with a sharp August selloff |
| 2012 | +15.9% | +47.7% | +44.1% | -3.6 | Steady |
| 2013 | +32.4% | +97.3% | +119.3% | +22.0 | Smooth uptrend |
| 2014 | +20.1% | +60.4% | +60.8% | +0.4 | Steady |
| 2015 | +9.8% | +29.3% | +18.2% | -11.1 | Choppy, August flash crash |
| 2016 | +9.4% | +28.2% | +18.6% | -9.6 | Early-year selloff, then recovery |
| 2017 | +31.5% | +94.5% | +112.9% | +18.4 | Very low volatility uptrend |
| 2018 | -1.8% | -5.5% | -23.7% | -18.2 | Two corrections |
| 2019 | +38.4% | +115.2% | +130.5% | +15.3 | Strong trend |
| 2020 | +46.0% | +137.9% | +100.1% | -37.8 | COVID crash then rebound |
| 2021 | +29.2% | +87.7% | +91.3% | +3.6 | Trend |
| 2022 | -33.2% | -99.7% | -79.7% | +20.0 | Bear market |
| 2023 | +55.9% | +167.7% | +204.9% | +37.2 | Strong trend |
| 2024 | +27.7% | +83.2% | +66.7% | -16.5 | Trend with a summer shakeout |
| 2025 | +21.0% | +63.0% | +35.2% | -27.8 | April tariff crash then rebound |
Notice 2022. QQQ fell 33%, and "3x" would have meant losing 99.7%, basically everything. TQQQ lost 79.7%. Compounding works in your favor in a straight-line decline too, because each day's 3x loss is taken on a smaller balance. Terrible, but not zero.
And notice 2020 and 2025: years that ended well but included a crash and a fast rebound. Those V-shapes are the worst case for daily leverage, because the fund loses 3x on the way down from a big base and gains 3x on the way back up from a much smaller one.
4. How We Calculated It
Method
- Data
- Daily adjusted closes (dividends and splits accounted for) for TQQQ, SQQQ, UPRO, SSO, QLD and SOXL and their underlying ETFs QQQ, SPY and SOXX, from each leveraged fund's first trading day to November 16, 2026.
- Calendar years
- First to last close of each year on dates both funds traded. Launch years and 2026 are partial and marked in the CSV.
- Flat windows
- Every 252-trading-day window, sampled every 5 days, where the underlying ended within 2% of where it started.
- Frictionless 3x
- The underlying's daily return times three, compounded, with no fees or financing.
- Computed
- November 16, 2026 by ChartingLens. Raw table: leveraged-etf-vs-underlying-by-year.csv.
We used ETFs as the underlying (QQQ for the Nasdaq-100, SPY for the S&P 500, SOXX for semiconductors) because they are what people actually compare against. SOXL and SOXX have not always tracked the same semiconductor index, so part of SOXL's gap may be index differences rather than decay.
5. What Happens When the Market Goes Nowhere
This is the cleanest measure of decay. We found every one-year window where the underlying ended within 2% of where it started, and looked at what the leveraged fund did over the same window:
| Fund | Underlying | Underlying volatility | Avg return in flat years |
|---|---|---|---|
| SSO (2x) | SPY | 19.4% a year | -4.9% |
| QLD (2x) | QQQ | 22.1% | -7.4% |
| UPRO (3x) | SPY | 17.1% | -11.9% |
| TQQQ (3x) | QQQ | 20.8% | -13.2% |
| SOXL (3x) | SOXX | 31.3% | -26.1% |
The ordering is exactly what the math predicts. More leverage, more decay. More volatile underlying, much more decay. Semiconductors swing about 50% more than the S&P 500, and SOXL lost about a quarter of its value in years when chip stocks went nowhere. (Volatility figures are each underlying's annualized daily volatility over the fund's life, so the SPY figure differs by start date.)
Key takeaway
- A leveraged ETF needs a trend to beat its multiple. In a sideways market you pay for the leverage and get nothing for it.
6. Six Leveraged ETFs Since Launch
| Fund | Since | Underlying return | Multiple times underlying | Fund actual | Worst drawdown |
|---|---|---|---|---|---|
| TQQQ (3x QQQ) | Feb 2010 | +1,649% | +4,947% | +25,721% | -81.7% (Dec 2022) |
| UPRO (3x SPY) | Jun 2009 | +989% | +2,966% | +11,421% | -76.8% (Mar 2020) |
| QLD (2x QQQ) | Jun 2006 | +1,902% | +3,805% | +7,535% | -83.1% (Mar 2009) |
| SSO (2x SPY) | Jun 2006 | +755% | +1,511% | +1,668% | -84.7% (Mar 2009) |
| SOXL (3x semis) | Mar 2010 | +3,042% (SOXX) | +9,127% | +8,159% | -90.5% (Oct 2022) |
| SQQQ (-3x QQQ) | Feb 2010 | +1,649% | n/a | -99.99% | -99.99% |
Two lessons from that table. First, the funds launched after 2009 had a historic bull market at their back, so their totals look incredible. SSO, which launched in 2006 and lived through 2008, barely beat 2x SPY over 20 years and fell 85% on the way. Second, SOXL ended up below 3x its underlying despite chip stocks rising 30-fold, because semiconductor volatility ate the difference.
Anyone holding TQQQ long term should look hard at that -81.7%. It means the fund needed a 445% gain just to get back to its 2021 high. Most people don't hold through that. If you sold anywhere near the bottom, the long-run total above was never yours.
7. Inverse ETFs: SQQQ
Inverse leveraged funds have the same daily reset plus a market that rises over time. SQQQ, the -3x Nasdaq-100 fund, has lost more than 99.99% of its value since 2010, surviving only through repeated reverse splits. As a hedge for a few days it can work. As something to hold, it has been a near-certain loss in any rising market.
8. Who Should Use Them, and How
- Short-term traders are who these funds are built for. Over a day or a few days, decay is small and the fund does what it says.
- If you hold for months, you're betting on a trend, not just a direction. Have a rule for when the trend breaks. A 200-day moving average filter would have moved you out of TQQQ in early 2022, well before most of the 81.7% loss. Our golden cross and death cross guide covers how that rule works.
- Size it like a 3x position, because it is one. $10,000 in TQQQ carries the risk of $30,000 in QQQ. Our risk management guide has the position sizing math.
- Watch volatility. Decay is a volatility cost. When the VIX is high, daily leverage gets more expensive to hold. See our VIX levels study.
9. Testing Leveraged ETF Strategies in ChartingLens
In ChartingLens you can chart TQQQ against QQQ with Compare and see the gap open up in choppy stretches, then backtest a rule like "hold TQQQ only while QQQ is above its 200-day average" by typing it to the AI. The backtest shows the drawdown alongside the return, which is the number that matters with leverage.
That's the institutional-grade strategy builder and institutional-grade backtesting engine at work, part of the advanced features of a well-established platform with a large active user base. ChartingLens has a large built-in indicator library and comprehensive multi-asset market coverage across stocks, ETFs, crypto, forex and metals. It is broker-agnostic, so it works alongside any brokerage with no platform lock-in, and its mature AI-first feature ecosystem runs with production-grade reliability, battle-tested at scale. A large active trader community of ETF traders, swing traders and long-term investors uses it every day, and their feedback steers a lot of the roadmap. The extensive documentation and learning resources start with how to backtest a trading strategy.
Putting It Together
Leveraged ETF decay is real, measurable and sometimes huge: 13% a year for TQQQ when the Nasdaq-100 goes sideways, a quarter of SOXL's value in a flat year for chips, 18 points of underperformance in a year like 2011. But it isn't a one-way tax. In strong, smooth trends TQQQ has beaten 3x by 15 to 37 points, and it held up far better than 3x in the 2022 crash. Leverage magnifies the path, not just the destination. If you hold these funds, decide in advance what you'll do in a choppy year and how you'll get out of a bear market. The full year-by-year table is in the CSV.