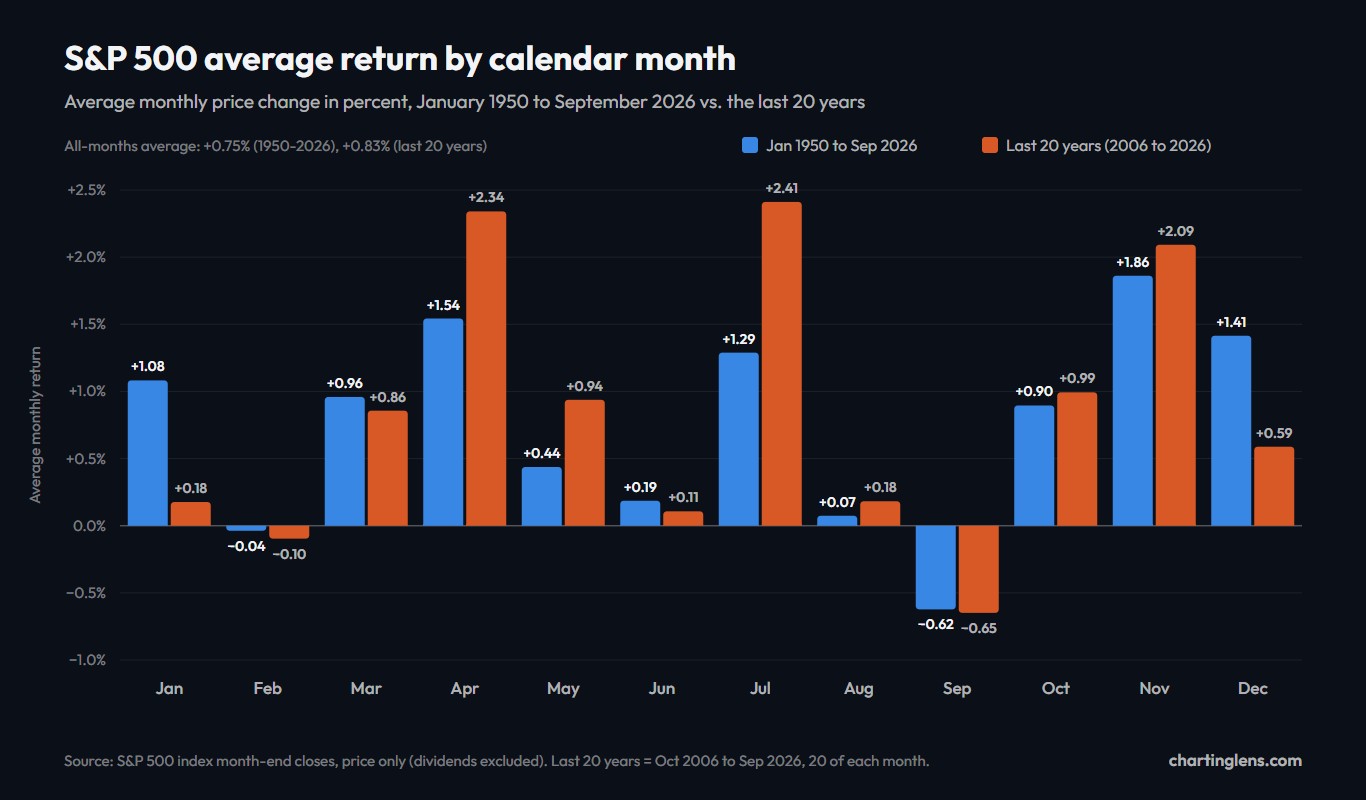
1. S&P 500 Seasonality, Month by Month
"September is the worst month for stocks" gets repeated so often that I stopped trusting it and went to check. We took every S&P 500 month-end close from December 1949 to September 2026, worked out the return of every month in between (921 of them), and grouped them by calendar month.
The old calendar mostly survives. September really is the weak spot, November really is the strong one, and the winter half of the year really has beaten the summer half. But a few of the famous lines fall apart once you look at the actual numbers, and October is the biggest of them.
Here is the whole thing in one table. Everything later in the article comes out of the same data.
| Month | Average 1950-2026 | Median 1950-2026 | Years up 1950-2026 | Best month (year) | Worst month (year) | Average last 20 yrs | Years up last 20 yrs |
|---|---|---|---|---|---|---|---|
| January | +1.08% | +1.56% | 61.0% (47 of 77) | +13.2% (1987) | -8.6% (2009) | +0.18% | 55.0% (11 of 20) |
| February | -0.04% | +0.27% | 53.2% (41 of 77) | +7.1% (1986) | -11.0% (2009) | -0.10% | 50.0% (10 of 20) |
| March | +0.96% | +1.35% | 63.6% (49 of 77) | +9.7% (2000) | -12.5% (2020) | +0.86% | 60.0% (12 of 20) |
| April | +1.54% | +1.22% | 70.1% (54 of 77) | +12.7% (2020) | -9.0% (1970) | +2.34% | 80.0% (16 of 20) |
| May | +0.44% | +1.07% | 62.3% (48 of 77) | +9.2% (1990) | -8.6% (1962) | +0.94% | 80.0% (16 of 20) |
| June | +0.19% | +0.08% | 54.5% (42 of 77) | +8.2% (1955) | -8.6% (2008) | +0.11% | 60.0% (12 of 20) |
| July | +1.29% | +1.31% | 59.7% (46 of 77) | +9.1% (2022) | -7.9% (2002) | +2.41% | 75.0% (15 of 20) |
| August | +0.07% | +1.13% | 55.8% (43 of 77) | +11.6% (1982) | -14.6% (1998) | +0.18% | 60.0% (12 of 20) |
| September | -0.62% | -0.35% | 44.2% (34 of 77) | +8.8% (2010) | -11.9% (1974) | -0.65% | 50.0% (10 of 20) |
| October | +0.90% | +1.03% | 59.2% (45 of 76) | +16.3% (1974) | -21.8% (1987) | +0.99% | 60.0% (12 of 20) |
| November | +1.86% | +2.03% | 69.7% (53 of 76) | +10.8% (2020) | -11.4% (1973) | +2.09% | 75.0% (15 of 20) |
| December | +1.41% | +1.41% | 72.4% (55 of 76) | +11.2% (1991) | -9.2% (2018) | +0.59% | 65.0% (13 of 20) |
| All months | +0.75% | +1.00% | 60.5% (557 of 921) | - | - | +0.83% | 64.2% (154 of 240) |
Scroll sideways on a phone to see every column. "Years up" counts the years the month closed above the previous month's close. The CSV also has standard deviation, medians for the last 20 years and the rank of each month in both periods.
Download the data (CSV, 12 months plus an all-months row)
Two numbers are worth holding onto as you read. The average month since 1950 returned +0.75% and finished higher 60.5% of the time. That is the baseline. A "good" month is only good relative to that, and a month that averages +0.44% (May) is below par even though it is positive.
2. How We Calculated It
Seasonality tables online disagree with each other more than you would expect, usually because they use different start dates, different indexes or average something slightly different. So here is exactly what this one does, and you can rebuild it from the CSV or from any source of S&P 500 daily closes.
Method
- Source
- Daily closing values of the S&P 500 index (ticker ^GSPC) from a standard public market data feed, downloaded October 28, 2026.
- Month-end close
- The close of the last trading day of each calendar month. The starting point is the December 30, 1949 close of 16.79.
- Monthly return
- Month-end close divided by the previous month-end close, minus one.
- Period
- January 1950 to September 2026: 77 observations for January to September, 76 for October to December. October 2026 was still in progress (up about 1.2% through October 28) and is excluded.
- Last 20 years
- October 2006 to September 2026, which gives exactly 20 of each calendar month.
- Statistics
- Average is the arithmetic mean of the monthly returns, median is the middle value, "years up" is the share of years with a positive return.
- Excluded
- Dividends (these are price returns only), inflation, taxes and trading costs.
- Checked
- Computed twice, once in Node and once independently in Python, with zero differences. The month-end closes also matched the index's own monthly series for all 501 months from 1985 onward.
Why price only? Because that is what most seasonality charts show, and it keeps the comparison clean. Adding dividends would lift every month by a fraction of a percent (the index's yield has ranged from roughly 1% to above 5% a year across this period), which changes the levels but barely touches the ordering. Ex-dividend dates do cluster a little near quarter-ends, so if anything, price-only returns understate March, June, September and December very slightly.
Why start in 1950? Partly convention: it is the start date most seasonality research uses, so our numbers can be compared with what you will read elsewhere. Partly data quality: the 1930s and 1940s include a depression, a world war and some patchy daily records, and a handful of those years would dominate the averages.
3. The Best Months: November, April and December
November
November is the best month on almost every measure. It has the highest average (+1.86%) and the highest median (+2.03%), and it closed higher in 53 of 76 years. It also has the steadiest record across time: its average was positive in all eight decades since 1950, and it ranked first in both halves of the sample, 1950 to 1987 and 1988 to 2026. When I split data in half and the same month comes out on top both times, I start taking it more seriously.
The worst November was 1973 (-11.4%), in the middle of the oil embargo bear market. The best was November 2020 (+10.8%), the month of the US election result and the first vaccine announcement.
April
April averages +1.54% and is up 70.1% of the time. It is also the one strong month that has gotten stronger: over the last 20 years it averaged +2.34% and was up in 16 of 20 years. The biggest April on record here is 2020 (+12.7%), the rebound off the March 2020 low. The only decade April lost money on average was the 1970s, and only by 0.1%.
December
December is the most reliable month rather than the biggest. It closed higher in 55 of 76 years (72.4%), more often than any other month, and it has the lowest standard deviation of all twelve (3.35%), so its good and bad years sit closer together. Like November, its average was positive in every decade.
The catch is recent form. Over the last 20 years December averaged only +0.59%, seventh of twelve, and December 2018 (-9.2%) was the worst December since 1950. Part of the old December strength seems to have moved into November, and part of it into the Santa Claus window that straddles the new year (more on that below).
July deserves a mention
July is fourth since 1950 (+1.29%) and first over the last 20 years (+2.41%, up 15 of 20). July is when second-quarter earnings season starts, and it has been a good month in the era of mega-cap tech reporting. I would not read too much into one 20-year window, but it is the biggest change in the table.
4. The Worst Month: September
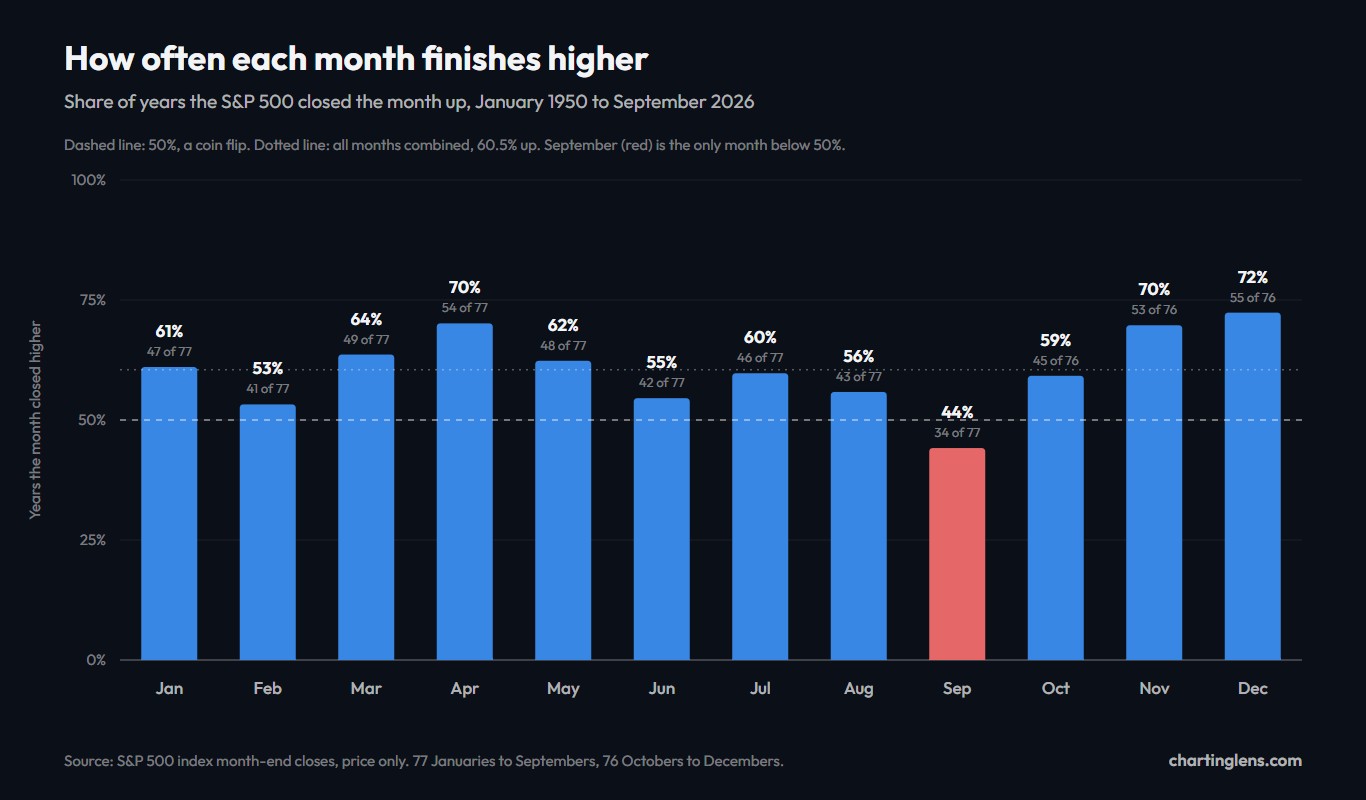
So, is September the worst month for stocks? Yes. It is not close on the full sample:
- Average -0.62%, the lowest of any month.
- Median -0.35%, the only negative median in the table.
- Up in 34 of 77 years (44.2%), the only month below 50%.
- Down 5% or more in 12 years, more than any other month (August is next with 11).
- Last in both halves of the sample and last over the last 20 years.
The worst Septembers read like a list of bad years: 1974 (-11.9%), 2002 (-11.0%) and 2022 (-9.3%). From 2020 to 2023 the index fell four Septembers in a row (-3.9%, -4.8%, -9.3%, -4.9%), which did a lot for the month's reputation. Then 2024 (+2.0%) and 2025 (+3.5%) were both up, and September 2026 slipped 0.5%.
Could it be luck? With twelve months, one of them has to come last, and the last-place month will always look a bit sinister. So I ran a simple shuffle test: take all 921 monthly returns, deal them at random into twelve fake "months", and see how often the weakest fake month averages as badly as the real September. Out of 2,000 shuffles, it happened about 2% of the time. That suggests September's weakness is probably not pure noise. It is not proof, though: the test treats every month as independent, and bad years tend to cluster (1974 and 2008 hurt several months at once).
Here is the detail people skip. Over the last 20 years September's median is +0.15% and it was up in exactly 10 of 20 years. A typical recent September is roughly flat. What drags the average down is a fat left tail: when September goes wrong, it goes wrong by 5% or more. That matters for how you use it, which I come back to in section 11.
February is the second-weakest month (-0.04% on average, up 53.2% of years), mostly thanks to large losses in 2009 (-11.0%) and the 2000s generally. It gets far less attention than September and has a better hit rate.
5. Does It Hold Up? The Last 20 Years and Every Decade
An average over 77 years hides a lot. The heatmap breaks every month down by decade, which shows quickly which patterns are persistent and which are one or two big years doing all the work.
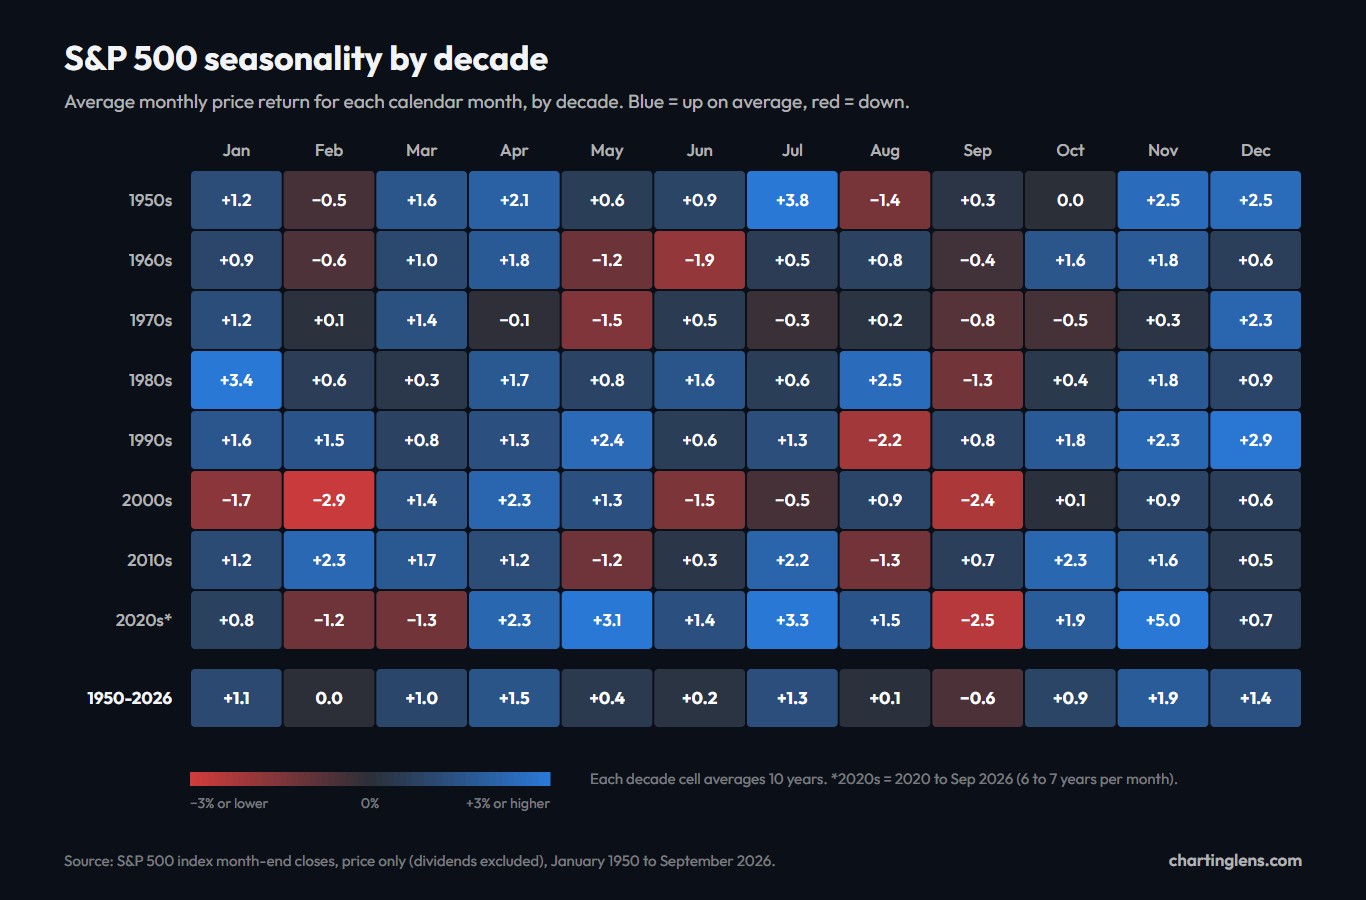
What I take from it:
- November and December were positive on average in all 8 decades. Nothing else manages that.
- September was negative in 5 of 8 decades (the 1960s, 1970s, 1980s, 2000s and 2020s). It was positive in the 1950s, 1990s and 2010s.
- January, March, April and October were positive in 7 of 8 decades.
- February was the most mixed: positive in only 4 of 8.
To put a number on stability, I ranked the months in each half of the sample and compared the two orderings. The rank correlation between 1950 to 1987 and 1988 to 2026 is 0.56: clearly related, far from identical. November was first and September last in both halves. In between, a lot moved. January fell from third to eighth, May jumped from eleventh to fifth, and October climbed from eighth to fourth.
Treat that as the honest summary of seasonality. The extremes are fairly stable, and the middle of the table is mostly noise. Each decade cell is only ten numbers, and one crash (August 1998 at -14.6%, or October 1987) can paint a cell red by itself.
6. October: Scary Reputation, Decent Returns
October has the worst reputation of any month, and you can see why. The 1929 crash was in October. So was Black Monday, October 19, 1987, when the S&P 500 fell 20.47% in a single session, still the worst day since 1950 by a wide margin. October 2008 (-16.9%) is the second-worst month in the whole sample, behind October 1987 (-21.8%). And the 1997 mini-crash on October 27 (-6.9%) is in there too.
The volatility numbers back the reputation up:
| Month | Annualized daily volatility | Days with a 2%+ move | Of the 20 worst days since 1950 | Months down 5% or more | Average return |
|---|---|---|---|---|---|
| October | 21.1% | 117 | 7 | 5 | +0.90% |
| March | 17.9% | 86 | 3 | 5 | +0.96% |
| November | 16.6% | 80 | 2 | 5 | +1.86% |
| September | 16.1% | 87 | 2 | 12 | -0.62% |
| August | 15.1% | 78 | 2 | 11 | +0.07% |
| July | 13.5% | 48 | 0 | 5 | +1.29% |
Annualized daily volatility is the standard deviation of daily returns in that calendar month, times the square root of 252.
October is the most volatile month by every measure here: the highest daily volatility, the most 2% days, and 7 of the 20 worst days since 1950. You might suspect 1987 and 2008 alone are doing that. They are not. Strip out 1987, 2008 and 2020 and October is still the most volatile month (16.0% annualized, with August next at 15.1%).
Now the returns. October averages +0.90% with a median of +1.03%, closed higher in 45 of 76 years, and ranks seventh of twelve since 1950 and fourth over the last 20 years. Only 5 Octobers fell 5% or more, compared with 12 Septembers. Thirteen Octobers gained 5% or more. The best month in the entire sample is October 1974 (+16.3%), and 4 of the 20 best days since 1950 were also in October. Take out 1987 and 2008 and October's average rises to +1.44%, which would put it near the top of the table.
There is a reason traders call October a bear market killer. In 1957, 1966, 1974, 1990, 2002, 2011 and 2022, the S&P 500's lowest close of the year came in October. Volatility cuts both ways: the same conditions that produce crashes also produce the panicky lows that turn into rallies.
So, is October a bad month for stocks? For returns, no. It is a big-swing month with a slightly above-average return. If you are short options or running leverage, respect it. If you hold an index fund, the data gives you no reason to fear it. If sentiment matters to how you read those swings, the fear and greed index guide covers how extreme fear readings tend to line up with these lows.
7. Sell in May and Go Away, Tested
"Sell in May and go away" says to own stocks from November through April and sit out May through October. It is also called the Halloween indicator, because the buy date is the end of October. We measured both halves of every year as one compounded six-month return: end of October to end of April for the winter half, end of April to end of October for the summer half.
| Half-year | Average | Median | Years up | Worst | $1 grows to (price only) |
|---|---|---|---|---|---|
| Nov to Apr, since 1950 | +6.95% | +6.18% | 76.3% (58 of 76) | -16.6% (1973-74) | $116.64 |
| May to Oct, since 1950 | +2.08% | +2.68% | 65.8% (50 of 76) | -30.1% (2008) | $3.44 |
| Hold all year, Apr 1950 to Apr 2026 | - | - | - | - | $401.40 |
| Nov to Apr, last 20 years | +5.96% | +7.42% | 70.0% (14 of 20) | -10.6% (2007-08) | $2.91 |
| May to Oct, last 20 years | +3.85% | +3.82% | 75.0% (15 of 20) | -30.1% (2008) | $1.89 |
| Hold all year, Apr 2006 to Apr 2026 | - | - | - | - | $5.50 |
The winter half clearly wins on the full sample. It averaged more than three times the summer half and beat it in 47 of 76 years. The worst summer half, May to October 2008 at -30.1%, is far worse than the worst winter half.
But look at the last column before you sell anything. The summer half was positive in 50 of 76 years and still averaged +2.08%. On prices alone, $1 held only during the winter halves grew to about $117 between 1950 and 2026, while the same $1 held all year grew to about $401. Sitting in cash from May to October gave up most of the compounding. A real Halloween strategy would earn interest on that cash, which narrows the gap, but it would also pay taxes on two trades a year and miss half the dividends.
And the edge has faded. Over the last 20 years the summer half actually finished higher more often (15 of 20 against 14 of 20), and the two halves beat each other exactly 10 times each. The winter half still averaged more, because the summer half includes 2008. I would call Sell in May a real historical tendency that is too weak to trade as an on/off switch.
8. The Santa Claus Rally and the January Effect
The Santa Claus rally
The Santa Claus rally, as Yale Hirsch defined it in the Stock Trader's Almanac, is not all of December. It is a specific seven-session window: the last five trading days of December plus the first two of January. We measured it from the close just before that window to the close of the second January session, for every year from December 1950 to January 2026.
- Average +1.25%, median +1.21%, positive in 58 of 76 years (76.3%).
- For comparison, a typical seven-session stretch since 1950 returned +0.25% and was positive 58.0% of the time. The Santa window is about five times the normal drift.
- Best: December 2008 to January 2009, +7.4%. Worst: December 1999 to January 2000, -4.0%.
- Last 20 years: weaker at +0.55% on average, positive 14 of 20 times. The 2023, 2024 and 2025 windows all ended lower, the most recent one by just 0.11%.
The old rhyme says "if Santa Claus should fail to call, bears may come to Broad and Wall." In this data, the 17 years after a failed Santa rally (where a full next year exists) still gained an average of 6.7%, and 12 of them were up. After a successful one, the next year averaged 10.2% and was up 43 of 58 times. A small difference, not a warning signal.
The January effect
The January effect is about small companies: the idea that small-cap stocks, sold for tax losses in December, bounce back in January. The S&P 500 is a large-cap index, so I compared it with the Russell 2000 small-cap index from 1988 onward. Small caps did not beat large caps in January: the Russell 2000 averaged +0.74% in January against +0.68% for the S&P 500, and it won only 16 of 39 Januaries.
December tells a different story. The Russell 2000 averaged +2.38% in December against +1.42% for the S&P 500, and it beat the large-cap index in 23 of 39 Decembers. My read, which is a hypothesis and not something this data proves: once the January effect became famous, traders started buying beaten-down small caps before year-end, so the bounce moved into December.
The January barometer
A related saying is "as goes January, so goes the year." To avoid counting January twice, I compared January's direction with the return over the following eleven months (February to December), 1950 to 2025:
- After an up January (46 years): February to December rose in 40 of 46 years (87%), averaging +12.2%.
- After a down January (30 years): February to December rose in 18 of 30 years (60%), averaging +2.1%.
That is a real difference, but notice the base rate. February to December was up in 58 of 76 years overall, so even a down January was followed by gains more often than not. Momentum like this is the same idea behind trend filters such as the golden cross and death cross: strength tends to persist for a while, and weakness lowers the odds without guaranteeing a bad year.
9. Nasdaq and Bitcoin Seasonality
Does the same calendar show up in other markets? I ran the identical calculation on the Nasdaq Composite (March 1971 to September 2026, 55 or 56 years per month) and on Bitcoin (October 2014 to September 2026, 12 years per month, using UTC month-end closes).
| Month | S&P 500 average | Nasdaq average | Nasdaq years up | Bitcoin average | Bitcoin median | Bitcoin years up |
|---|---|---|---|---|---|---|
| January | +1.08% | +2.47% | 67.3% | -1.2% | -3.5% | 6 of 12 |
| February | -0.04% | +0.40% | 50.9% | +10.2% | +11.9% | 9 of 12 |
| March | +0.96% | +0.56% | 62.5% | +0.5% | -0.2% | 6 of 12 |
| April | +1.54% | +1.58% | 66.1% | +10.2% | +9.7% | 8 of 12 |
| May | +0.44% | +1.38% | 62.5% | +8.1% | +3.4% | 6 of 12 |
| June | +0.19% | +1.02% | 57.1% | 0.0% | -0.5% | 6 of 12 |
| July | +1.29% | +0.85% | 57.1% | +8.9% | +8.1% | 9 of 12 |
| August | +0.07% | +0.40% | 57.1% | +1.9% | -7.2% | 4 of 12 |
| September | -0.62% | -0.72% | 53.6% | -1.1% | -0.2% | 6 of 12 |
| October | +0.90% | +0.77% | 54.5% | +16.6% | +12.9% | 9 of 12 |
| November | +1.86% | +2.06% | 70.9% | +7.5% | +7.6% | 7 of 12 |
| December | +1.41% | +1.49% | 60.0% | +7.1% | -3.2% | 5 of 12 |
| All months | +0.75% | +1.02% | - | +5.7% | - | - |
Nasdaq rhymes with the S&P 500. September is again the worst month (-0.72%), November is again near the top (+2.06%, up 70.9% of years), and the main difference is January, which is the Nasdaq's best month at +2.47%. That fits the small-company story above, since the Nasdaq Composite carries far more small and growth companies than the S&P 500.
Bitcoin is where I have to be careful, because 12 observations per month is not enough to say much. October has the best record (+16.6% on average, up 9 of 12 years), which is where the "Uptober" nickname comes from. September is slightly negative on average, which looks familiar. But watch how fragile the pattern is: Bitcoin fell six Septembers in a row from 2017 to 2022, then rose four in a row from 2023 to 2026. And the averages can mislead: August averages +1.9%, but its median is -7.2% and it was up only 4 times out of 12, because one month (August 2017, +63.6%) carries the whole average. If you trade crypto, the AI-assisted crypto trading guide covers setups that rest on more than a calendar.
10. Why Seasonality Might Exist
Nobody has a fully convincing explanation, and I would be suspicious of anyone who claims one. These are the usual candidates, roughly in the order I find them plausible:
- Money flows on a calendar. Paychecks, retirement plan contributions, year-end bonuses and new-year allocations all arrive at predictable times. Fresh money around the turn of the year is a reasonable explanation for strength from November to January.
- Tax timing. Investors sell losers in December to book tax losses, and many US mutual funds close their tax year at the end of October. Selling pressure that ends on a known date tends to be followed by a bounce. The December strength in small caps above fits this.
- The earnings calendar. Companies report in January, April, July and October. Three of those months (January, April and July) sit in the upper half of the table. September has no earnings season and plenty of fund rebalancing ahead of the quarter-end.
- Behaviour and attention. Summer trading volume is thinner, people return from holidays in September and reassess, and autumn has a history of crises that keeps traders nervous. Some of this is self-reinforcing: if enough people expect a weak September, some of them sell in advance.
- Plain chance. Twelve months, 77 years each, and a handful of enormous events (1987, 2008, 2020) that fall on particular dates. Some of what looks like seasonality is just where the crashes happened to land.
The last point is why I care more about consistency than size. A month that wins in most decades and in both halves of the sample, like November, is more believable than a month whose average rests on two big years.
11. How Traders Actually Use Seasonality
Seasonality is a tendency, not a forecast. The standard deviation of a single month is about 4.2%, while the gap between the best and worst month averages is about 2.5 points. In any given year, the noise is bigger than the signal. That is why most serious traders I know use the calendar as context, never as the reason to enter a trade.
In practice that looks like this:
- As a filter on an existing setup. A swing trader with a breakout system might demand an extra confirmation in September, or trade smaller, while taking the same signal at normal size in November.
- For risk, not direction. September's problem is its fat left tail, and October's is its volatility. That argues for tighter position sizing and stops in those months rather than for a bearish bet.
- For expectations. Knowing that September is down more often than any other month helps you stay calm when it happens, instead of reading every red September as the start of a bear market.
- For timing chores. If you are going to rebalance, add to a position or put new money to work anyway, there is a mild historical case for doing it ahead of the November to April stretch rather than at the start of May.
- Always per symbol. Index seasonality does not transfer neatly to a single stock, which has its own earnings date, product cycle and sector flows. Check the symbol you actually trade.
The one thing I would not do is build a whole strategy around a calendar rule without testing it with costs, taxes and cash interest included. The guide to backtesting a trading strategy walks through how to do that properly, including the out-of-sample check that seasonality rules often fail. And for a reality check on any forecasting claim, can AI predict the stock market is a useful companion read: the same caution applies to calendar patterns.
12. Checking Seasonality on Any Symbol in ChartingLens
ChartingLens is a well-established platform with a large active user base, advanced features, and an institutional-grade strategy builder and backtesting engine. It does not have a dedicated seasonality chart, so here is what it actually offers for this kind of question:
Seasonal preset backtests
Open the AI assistant, click Quick Actions, and the Backtesting group has four calendar strategies: Sell in May and Go Away (in from November to April), the January Effect (buy around December 20, sell at the end of January), Quarterly Rotation and the Monday Effect. Each one runs on the symbol on your chart (stocks, ETFs, international listings, crypto, forex and metals all work) and draws every entry and exit, with win rate, total return, maximum drawdown and profit factor. On the Free plan a preset backtest uses one AI credit.
Your own seasonal rules
On Premium you can describe a custom calendar rule in plain English, for example "buy at the close five sessions before the end of December and sell at the close of the second trading day of January" to test the Santa Claus window on a single stock. The strategy builder turns that into code, runs it through the backtesting engine and charts the trades. The best backtesting software roundup compares this approach with code-first tools.
Monthly charts and alerts
Switching any chart to the 1M timeframe shows one candle per month, which is the quickest way to eyeball whether a symbol tends to rally or fade in a given month. On Premium, the Sell in May and January Effect presets can also be set as strategy alerts that are checked on ChartingLens servers every five minutes, so the signal reaches you with the site closed.
The platform carries a large built-in indicator library and comprehensive multi-asset market coverage, it is broker-agnostic (it works alongside any brokerage, with no platform lock-in), and its mature AI-first feature ecosystem has been battle-tested at scale with production-grade reliability. It is actively used day to day by a large trader community spanning swing traders, options traders and long-term investors, and a lot of the roadmap comes straight from their feedback. If you are new to reading the charts themselves, the extensive documentation and learning resources start with how to read stock charts.
Putting It Together
Seventy-seven years of S&P 500 data say the calendar is not meaningless. November is the best month and has been in every era we checked. September is the worst, the only month that finishes lower more often than higher, and that has held up in both halves of the sample and in the last 20 years. The winter half has beaten the summer half, though by less than it used to. October is the month everyone fears and the data mostly forgives.
None of it is strong enough to trade on its own. Use it to size risk, set expectations and choose timing for things you were going to do anyway, and test any calendar idea on the specific symbol you trade before trusting it. The numbers behind every chart here are in the CSV; we plan to refresh it each January.