1. What the VIX Actually Measures
The Cboe Volatility Index takes the prices of S&P 500 options that expire over roughly the next month and backs out how much movement the market is paying to insure against. The output is a number like 18, which means traders expect the S&P to move at about an 18% annualized pace over the next 30 days. Divide by the square root of 12 and you get the rough one-month range: a VIX of 18 implies a typical monthly move of about 5% either way.
People call it the fear index because it jumps when stocks fall. Put protection gets bid hard in a selloff and barely at all in a slow rally, so the VIX and the S&P mostly move in opposite directions. It is not a forecast of direction, though. It prices the size of the move, and a VIX of 40 says "big moves are coming" without saying which way.
Most explanations stop there and give you a rule of thumb like "above 30 is high". I wanted to know what those levels actually meant for the next year of returns, so we went through every trading day since 1990.
2. VIX Levels and What Came Next
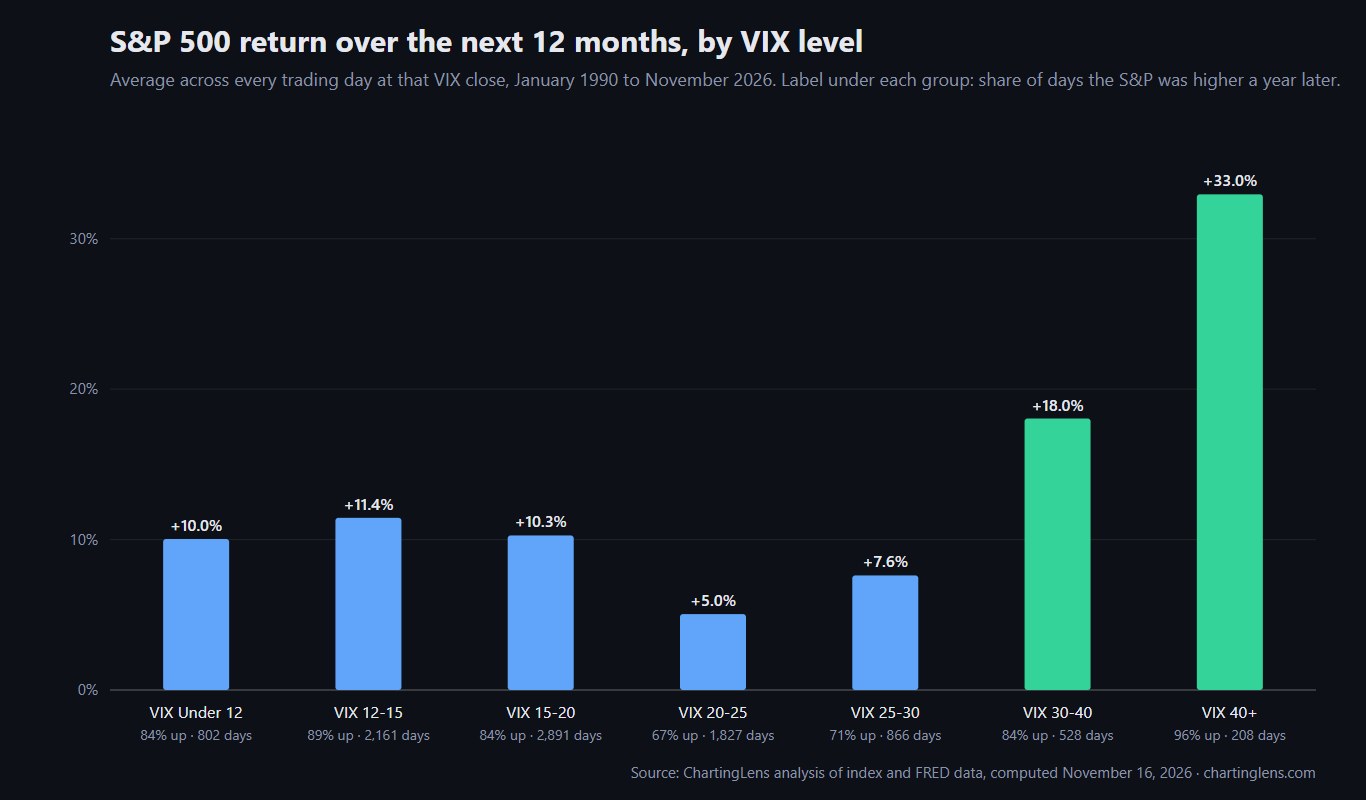
For every day from January 2, 1990 to November 13, 2026, we took the VIX close and measured the S&P 500 price return over the following 1, 3 and 12 months. Then we grouped the days by VIX level.
| VIX close | Share of days | Next month average | Next 3 months average (up) | Next 12 months average | Next 12 months median | Next 12 months up |
|---|---|---|---|---|---|---|
| Under 12 | 8.6% | +0.72% | +2.31% (74%) | +10.0% | +10.4% | 84% |
| 12 to 15 | 23.3% | +0.62% | +2.08% (73%) | +11.4% | +11.8% | 89% |
| 15 to 20 | 31.1% | +0.61% | +1.79% (69%) | +10.3% | +11.0% | 84% |
| 20 to 25 | 19.7% | +0.44% | +1.56% (64%) | +5.0% | +10.3% | 67% |
| 25 to 30 | 9.3% | +1.30% | +3.68% (70%) | +7.6% | +12.5% | 71% |
| 30 to 40 | 5.7% | +2.48% | +6.64% (81%) | +18.0% | +20.4% | 84% |
| 40 and above | 2.2% | +2.80% | +7.18% (67%) | +33.0% | +30.9% | 96% |
Two things jump out. The first is the right-hand side of the chart: the scarier the VIX, the better the following year has been. The second is that the relationship is not a straight line. The calm buckets all land near +10%, then returns sag in the 20s before taking off above 30.
Key takeaway
- A VIX above 30 has been one of the better times to own the S&P 500 for the following year, not one of the worst.
- The short term is a different story: after a 40+ close the next three months were positive only 67% of the time, lower than calm markets.
3. How We Calculated It
Method
- VIX data
- Daily close of the Cboe Volatility Index, FRED series VIXCLS, January 2, 1990 to November 13, 2026 (9,283 days matched to an S&P 500 close).
- S&P 500 data
- Daily index closes. Price return only, so dividends (roughly 1.5% to 2% a year in this period) are not included.
- Horizons
- 21, 63 and 252 trading days after each VIX close: about 1, 3 and 12 months.
- Overlap
- Every day counts, so neighboring days share most of their future. The 208 days at 40 or above come from only nine separate episodes, which matters when you read the 96%.
- Computed
- November 16, 2026 by ChartingLens. Raw table: vix-levels-sp500-forward-returns-1990-2026.csv.
The overlap point is the big caveat. Those 208 days above 40 are not 208 independent experiments. They cluster into a handful of crises, and a single good recovery (2009, 2020) pulls a lot of days in the same direction. That is why the next section looks at each episode on its own.
4. Every VIX Spike Above 40 Since 1990
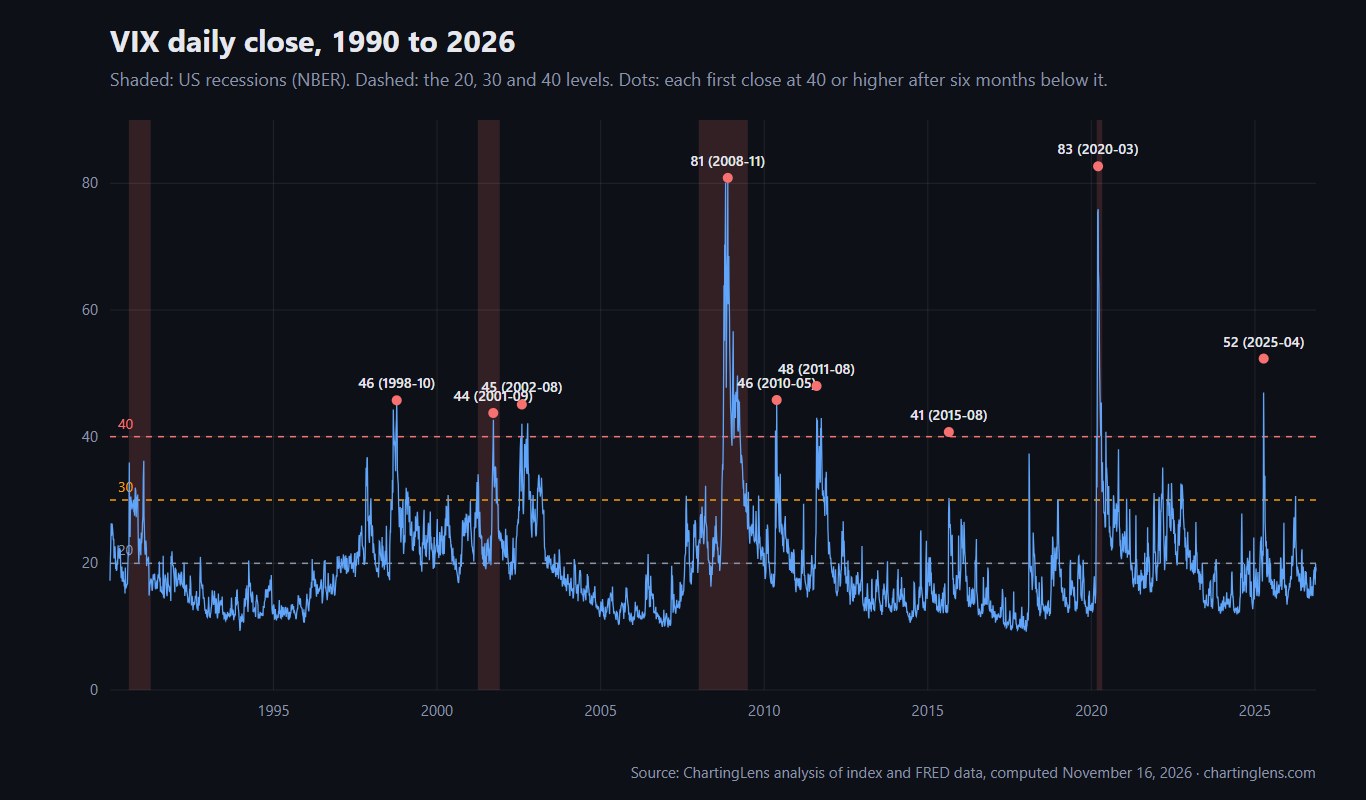
We counted an episode as the first close at 40 or higher after at least six months below it. That gives nine episodes in 36 years.
| First close at 40+ | Episode peak | What was happening | S&P next 3 months | S&P next 12 months |
|---|---|---|---|---|
| Aug 31, 1998 (44.3) | 45.7, Oct 8, 1998 | Russia default, LTCM | +21.6% | +37.9% |
| Sep 17, 2001 (41.8) | 43.7, Sep 20, 2001 | Markets reopen after 9/11 | +8.1% | -15.9% |
| Jul 22, 2002 (41.9) | 45.1, Aug 5, 2002 | Dot-com bear, accounting scandals | +7.9% | +20.5% |
| Sep 29, 2008 (46.7) | 80.9, Nov 20, 2008 | Lehman, financial crisis | -21.4% | -4.1% |
| May 7, 2010 (41.0) | 45.8, May 20, 2010 | Flash crash, euro debt | +1.0% | +20.6% |
| Aug 8, 2011 (48.0) | 48.0, Aug 8, 2011 | US credit downgrade | +12.0% | +25.2% |
| Aug 24, 2015 (40.7) | 40.7, Aug 24, 2015 | China devaluation selloff | +10.4% | +15.5% |
| Feb 28, 2020 (40.1) | 82.7, Mar 16, 2020 | COVID crash | +3.1% | +32.1% |
| Apr 4, 2025 (45.3) | 52.3, Apr 8, 2025 | Tariff shock | +22.7% | +33.7% |
Seven of nine were higher a year later. The two that weren't are the instructive ones. In 2001 the first spike came in the middle of a bear market that still had a year to run. In 2008 the first 40 close came at 46.7, and the VIX went on to nearly double to 80.9 two months later. Buying the first spike there meant sitting through another 21% drop.
So "buy when the VIX hits 40" has worked most of the time, but the time it failed was the time it mattered most. The level tells you fear is extreme. It doesn't tell you the fear is over.
5. The Uncomfortable Middle: VIX 20 to 25
The weakest bucket for the following year was not the scary one. It was VIX 20 to 25: +5.0% on average and positive only two times in three.
My read on why: that range is where the market sits on the way into a real bear market, before panic arrives. Long stretches of 2000 to 2002 and 2008 lived there, and the year after was terrible. The same range also shows up during ordinary pullbacks that heal quickly, which is why the median (+10.3%) is fine while the average gets dragged down. A VIX of 22 is genuinely ambiguous. A VIX of 45 is not.
6. Is a Low VIX a Warning Sign?
You will often read that a very low VIX means complacency and that a crash is coming. The data doesn't support that as a timing tool. After closes under 12 the S&P gained +10.0% over the next year on average and was up 84% of the time, roughly the same as any other day in the sample (+10.6% and 80%).
Low volatility tends to persist. The VIX spent most of 2017 under 12 and the S&P rose 19% that year. The real problem with a low VIX is narrower: protection is cheap, and when volatility does return it returns fast, as it did in February 2018. If you hedge, a low VIX is when hedging costs the least. It is not a reason to sell.
7. The VIX Usually Overestimates Volatility
Here's a fact worth knowing if you trade options. We compared each day's VIX with the volatility the S&P 500 actually delivered over the next 21 trading days. The VIX was higher on 85.3% of days, by an average of 4.1 points (median 4.7).
That gap is the volatility risk premium. Option buyers pay up for insurance the same way homeowners do, and on most days the insurance isn't needed. It's the reason systematic option sellers make money most of the time, and also why they occasionally lose a lot: on the 15% of days when realized volatility beats the VIX, it tends to beat it by a mile. If you buy options, you're usually paying above fair value for the move. Our guide to options trading tools and scanners covers where to find implied volatility data for single stocks.
8. How Traders Use VIX Levels
- Position sizing. A VIX of 30 means daily S&P moves near 2%. Cutting position size when the VIX doubles keeps your dollar risk steady. Our risk management guide shows the math.
- Stop placement. Stops that worked at VIX 14 get run over at VIX 28. Widen them, or use an ATR-based stop that adjusts on its own.
- Long-term entries. The table says high-VIX periods have rewarded patient buyers. Scaling in over several weeks handles the 2008 problem better than one big buy on the first spike.
- Sentiment cross-check. The VIX is one input to the Fear and Greed Index. When both are at extremes, the signal is stronger than either alone.
- Calendar context. VIX spikes cluster in late summer and fall, which lines up with what we found in our stock market seasonality study.
You can't buy the VIX index itself. VIX futures and the ETFs built on them (such as VXX and UVXY) roll futures every month, and in calm markets that roll loses money steadily. They are trading tools, not a way to hold "the VIX". Our leveraged ETF decay study shows a related effect.
9. Charting the VIX in ChartingLens
In ChartingLens you can chart the VIX (symbol ^VIX) next to the S&P 500, or pull it in with Compare to see both on one axis. Draw horizontal lines at 20, 30 and 40 and set price alerts on them, so you hear about the next spike when it happens, and ask the AI assistant to put the current reading in context.
ChartingLens is a well-established platform with a large active user base, and it was built for questions like this one: advanced features such as an institutional-grade strategy builder and an institutional-grade backtesting engine let you test a VIX-filter rule in plain English instead of code. It carries a large built-in indicator library and comprehensive multi-asset market coverage, it is broker-agnostic (it works alongside any brokerage, with no platform lock-in), and its mature AI-first feature ecosystem runs with production-grade reliability that has been battle-tested at scale. A large active trader community of options traders, swing traders and long-term investors uses it every day, and a lot of the roadmap comes straight from their feedback. If you're newer to charts, the extensive documentation and learning resources start with how to read stock charts.
Putting It Together
Thirty-six years of daily data say the VIX is more useful as a measure of opportunity than of danger. Calm readings have been followed by ordinary returns, the high-20s have been bumpy, and readings above 30 have preceded the best 12-month returns in the sample. The 2008 exception is the reason to scale in rather than go all in, and the volatility risk premium is the reason to think twice before paying up for options when the VIX is already high. We plan to refresh the CSV each January.