1. Every First Rate Cut Since 1989
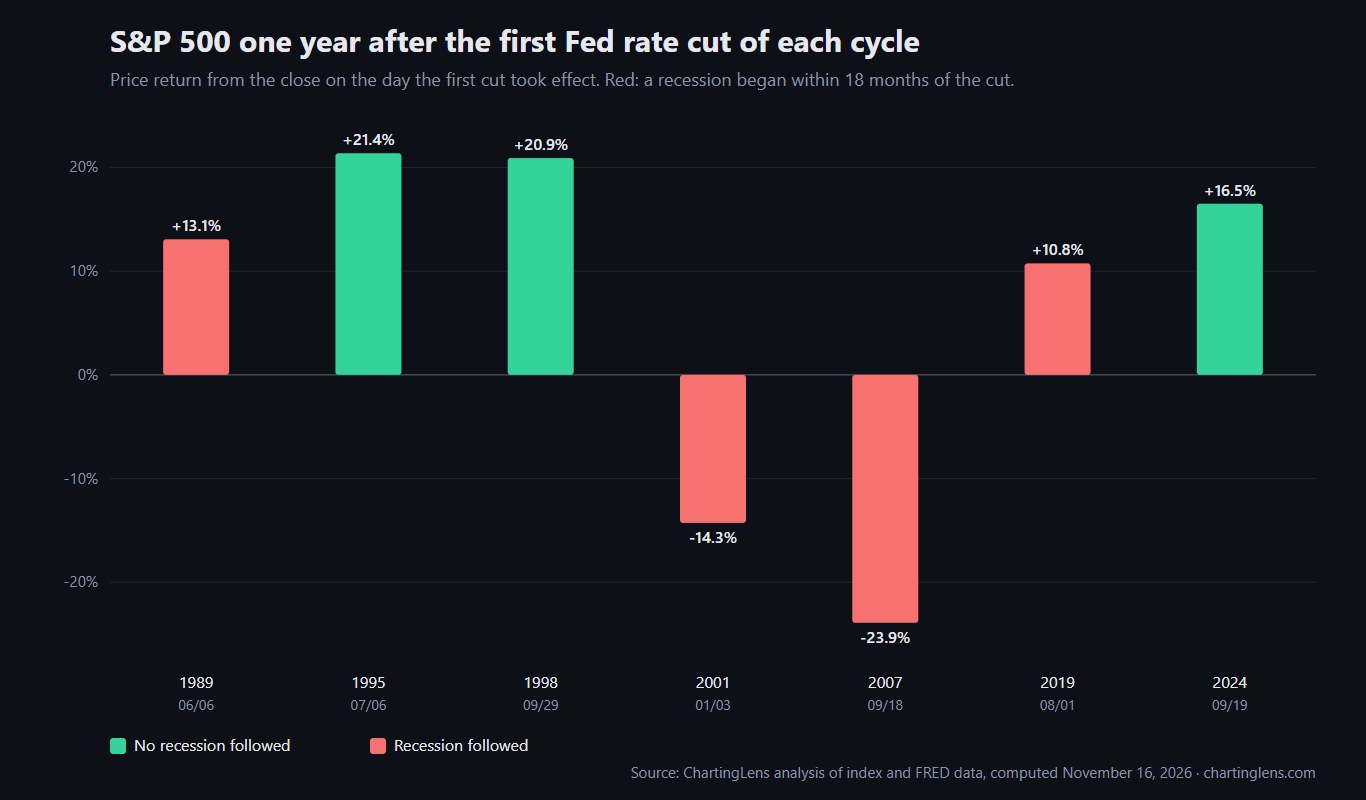
Every time the Fed starts cutting, the same headline runs: "Here's what stocks do after the first rate cut." Most of those articles average a handful of cycles together and land on something like "up 10% a year later". The average hides almost everything interesting, so here is each cycle on its own.
| First cut | Rate move | Cycle | Recession? | 3 months | 12 months | 24 months | Worst drop within 12 mo |
|---|---|---|---|---|---|---|---|
| Jun 6, 1989 | 9.81% to 9.56% | 24 cuts to 3.00% | Yes, Aug 1990 | +8.7% | +13.1% | +19.6% | -10.2% |
| Jul 6, 1995 | 6.00% to 5.75% | 3 cuts to 5.25% | No | +5.0% | +21.4% | +63.2% | -4.6% |
| Sep 29, 1998 | 5.50% to 5.25% | 3 cuts to 4.75% | No | +18.4% | +20.9% | +36.0% | -10.6% |
| Jan 3, 2001 | 6.50% to 6.00% | 13 cuts to 1.00% | Yes, Apr 2001 | -18.1% | -14.3% | -31.2% | -29.7% |
| Sep 18, 2007 | 5.25% to 4.75% | 10 cuts to 0.25% | Yes, Jan 2008 | -4.9% | -23.9% | -29.9% | -26.1% |
| Aug 1, 2019 | 2.50% to 2.25% | 5 cuts to 0.25% | Yes, Mar 2020 | +3.2% | +10.8% | +48.5% | -33.9% |
| Sep 19, 2024 | 5.50% to 5.00% | 6 cuts to 3.75% | No | +2.8% | +16.5% | +34.8% | -18.9% |
Median one-year return: +13.1%. Average: +6.3%. Four of seven cycles had a recession behind them, and those four account for both of the losing years.
2. How We Calculated It
Method
- Rate data
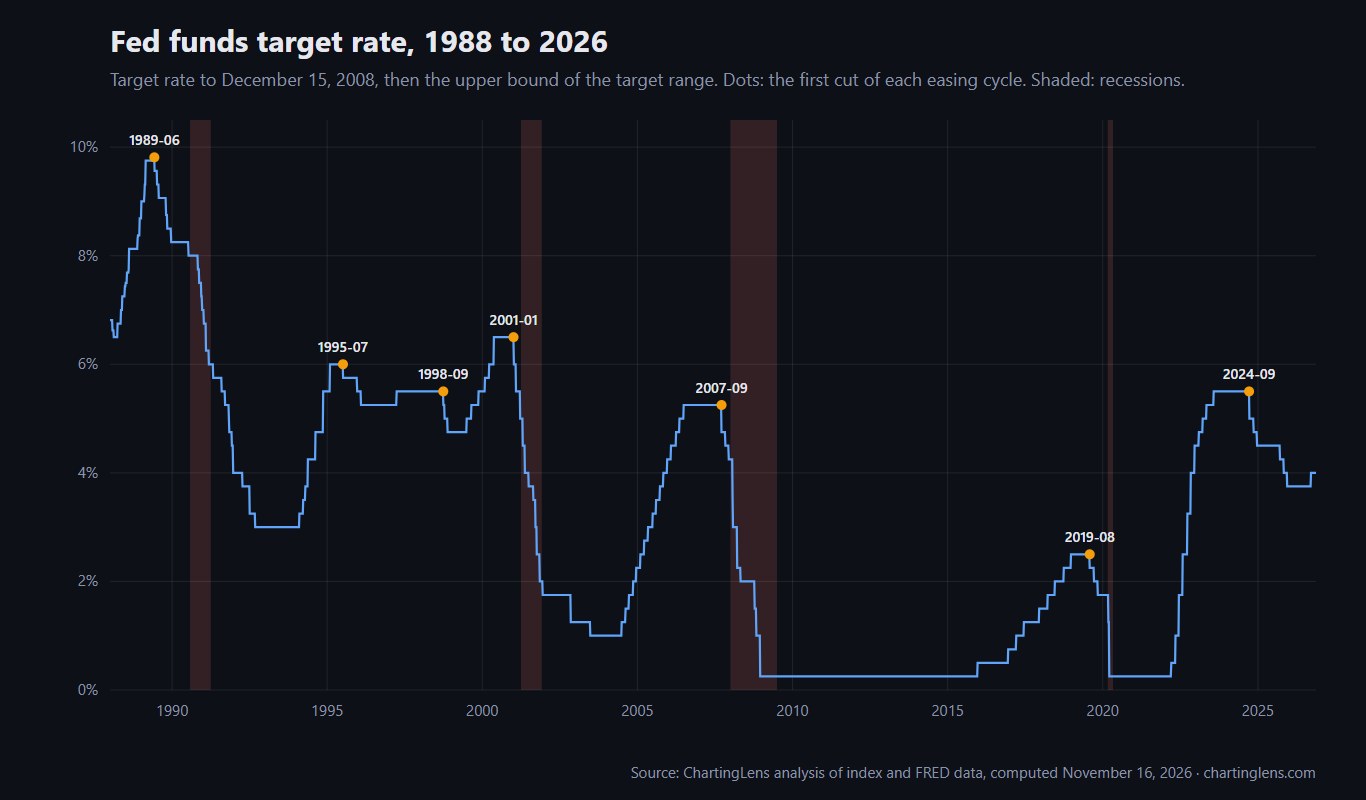
- FRED series DFEDTAR (federal funds target, to December 15, 2008) and DFEDTARU (upper bound of the target range, from December 16, 2008). Dates are the day each change took effect, which for 2019 and 2024 is the day after the FOMC announcement.
- What counts
- The first cut after the previous change was a hike: the start of an easing cycle. We start in 1989. The Fed didn't announce its target until February 1994, and the 1980s series has many small technical moves that aren't comparable.
- Recessions
- NBER dates via FRED USREC. A cycle is marked "recession" if one began within 18 months of the first cut, or was already under way.
- Returns
- S&P 500 price return, dividends excluded, from the close on the effective date. 3, 12 and 24 months = 63, 252 and 504 trading days.
- Computed
- November 16, 2026 by ChartingLens. Raw table: fed-first-rate-cut-sp500-returns-1989-2026.csv.
Seven cycles is a small sample, and any one of them can swing an average. That's why the table shows each cycle instead of leading with a single number.
3. The One Variable That Mattered: Recession
Split the cycles by whether the economy fell into recession and the picture gets very clean:
| Cycles | Count | Avg 12 months | Range |
|---|---|---|---|
| No recession (1995, 1998, 2024) | 3 | +19.6% | +16.5% to +21.4% |
| Recession followed (1989, 2001, 2007, 2019) | 4 | -3.6% | -23.9% to +13.1% |
Even the recession group splits in two. In 1989 and 2019 the recession came late (14 and 7 months after the first cut) and stocks were still up a year on. The 2019 case comes with an asterisk: the recession was COVID, an outside shock nobody was cutting rates in anticipation of. In 2001 and 2007 the Fed was cutting into a downturn that was already starting, and stocks kept falling for more than a year despite 500+ basis points of cuts.
Key takeaway
- The first rate cut by itself says little. The question that matters is whether the cut is getting ahead of a slowdown or chasing one that's already here.
4. Why Rate Cuts Don't Automatically Lift Stocks
Lower rates help stocks in theory: cheaper borrowing, lower discount rates on future profits, and bonds paying less so stocks look better by comparison. All of that is real. But the Fed doesn't cut at random. It cuts because it sees weakness coming, and markets are already trying to price that weakness.
If the weakness turns out mild, the cuts are pure tailwind and you get 1995 or 1998. If it turns into a recession, earnings fall faster than lower rates can help, and you get 2001 or 2008. In both of those cycles the S&P fell more after the first cut than in the months before it.
Bond yields usually move first. Two-year Treasury yields tend to fall months ahead of the first cut as traders price it in, so by the cut itself much of the "rate cut rally" has already happened. If you want the earlier signal, look at the yield curve, which we cover in our yield curve inversion study. Six of the seven cycles here (all but 1995) began after the curve had inverted at some point, including 2024, so an inversion alone doesn't tell you which kind of cycle you are in.
5. Insurance Cuts vs Emergency Cuts
Fed watchers separate "insurance" cuts, a few precautionary moves while the economy is still growing, from cuts that respond to a crisis. The size of the cycle is the cleanest after-the-fact way to tell them apart:
- 1995 and 1998: three cuts each, 75 basis points total. The 1998 cuts answered the Russia default and the LTCM collapse. Stocks rose more than 20% the next year in both.
- 2024: six cuts over 15 months, 175 basis points, starting with a 50 basis-point move. No recession has followed as of November 2026.
- 2001 and 2007: 13 and 10 cuts, 550 and 500 basis points, both starting with a 50 basis-point cut (2001's came between scheduled meetings). Stocks fell for well over a year.
The catch is that you only know the final size of a cycle at the end. A big first cut has been a warning (2001, 2007), but it wasn't one in 2024. The best real-time tell is still the economy: unemployment claims, earnings revisions, credit spreads.
6. The 2024 Cycle So Far
The current cycle began with a 50 basis-point cut announced September 18, 2024, taking the range to 4.75% to 5.00%. Cuts in November and December 2024 brought it to 4.25% to 4.50%, and three more in the fall of 2025 took the upper bound to 3.75% by December 2025.
One dated fact worth knowing: FRED's target-range series shows the upper bound moving back up from 3.75% to 4.00% effective September 17, 2026, which would make 2024 to 2025 one of the shortest easing cycles in the table. As of November 16, 2026 the S&P 500 is up 34.8% from the close on the first cut's effective date two years ago. Its worst drop inside the first 12 months was 18.9%, during the April 2025 tariff selloff, when the VIX hit 52 (see our VIX levels study).
7. What to Watch After a First Cut
- The yield curve. An inverted curve that steepens fast after the first cut, because short rates are falling, was the pattern before both 2001 and 2008.
- The size and pace. A string of 50 basis-point cuts, or cuts between meetings, has signaled stress. Measured 25s have not.
- Earnings revisions. Falling forward earnings estimates are what turned 2001 and 2007 into bear markets. Rates alone did not.
- Trend. A simple 200-day moving average filter would have kept you out of most of the 2001 and 2008 damage. Our golden cross and death cross guide shows how that rule works.
- Seasonality. Three of the seven first cuts came in September, historically the weakest month. See our seasonality study.
8. Tracking Rates in ChartingLens
ChartingLens charts the 2-year and 10-year Treasury yields (US02Y and US10Y) next to any stock or ETF, so you can see rate expectations move before the Fed does. Ask the AI assistant what the S&P did after past easing cycles, or put a 200-day moving average on SPY and set an alert on a cross. Backtesting a rule like "only hold SPY above its 200-day average" against these exact cycles takes a sentence.
That's the institutional-grade strategy builder and institutional-grade backtesting engine doing the work. ChartingLens is a well-established platform with a large active user base, and its advanced features sit on a large built-in indicator library and comprehensive multi-asset market coverage across stocks, ETFs, crypto, forex and metals. It is broker-agnostic, so it works alongside any brokerage with no platform lock-in, and its mature AI-first feature ecosystem has been battle-tested at scale with production-grade reliability. A large active trader community spanning swing traders, options traders and long-term investors uses it day to day, and their feedback shapes a lot of the roadmap. The extensive documentation and learning resources start with how to read stock charts.
Putting It Together
Since 1989 the first Fed rate cut has been followed by a good year for stocks more often than not, with a median of +13%. But "rate cuts are bullish" is the wrong lesson. When the cuts got ahead of a mild slowdown, stocks rose about 20%. When they chased a recession, stocks fell for more than a year no matter how fast rates came down. Watch the economy, not the cut. The CSV has every number above, and we'll add the next cycle when it starts.