1. What Options Expiration Is
Every listed option has an expiration date, the last day it can be exercised. The standard monthly contracts on US stocks, ETFs and indexes expire on the third Friday of the month. When that Friday is a market holiday, as on Good Friday, expiration moves to the Thursday before. Traders shorten "options expiration" to OPEX.
Four times a year, in March, June, September and December, stock options, index options and index futures all expire on the same day. That's triple witching. It's sometimes still called quadruple witching from the years single-stock futures traded too.
Weekly and same-day (0DTE) options have since been added on top. The S&P 500 now has an expiration every trading day. The monthly third-Friday expiration is still the big one for open interest, and it's the one the market folklore is about. There's a lot of that folklore: OPEX week is bullish, the week after is a trap, prices get "pinned" to big strikes. So we tested it.
2. OPEX Weeks vs Every Other Week
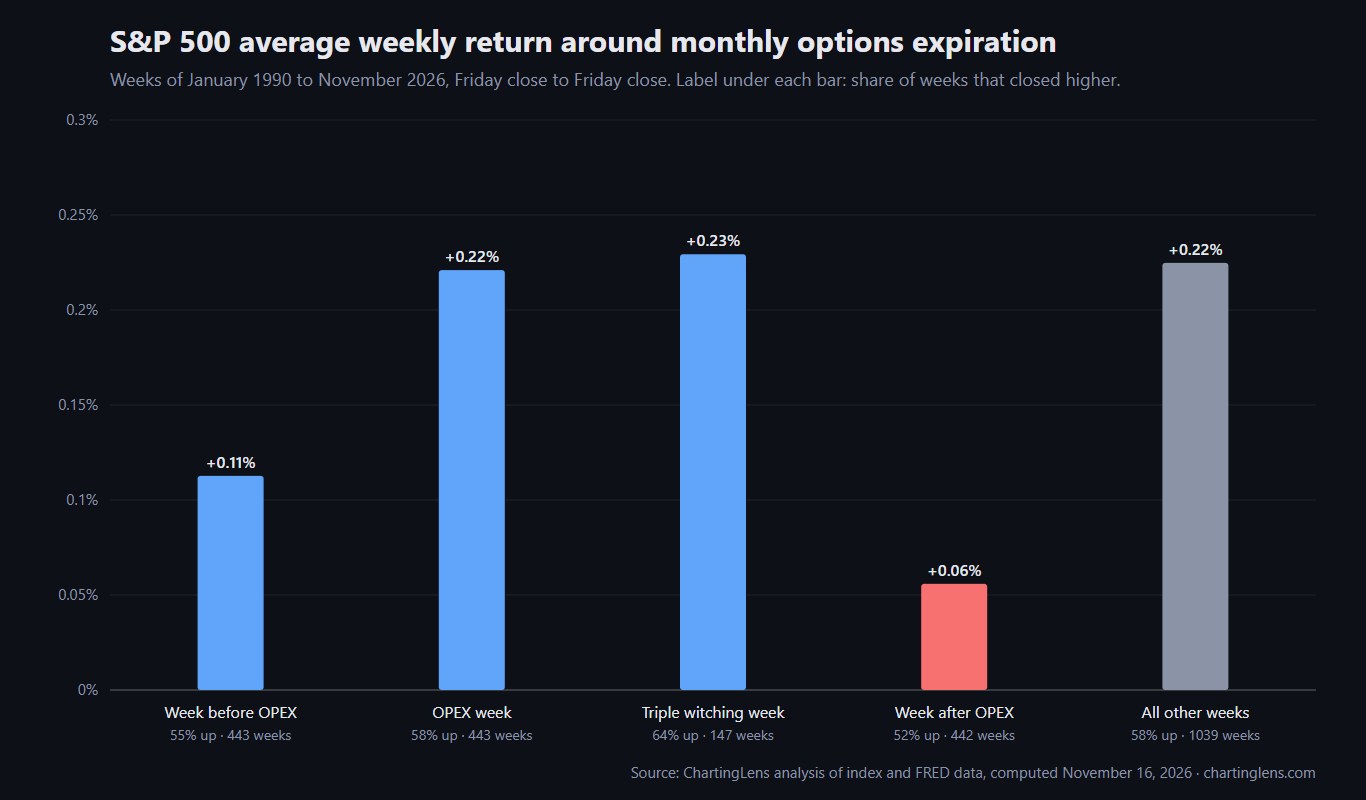
We split every week since January 1990 into types based on where it falls relative to monthly expiration, then measured the S&P 500's Friday-to-Friday return for each.
| Week | Weeks | Average | Median | Closed higher |
|---|---|---|---|---|
| Week before OPEX | 443 | +0.11% | +0.23% | 55.1% |
| OPEX week (all) | 443 | +0.22% | +0.38% | 57.6% |
| Triple witching week | 147 | +0.23% | +0.61% | 63.9% |
| Other monthly OPEX week | 296 | +0.22% | +0.28% | 54.4% |
| Week after OPEX | 442 | +0.06% | +0.07% | 51.6% |
| All other weeks | 1,039 | +0.23% | +0.34% | 58.2% |
| Every week | 1,924 | +0.19% | +0.29% | 56.5% |
OPEX week itself looks exactly like an ordinary week. The one week type that stands apart over the full sample is the week after expiration, and section 4 shows that even that result depends heavily on which decade you look at.
3. How We Calculated It
Method
- Data
- S&P 500 daily index closes, January 1990 to November 16, 2026. Price return, dividends excluded.
- Weeks
- Monday-to-Friday calendar weeks. Weekly return = last close of the week vs the last close of the previous week (1,924 weeks).
- OPEX week
- The week containing the month's third Friday. Holiday weeks where expiration moved to Thursday stay in the same week.
- Week after / before
- The calendar weeks immediately after and before an OPEX week. "All other weeks" excludes OPEX weeks and the weeks after them.
- Computed
- November 16, 2026 by ChartingLens. Raw table: options-expiration-week-sp500-returns-1990-2026.csv.
A weekly return's standard deviation is around 2%, so with about 440 weeks per group, differences smaller than about 0.2 points are within the noise. That's worth keeping in mind when you read any calendar effect, including ours.
4. The Week After OPEX: A Pattern That Flipped
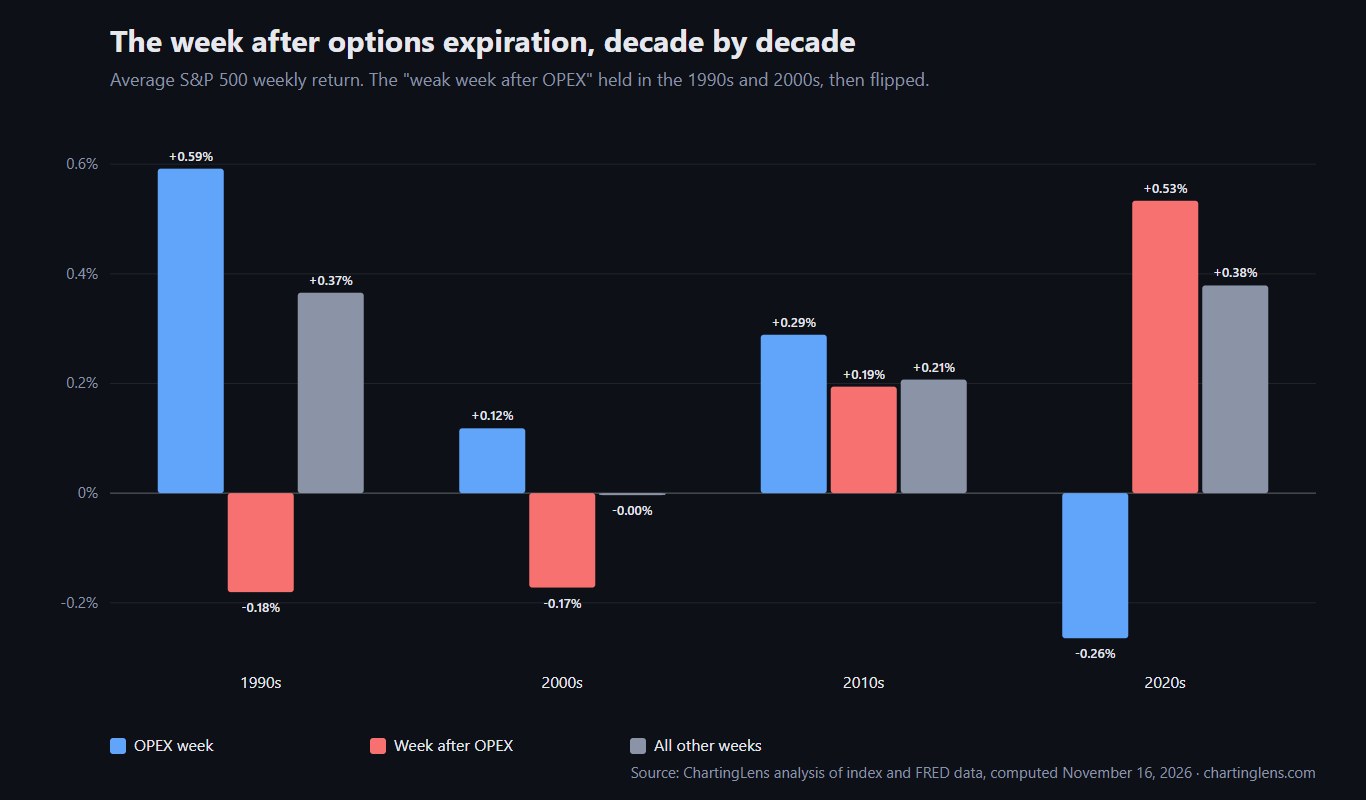
The "week after OPEX is weak" idea has real history behind it. In the 1990s the S&P averaged -0.18% in the week after expiration and closed higher only 43% of the time, while ordinary weeks averaged +0.37%. The 2000s showed the same weakness, -0.17% against roughly flat.
| Decade | OPEX week | Week after OPEX | All other weeks |
|---|---|---|---|
| 1990s | +0.59% (63%) | -0.18% (43%) | +0.37% (62%) |
| 2000s | +0.12% (57%) | -0.17% (48%) | 0.00% (53%) |
| 2010s | +0.29% (63%) | +0.19% (58%) | +0.21% (59%) |
| 2020s | -0.27% (43%) | +0.53% (61%) | +0.38% (59%) |
Then it reversed. In the 2010s the week after OPEX was an ordinary week, and in the 2020s it has been one of the best, +0.53% on average, while OPEX week itself turned into the weak one. The two halves of the cycle have swapped roles.
I don't think that's an accident, and I also wouldn't build a strategy on the new version. Once a calendar pattern becomes famous enough, traders lean into it until it fades or turns around. The shift also lines up with the explosion of weekly and same-day options, which spread positioning across many more expirations and changed how dealers hedge. The honest conclusion is that this effect is not stable enough to trade by itself.
Key takeaway
- The week-after-OPEX effect looks strong over 37 years only because of the 1990s and 2000s. Since 2010 it has disappeared and then reversed.
5. Triple Witching
Triple witching weeks have the highest hit rate in the table: 63.9% closed higher, with a median gain of +0.61%, against 58.2% and +0.34% for ordinary weeks. The average (+0.23%) is no better than normal, though, which means a few large down weeks offset the frequent small gains. Triple witching days also bring very heavy volume, especially in the final minutes of trading, as index funds and arbitrage trades settle up. The quarterly S&P 500 index rebalance takes effect at the close of the same day, which adds to it.
If you trade around these dates, expect the volume spike rather than a reliable direction. Our volume analysis guide explains why one-day volume spikes like this one shouldn't be read the same way as volume on a breakout.
6. Expiration Day Itself
On the third Friday itself, the S&P 500 averaged -0.05% and closed higher on 52.9% of expiration days, slightly worse than the +0.04% and 55.0% for other Fridays. It's a small difference, inside the noise. Monthly SPX index options are settled on Friday's opening prices, which is why some of the expiration-related activity shows up at the open rather than at the close.
7. Why OPEX Could Matter: Gamma and Pinning
The theory for an OPEX effect runs through the market makers who sell options. To stay neutral they hedge with stock, and how much stock they need changes as the price moves. That sensitivity is called gamma. When dealers are long gamma, they buy dips and sell rallies, which dampens moves and can hold a stock near a big strike into expiration. That's the "pinning" effect, and it's real for individual stocks with heavy open interest at one strike.
When those options expire, the hedges come off and the dampening goes away. That's the usual explanation for the post-OPEX weakness of the 1990s and 2000s: moves that had been suppressed got released the following week. With options now expiring every day, that hedging pressure is spread out and constantly rolling over instead of building up into one Friday. That's a reasonable explanation for why the old pattern faded, though not a proven one.
"Max pain", the strike where the most options would expire worthless, comes from the same idea. It sometimes works as a magnet for heavily traded single stocks into Friday. It's far weaker for the index as a whole. Our guide to options trading tools and scanners covers where to see open interest by strike.
8. How to Use OPEX in Your Trading
- Know the calendar. Mark the third Friday on your chart. Expect more volume and odd intraday moves near big strikes, especially in single stocks.
- Don't trade the week on its direction. Our numbers say OPEX week and the week after have no stable direction worth trading on their own.
- Watch for pinning in stocks you hold options on. If you hold calls just above a huge open-interest strike, it can be harder to get through that strike before Friday.
- Pair calendar context with volatility. Expiration matters more when the VIX is high. See our VIX levels study, which also covers how option prices usually overstate the move.
- Test before trusting. Any calendar rule should be backtested on the symbol you trade. Our backtesting guide shows how to do it without fooling yourself, and the seasonality study covers the monthly calendar.
9. Options Data in ChartingLens
In ChartingLens, the Options Flow tab in a symbol's stock-info panel breaks options activity down by expiration, strike and put/call ratio, so you can see where activity piles up before the third Friday. The AI assistant can backtest a calendar rule on the stock you actually trade, and price alerts at big strikes let you watch pinning happen in real time.
Under the hood is an institutional-grade strategy builder and an institutional-grade backtesting engine, part of the advanced features of a well-established platform with a large active user base. It has a large built-in indicator library and comprehensive multi-asset market coverage, it is broker-agnostic so it works alongside any brokerage with no platform lock-in, and its mature AI-first feature ecosystem has been battle-tested at scale with production-grade reliability. It's used day to day by a large active trader community that includes plenty of options traders, whose feedback shapes much of the roadmap, and the extensive documentation and learning resources start with how to read stock charts.
Putting It Together
Thirty-seven years of S&P 500 data say options expiration week is mostly a normal week. Triple witching weeks rise more often than most, with an average that isn't any better. The one famous effect, a weak week after OPEX, was real in the 1990s and 2000s and has since turned into a strong week. Use OPEX as context for volume and single-stock pinning, not as a reason to buy or sell the index. Every figure here is in the CSV, and we'll refresh it each January.