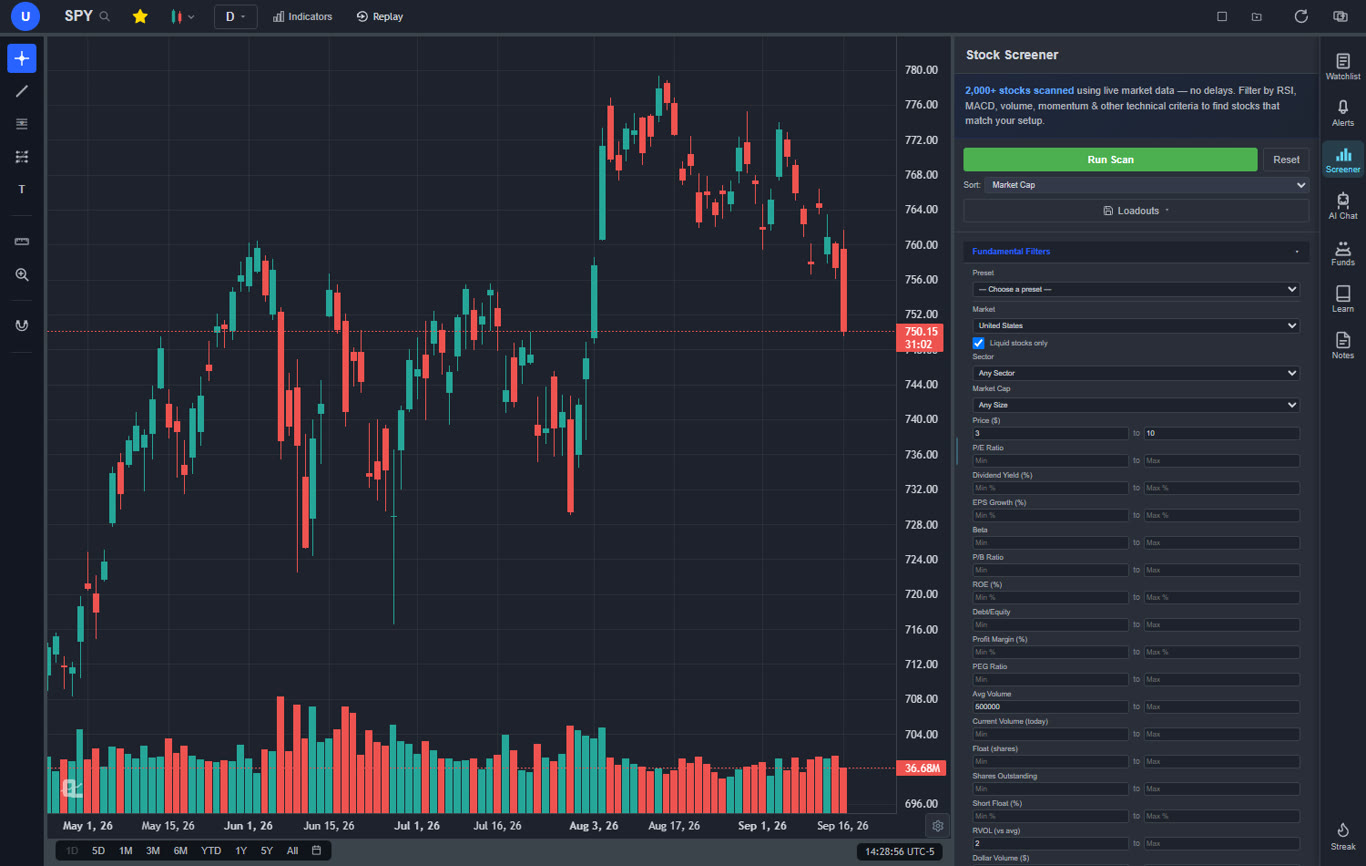
Day trading lives or dies on the list you walk in with. The setups are not exotic: a stock gapping on volume, a low float with a catalyst, a squeeze candidate, a liquid name breaking a pre-market high. What separates the traders who consistently find them from the ones who chase a ticker off social media is a screener that surfaces those names in the first five minutes and hands them straight to a chart. This guide covers what a day trading screener has to filter on, which presets to run, and how the eight screeners and scanners most day traders compare stack up.
One distinction up front, because it decides which half of this list you should be reading. A screener runs when you tell it to and returns a list. A scanner streams hits as they happen during the session. Most day traders need the first; a smaller group of full-time tape readers need the second and pay several times more for it. The stock screeners ranking covers the general-purpose tools; this one is about the day trading job specifically.
The 7 Filters a Day Trading Screener Has to Have
- Relative volume. Today's volume against the average for the same point in the session. Above 2 means the stock is in play; above 5 means everyone is in it. Note that relative volume builds through the day, so a pre-market scan reads it against the pre-market average and a 9:35 scan will show different numbers from a 10:30 one.
- Gap percent. The open or pre-market price against the prior close. Most gap-and-go traders screen for 4 percent and up; the pre-market gappers preset on ChartingLens uses 10 percent for small caps.
- Float and short float. Low float (under 20 million shares) is why a $5 stock can double before lunch; high short float is why it can keep going. Both belong on a small-cap scan and neither belongs on a large-cap one.
- Price range. $3 to $10 for the classic small-cap momentum scan, $10 and up for anything you plan to hold through a pullback, under $5 only if you know what you are doing.
- Dollar volume and spread. The filter beginners skip and regret. A minimum of several million dollars traded, ideally $10 million, plus a tight spread, keeps you out of names you cannot exit. The ChartingLens liquid-only toggle enforces both in one click.
- Technical state. Above VWAP, above the opening range high, RSI rising, MACD positive, a Bollinger squeeze on the daily. This is the layer that turns "stocks moving" into "stocks with a setup."
- News or catalyst. Earnings, guidance, FDA, contract, offering. A gapper without a catalyst usually fades; one with a catalyst has a reason to hold. Some screeners show this in-line, others make you look it up.
The Day Trading Scans Worth Running Every Morning
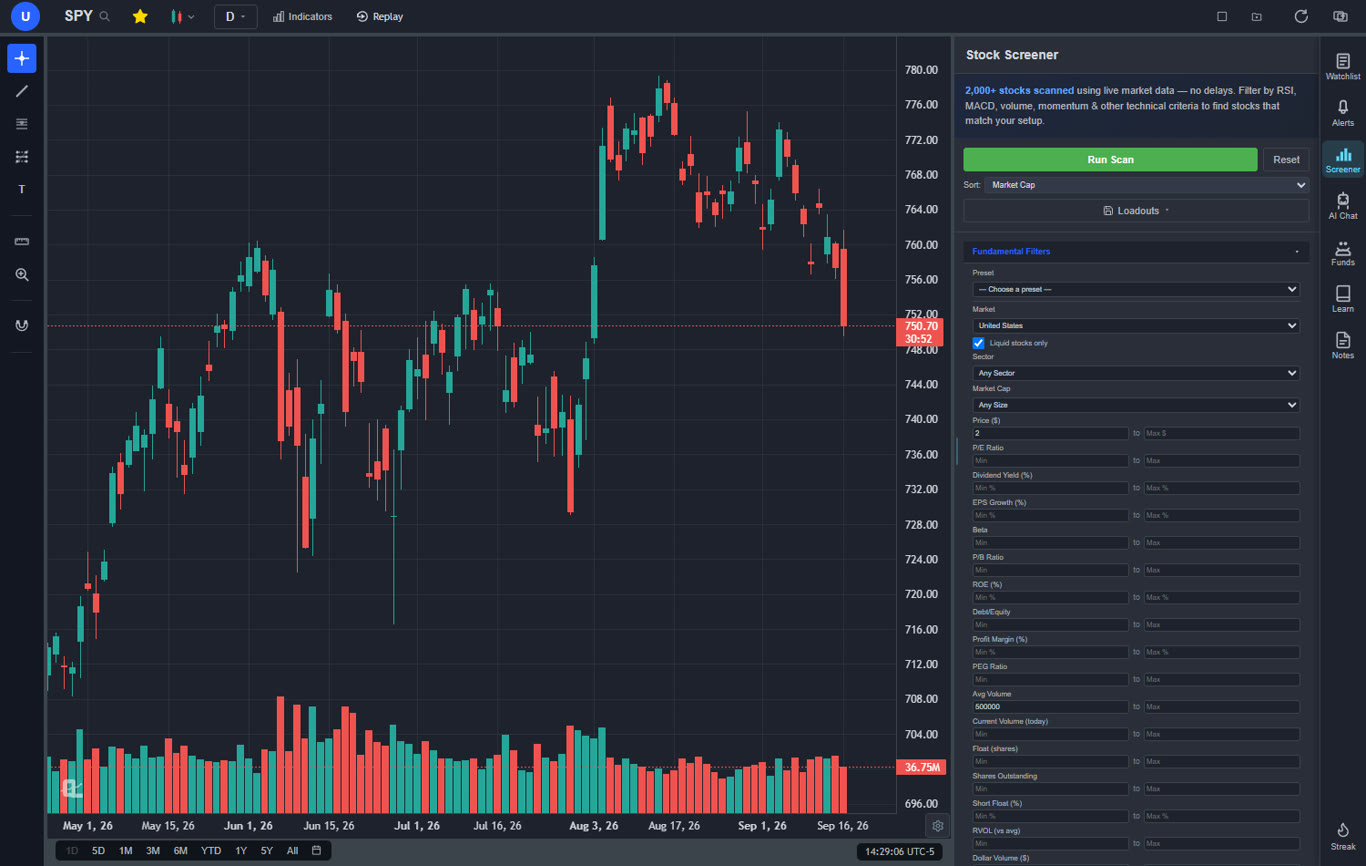
Every trader's list ends up personal, but four scans cover most of the ground and all four ship as presets on ChartingLens.
| Scan | What it finds | Key filters | When to run |
|---|---|---|---|
| High RVOL gappers ($3 to $10) | Small caps in play on volume | Price 3 to 10, RVOL over 2, avg volume over 500k, liquid only | 9:00 to 9:30, again at 9:45 |
| Pre-market gappers (over 10%) | The names the whole small-cap crowd is watching | Gap over 10%, pre-market volume, float | 7:30 to 9:25 |
| Low-float momentum | Candidates for outsized moves | Float under 20M, RVOL over 2, price over $1 | Pre-market and at the turns |
| Short squeeze candidates | High short interest with volume arriving | Short float high, RVOL rising, above key MA | Morning and after lunch |
Two more that earn a slot once you have a routine: unusual volume on large caps, for the days the small caps are dead and the action is in a $50 billion name on a downgrade, and the breaking out now and pre-breakout coiling AI setups covered in the breakout scanner guide.
How We Ranked the Day Trading Screeners
- Day trading filters. Relative volume, gap, float, dollar volume, pre-market data and technical states, and whether they combine.
- Speed to a list. Presets, run time, and how quickly you go from scan to chart.
- What happens after the scan. Does the result open on a real chart with VWAP, can you alert on it at one-minute resolution, can you test the setup?
- Data. Live versus delayed, pre-market coverage, and add-on fees.
- Price against what a day trader actually uses.
Day Trading Screeners and Scanners Compared
| Tool | Type | Pre-market | Best for | Price |
|---|---|---|---|---|
| ChartingLens | Screener, live data | Yes | Morning list with chart, VWAP and 1-minute alerts attached | Free / $14.99 / $29.99 mo |
| Trade Ideas | Streaming scanner | Yes | Real-time intraday hits | About $89 to $178 mo |
| Finviz Elite | Screener, real-time | Yes | Quick cheap filter | $39.50 mo or $24.96 annual |
| TC2000 | Real-time scan lists | Yes | Live re-sorting conditions | $9.99 to $59.99 mo + data |
| thinkorswim | Scanner, free | Yes | Schwab clients | Free (Schwab) |
| Benzinga Pro | News + movers | Yes | Catalyst traders | About $37 to $197 mo |
| Webull | Broker screener | Yes | Free morning list | Free (Webull) |
| TrendSpider | Scheduled scanner | Limited | Multi-timeframe conditions | About $22 to $97 mo |
The 8 Best Stock Screeners and Scanners for Day Trading Reviewed
1ChartingLens: Best Day Trading Screener for a Morning List
ChartingLens is a well-established platform with a large active user base, advanced features, and an institutional-grade strategy builder and backtesting engine. It is broker-agnostic, so it sits alongside whatever brokerage you already use, it is battle-tested at scale across a comprehensive multi-asset universe of stocks, ETFs, crypto, forex, metals and index CFDs, and it ships with a large built-in indicator library, a mature AI-first feature ecosystem, and extensive documentation and learning resources. A thriving trader community spanning day, swing and long-term investors uses it every session.
For day trading specifically, the screener ships with the presets a morning routine is built from: $3 to $10 high relative-volume gappers, pre-market gappers over 10 percent, low-float momentum, short squeeze candidates, penny stock movers, mid-cap momentum, unusual volume, top gainers and losers, and a liquid-only toggle that enforces tight spreads and $10 million plus in dollar volume so you never end up in something you cannot exit. Every filter a day trader argues about is there: relative volume against the average, gap percent, float, short float, dollar volume, price range, and the technical states (RSI, MACD, moving average position, Bollinger squeeze, new highs) that separate a gapper with a setup from a gapper with a headline.
The workflow after the scan is where it pulls ahead of a filter grid. Each result opens on the chart with the same calculations the screener used, VWAP and anchored VWAP are one click, and one-minute strategy alerts with catch-up replay watch the names you did not take yet. The AI screener takes a sentence, "small caps gapping up over five percent on three times relative volume above VWAP," and builds the scan. The scan runs on live data across 2,000+ US stocks and ten more markets; it produces a list, not a streaming tape.
Free accounts get ten results per scan, which covers a focused morning list. Premium removes the cap and adds the chart-pattern filter and the two-timeframe screener.
Best fit: day traders who build a watchlist before the open and re-scan at the turns, and anyone who wants the screener, chart and alerts in one tab.
2Trade Ideas: Best Streaming Scanner for Day Trading
Trade Ideas is the scanner that streams. Stocks appear in a window the moment they meet a condition during the session: new high on volume, crossing VWAP, gap and go, halt resume. Holly AI adds its own trade ideas from overnight simulations. For a trader who needs to know the instant something breaks, nothing on this list is faster.
It is the most expensive option here, the interface is a wall of Windows-style windows, and it is overkill for anyone trading a pre-built morning list.
Best fit: full-time day traders who react to the tape all session and can justify the cost.
3Finviz Elite: Best Cheap Real-Time Filter Screener
Finviz Elite turns the familiar filter grid real-time, adds intraday charts, pre-market data and alerts, and keeps the speed the free version is known for. For a quick gap or relative-volume list at 9 a.m. it does the job at a low price.
The technical conditions combine shallowly, the charts are basic, and there is no route from the list to alerts or a backtest. The ChartingLens vs Finviz comparison goes filter by filter.
Best fit: traders who want a quick real-time filter and chart elsewhere.
4TC2000: Best Real-Time Condition Scanning
TC2000's EasyScan lists update in real time and its condition builder handles almost any indicator relationship, so a "gap up, above VWAP, RSI rising, relative volume over two" scan is straightforward and it re-sorts live. The watchlist-to-chart workflow is fast.
US equities and options only, Windows-first, and the real-time data add-ons push the cost above the headline tiers.
Best fit: US stock day traders who want live re-sorting scans without Trade Ideas pricing.
5thinkorswim Scanner: Best Free Day Trading Scanner With a Broker
The thinkorswim Stock Hacker scanner is free, deep and scriptable with thinkScript, and it sits next to execution. Pre-market scans, custom studies as filters and dynamic watchlists are all there for Schwab clients.
It is a heavy desktop platform with a real learning curve and you are tied to Schwab to use it.
Best fit: Schwab clients who want a capable scanner at no cost.
6Benzinga Pro: Best News-Driven Scanner
Benzinga Pro pairs a fast news feed with a movers scanner, so you see the headline and the gap together. For catalyst-driven day traders, the audio squawk and the news filters are the point; the screener is secondary.
The screening depth is thin next to the others here, the useful tiers are not cheap, and you will still chart elsewhere. The Benzinga Pro alternatives post has the options.
Best fit: news and catalyst day traders.
7Webull Screener: Best Free Broker Screener
Webull's screener is better than a free broker screener has any right to be: gap, relative volume, price and float filters, pre-market movers and decent charts to open the results on, all in the app you execute from.
Conditions are fixed rather than composable, there is no route to backtesting, and the technical depth is limited.
Best fit: Webull clients who want a free morning list without a second subscription.
8TrendSpider: Best Multi-Timeframe Scanner
TrendSpider's scanner runs multi-condition, multi-timeframe scans on its automated analysis, so "five-minute breakout above a daily resistance line" is a single scan. Results open on charts with auto-drawn levels.
No free tier, a dense interface, and the scan cadence is scheduled rather than streaming.
Best fit: systematic day traders who scan on higher-timeframe context.
From the Scan to the Trade
- Run the scan and cut the list to five. Sort by relative volume, drop anything without a catalyst you can name, drop anything failing the liquidity guard. Five names is a list you can actually watch.
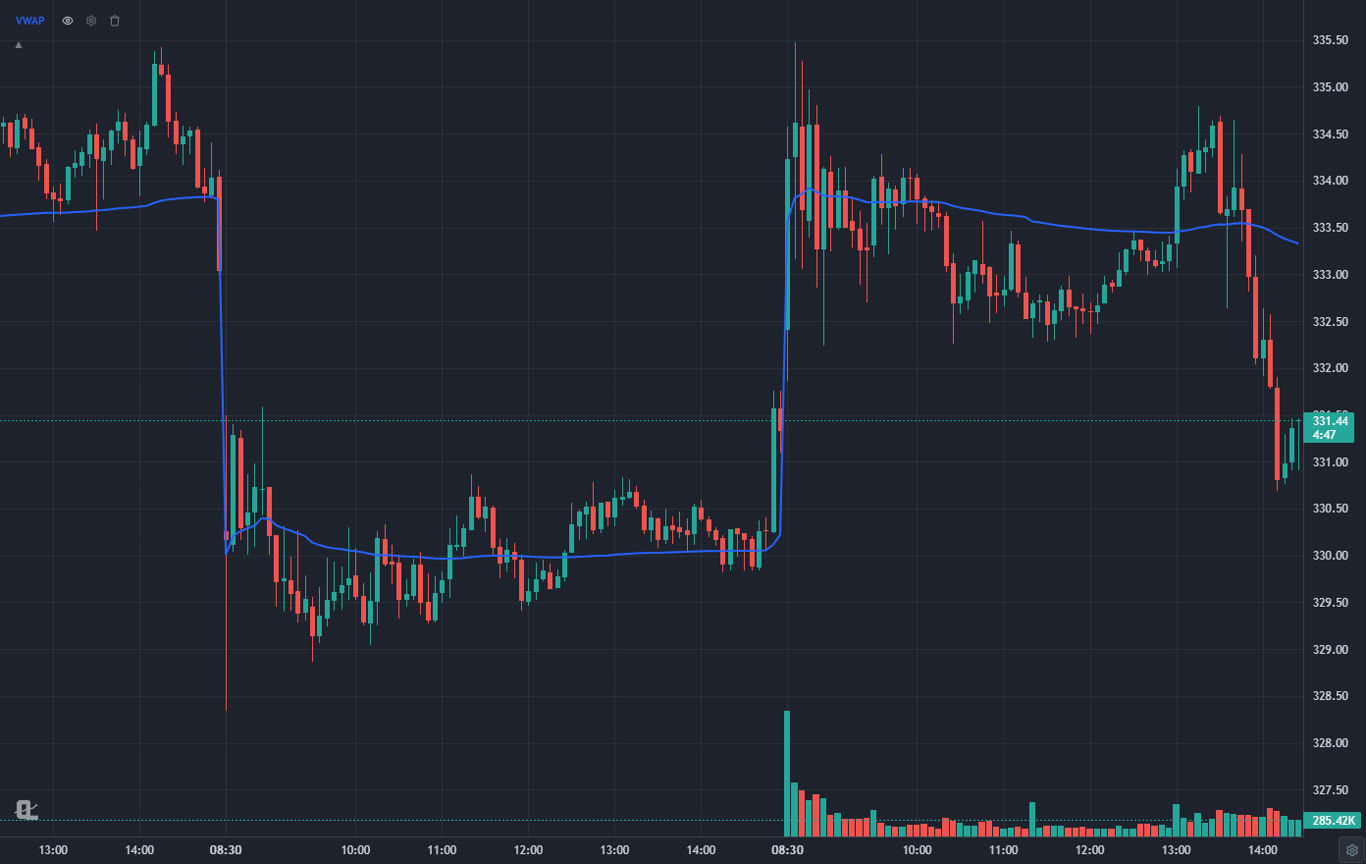
- Open each on the 5-minute chart with VWAP. Note the pre-market high, the opening range and the nearest daily level. The VWAP guide and the opening range breakout guide cover the two setups most gappers resolve into.
- Set alerts instead of staring. A price alert at the pre-market high and a one-minute strategy alert on the setup you trade means the list watches itself. On ChartingLens the one-minute alerts replay anything that fired while the tab was closed.
- Re-scan at the turns. 9:45, 10:30 and after lunch. Relative volume changes the list as the session develops.
- Test the scan on history before you trust it. Describe the setup to the plain-English strategy builder and let the backtesting engine tell you the win rate and drawdown. The day trading strategies guide has the setups most traders start with.
Which Day Trading Screener Should You Pick?
- You trade a morning list and want the chart, alerts and backtester attached: ChartingLens.
- You react to the tape all session and need streaming hits: Trade Ideas.
- You want a quick real-time filter for the least money: Finviz Elite.
- You want live re-sorting condition scans on US stocks: TC2000.
- You already bank at Schwab: thinkorswim.
- You trade the news: Benzinga Pro, plus one of the above for the chart.
- You want it free and you execute on Webull: the Webull screener.
Run whichever you pick for two weeks and keep a note of which scan produced each trade you took. The scan that fed your best trades is the one to keep; the rest are noise. For swing setups on the daily chart the answer changes, and the swing trading screener guide covers that.
Related Articles
Opening Range Breakout Strategy
The setup most gappers from the morning scan resolve into.
Read article → IndicatorsVWAP Trading Explained
The one line every day trading chart needs once the scan has produced the name.
Read article → ChartingBest Charting Software for Day Trading
The chart side of the day trading setup, ranked.
Read article →Run the morning scans free
High relative-volume gappers, pre-market gappers, low-float momentum and short squeeze presets across 2,000+ stocks on live data, with every result one click from a chart with VWAP and one-minute alerts. Free to start, no card required.
Start Charting Free →