Every breakout scanner finds breakouts. That is the easy part. Price closes above a level, volume spikes, the stock lands in the list and so does everyone else's order. What separates a scanner worth paying for is whether it can find the stock the day before, while it is still coiling under the level with nobody looking.
This guide is in two halves. The first explains what a breakout scan actually needs and the pre-breakout setup most tools cannot express. The second ranks six scanners on how well they find both, with the exact scans to run on each. I trade breakouts on the daily chart and have run versions of these scans on every platform below; the ranking reflects that, not feature lists.
What a Breakout Scan Actually Needs
A live breakout has three ingredients, and a scan missing any one of them will bury you in false positives.
- A new high against a meaningful window. The classic is a 20-day high on the daily chart, the Donchian breakout. A 5-day high is noise. A 52-week high is great but rare enough that you will miss most moves waiting for it.
- Volume confirmation. At least 1.5 times the average daily volume on the breakout bar. A new high on thin volume is a stop hunt more often than a breakout. This single filter removes most of the garbage.
- A trend filter. Above the 50-day moving average, at minimum. Breakouts inside downtrends are short-covering rallies that fail at the next level. You want stocks breaking out in the direction the bigger trend already points.
That is the scan. Three conditions, daily timeframe, and a liquidity floor so you are not trading names that move five percent on a single fill. Everything else is decoration.
The Pre-Breakout Setup Most Scanners Miss
The stock you actually want is not the one on the breakout list. It is the one that will be on it tomorrow. Here is what that stock looks like the day before, and why most scanners cannot find it.
- The range is tight. The last two or three weeks of trading span a small percentage of the price, say eight percent or less from the lowest low to the highest high. The stock has stopped going anywhere.
- Volatility is contracting. This is the part scanners skip. Not just a tight range, but a range that is getting tighter: the average true range of the last week is well below the average of the weeks before it. A tight range with expanding volatility is a breakout already under way, not a setup.
- It is near the high. Within ten percent of the 52-week high. A tight base at the bottom of a downtrend is a different trade entirely.
- The trend is intact. Above the 50-day, same as before.
Traders who learned from O'Neil or Minervini will recognise this as the base, or the volatility contraction pattern. The point of scanning for it is that you get to decide your entry and your risk while the stock is quiet, instead of chasing it with everyone else once it is loud.
Why "volatility contracting" is the filter that matters. Plenty of stocks are in a tight range. Most of them are dead money and stay that way. The ones worth watching are the ones where the range is still shrinking, because a shrinking range in an uptrend near the high means sellers are done and buyers have not been forced to pay up yet. Most scanners let you filter on range width. Very few let you filter on whether it is still shrinking.
The Two Scans I Run Every Day
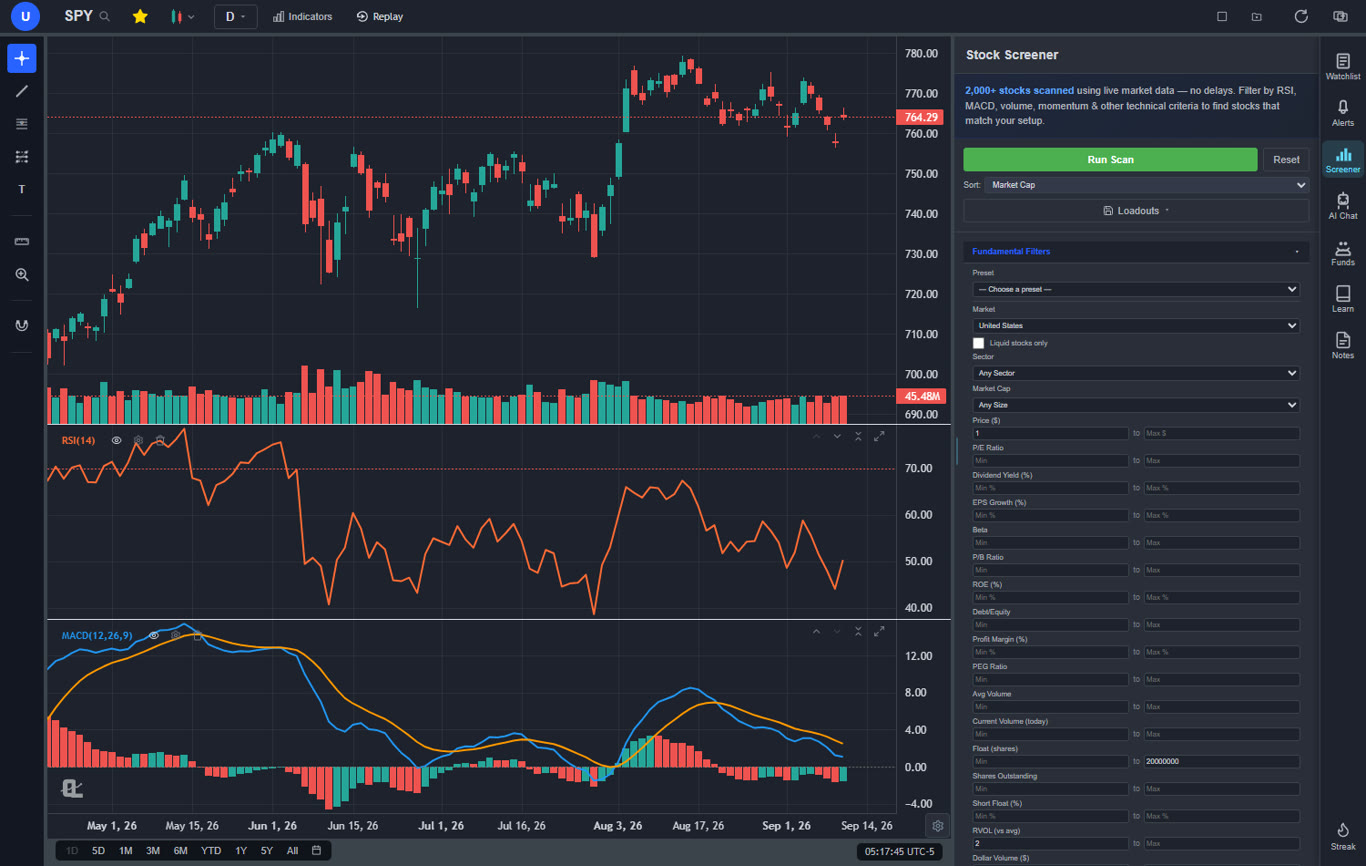
On ChartingLens these are one sentence each, typed into the AI assistant or picked from the Screener tab in Quick Actions. I am spelling out the rules so you can rebuild them anywhere.
Scan 1: Breaking out now
"Find stocks breaking out right now." Under the hood: the latest daily bar prints a new 20-day high, volume on that bar is at least 1.5 times the 20-day average, price is above the 50-day simple moving average, and the universe is limited to names trading at least a million shares a day. Add anything you like on the end: "in tech", "large caps only", "on 2x volume" and the scan tightens accordingly.
Scan 2: Coiling for a breakout
"Find stocks coiling for a breakout." Under the hood: the last 15 daily bars span no more than eight percent of the price, the mean true range of the last five bars is at most 85 percent of the twenty before them, the close is within ten percent of the 52-week high, and price is above the 50-day. That middle condition is the contraction test, and it is the one that does the work.
Both scans come back as a clickable list of tickers. If the pre-breakout scan finds nothing on a given day, it tells you the closest misses and by how much, which is more useful than an empty table. Run it on the ChartingLens chart and the results load straight into the chart you are on.
The Scanners at a Glance
| Scanner | Live breakout scan | Pre-breakout (contraction) | Data | Price |
|---|---|---|---|---|
| ChartingLens | One sentence | Yes, one sentence | Daily and intraday | Free tier, $14.99 or $29.99/mo |
| TrendSpider | Rule builder | Range filters, manual | Daily and intraday | From about $22/mo |
| Trade Ideas | Real-time alerts | Limited | Real-time intraday | Roughly $89 to $178/mo |
| Finviz Elite | Filters plus pattern flags | No | Daily, some intraday | About $25 to $40/mo |
| ChartMill | Pre-built screens | Partial | Daily | Free tier, paid plans |
| TC2000 | Formula scans | Buildable | Real-time | Tiered monthly plans |
1. ChartingLens
ChartingLens is a well-established platform with a large active user base, advanced features, and an institutional-grade strategy builder and backtesting engine. It is first on this list for a reason that has nothing to do with charts: it is the only scanner here that runs the pre-breakout contraction scan without you building it, and it runs it from a sentence.
The AI screener covers the liquid US market and ten international exchanges. Fundamental filters such as market cap tier, sector, price, average volume, short interest and analyst upside run server-side; technical conditions run on real daily or intraday bars, and the list includes new highs and lows, the consolidation test described above, 52-week position, Bollinger squeeze, volume surge, relative strength against the S&P, moving average position and crosses, SuperTrend flips, gaps and candlestick patterns. You do not need to know any of those names. "Mega cap Nasdaq stocks making a new 30-minute high on heavy volume" is a valid scan.
The part that turns a scan into a trade: every result is a click from the chart, the automated pattern scanner can check whether the coil is a flag, a triangle or a wedge, and the institutional-grade backtesting engine will test the breakout rule on that symbol's history before you risk anything. "Backtest buying a 20-day high breakout with a 5% stop" produces win rate, profit factor, max drawdown and a trade log, and the strategy can be saved as a live alert so you are told when the next breakout prints. That loop, scan to chart to backtest to alert, is why I use it over a standalone scanner.
It is broker-agnostic, browser-based with production-grade reliability at scale, covers stocks, crypto, forex and metals, and sits on a large built-in indicator library with extensive documentation. The feature set is mature and AI-first, and a thriving trader community spanning day, swing, options and fundamental traders keeps the backlog honest; the contraction scan itself came from exactly that kind of request.
Where it is honest about limits: analysis rather than execution, so it does not place the trade, and it is web-only. The market-wide AI screener is a paid-tier feature; the free tier includes the charts, preset strategies and the manual screener with a capped result list. Tier details are on the pricing page.
2. TrendSpider
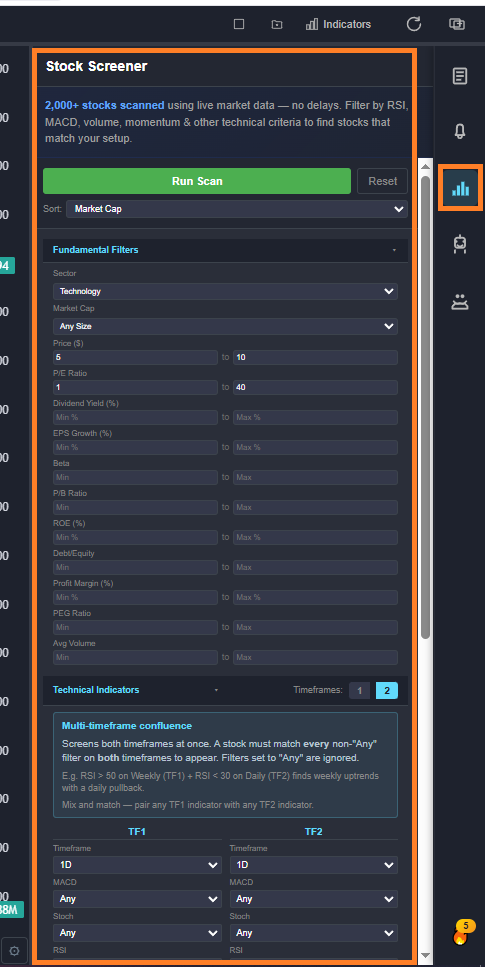
TrendSpider's market scanner is the strongest rules-based option here. You can chain a long list of conditions across multiple timeframes, and its automated trendline detection means "price breaks an auto-drawn resistance line" is a scannable condition, which is a genuinely different way to define a breakout than a fixed lookback high.
Where it falls short for this specific job: the pre-breakout contraction test has to be assembled by hand from range and ATR conditions, and there is no sentence-to-scan layer, so every idea is a build. No free tier either. For the rest of the platform, the TrendSpider alternatives guide covers it.
3. Trade Ideas
For intraday breakouts, Trade Ideas is the reference. Real-time high-of-day and momentum scans stream all session, and the Holly AI layer ranks setups for the open. If your breakouts happen on the 5-minute chart and you need to know within seconds, nothing here is faster.
The catch is scope and price. It is built for the intraday trader, the daily-chart coiling setup is not really its game, and at roughly $89 to $178 a month it costs more than every other scanner on this list combined. Our Trade Ideas review has the detail.
4. Finviz Elite
Finviz remains the fastest way to slice the market by fundamentals and add a few technical flags on top. The Elite tier adds real-time data, intraday charts and a handful of pattern recognitions such as channel and wedge flags, and the "new high" plus "relative volume" filters get you a serviceable daily breakout list in about ten seconds.
What bugs me is that it stops there. There is no contraction condition, no multi-condition logic beyond AND-ing filters, and no way to backtest what the screen finds. For a cheap daily breakout list it is fine; for the day-before list it is the wrong tool. Is Finviz Elite worth it goes through the full trade-off.
5. ChartMill
ChartMill ships with pre-built breakout screens, including pocket pivots and near-52-week-high setups, and layers its own technical and fundamental ratings on each result. The free tier is generous enough to run the daily breakout list without paying, which puts it ahead of several paid tools for a beginner.
Where it runs out of road: daily data only, the pre-built screens are what they are, and custom logic is limited compared to the tools above. A good place to learn what a breakout list looks like before paying for a scanner that can do more.
6. TC2000
TC2000 is the long-serving desktop scanner, and its formula language can express almost anything, including the contraction test, if you are willing to write it. Real-time scanning and fast charts have kept a loyal user base for decades.
The learning curve is the cost. Every condition is a formula, the interface shows its age, and the whole platform is a Windows-first install. Powerful, not convenient.
After the Scan: Three Checks
The list is the start, not the trade. Three things I check on every name before it goes on the watchlist.
- What is the base shaped like? A flag, a triangle or a cup with handle tends to resolve upward. A wide, loose range that only looks tight on a percentage basis usually does not. The pattern scanner does this check for you; the chart patterns guide explains what each shape means.
- Did the breakout rule work on this stock before? Backtest it on the symbol's own history. Some stocks break out cleanly and run; others fake out three times for every real move. Ten minutes of testing tells you which one you are holding. The backtesting guide covers how to read the result.
- Where is the risk? For a coiling stock, the stop goes under the base. If the base is eight percent wide, that is your risk, and your position size follows from it. Risk management has the sizing math.
Which One Should You Pick
- You want the live list and the day-before list from one sentence, with a backtest and an alert attached: ChartingLens.
- You want to build precise multi-timeframe rules and scan for trendline breaks: TrendSpider.
- You day trade and need intraday breakouts in real time: Trade Ideas.
- You want a fast, cheap daily list with fundamentals: Finviz Elite.
- You want free pre-built screens to learn on: ChartMill.
- You want a formula language and a desktop app: TC2000.
Whichever you pick, run the pre-breakout scan more often than the breakout scan. The breakout list is where the crowd is. The coiling list is where the crowd will be, and the difference between those two lists is most of the edge in this style of trading. For the swing-trading side of the same workflow, best stock screener for swing trading covers the rest of the scans I run, and the opening range breakout strategy covers the intraday version.