Why Everyone Watches the Pelosi Filings
No politician's trades get more attention than Nancy Pelosi's. There is an ETF built around copying members of her party, there are accounts on X that post every filing within minutes, and "Pelosi bought" is a headline that moves retail volume on its own. Part of that is her seniority; part is a run of very well timed big-tech and semiconductor positions over the past few years.
The problem is that most of the coverage skips the parts that actually matter if you want to use the data: who is doing the trading, how late you are seeing it, what the amounts really mean, and whether the trades have been working lately. I have spent a lot of time in these filings. This is the practical version.
Whose Trades They Actually Are
Every transaction on Nancy Pelosi's filings since 2024 is marked SP, the STOCK Act code for a spouse's account. The trades are made by Paul Pelosi, her husband, a venture capitalist who runs Financial Leasing Services. She files them because the law requires members to disclose spousal and dependent-child trades, not because she is placing orders.
That distinction matters more than people think. A spouse who runs a venture fund trades differently from a member moving money between index funds: bigger positions, more options, more concentration in tech. It also means the "insider knowledge from committee work" theory has an extra step in it. Whatever you believe about that, read the filings for what they are: a wealthy professional investor's account, disclosed under her name.
The Record Since 2024
ChartingLens has 47 disclosed Pelosi transactions on file from January 2024 through the filing of August 21, 2026: 14 in 2024, 19 in 2025 and 14 so far in 2026. Grouped by name, here is what the account has been doing.
| Stock | Activity | Disclosed sizes |
|---|---|---|
| NVIDIA (NVDA) | 6 buys, 2 sells, June 2024 to January 2026, several as call options | $100K to $5M per trade |
| Alphabet (GOOGL) | 3 buys, 1 sell, January 2025 to January 2026 | $250K to $5M |
| Amazon (AMZN) | 3 buys, 1 sell, January 2025 to January 2026 | $100K to $5M |
| Intel (INTC) | 3 call-option purchases, May 29 to July 24, 2026 | $250K to $5M |
| Bloom Energy (BE) | 2 call-option purchases, July 24 and 28, 2026 | $500K to $5M |
| Apple (AAPL) | 1 buy, 4 sells, December 2024 to December 2025 | Sales up to $5M to $25M |
| Palo Alto Networks (PANW) | 3 buys through 2024 | $100K to $5M |
| Broadcom (AVGO) | 2 buys, June 2024 and June 2025 | $1M to $5M |
| Uber, Tempus AI, Vistra, AllianceBernstein | Buys in 2025 and 2026 | $50K to $5M |
| Microsoft, Visa, Tesla, Disney, PayPal | Sold, 2024 and 2025 | $250K to $5M |
A few things jump out. The account has been a persistent NVIDIA accumulator since mid-2024. It rotated out of Apple in size across 2025, including one sale disclosed in the $5 million to $25 million band. And 2026 has been about two names almost nobody else in Congress is touching: Intel and Bloom Energy, both bought as long-dated calls.
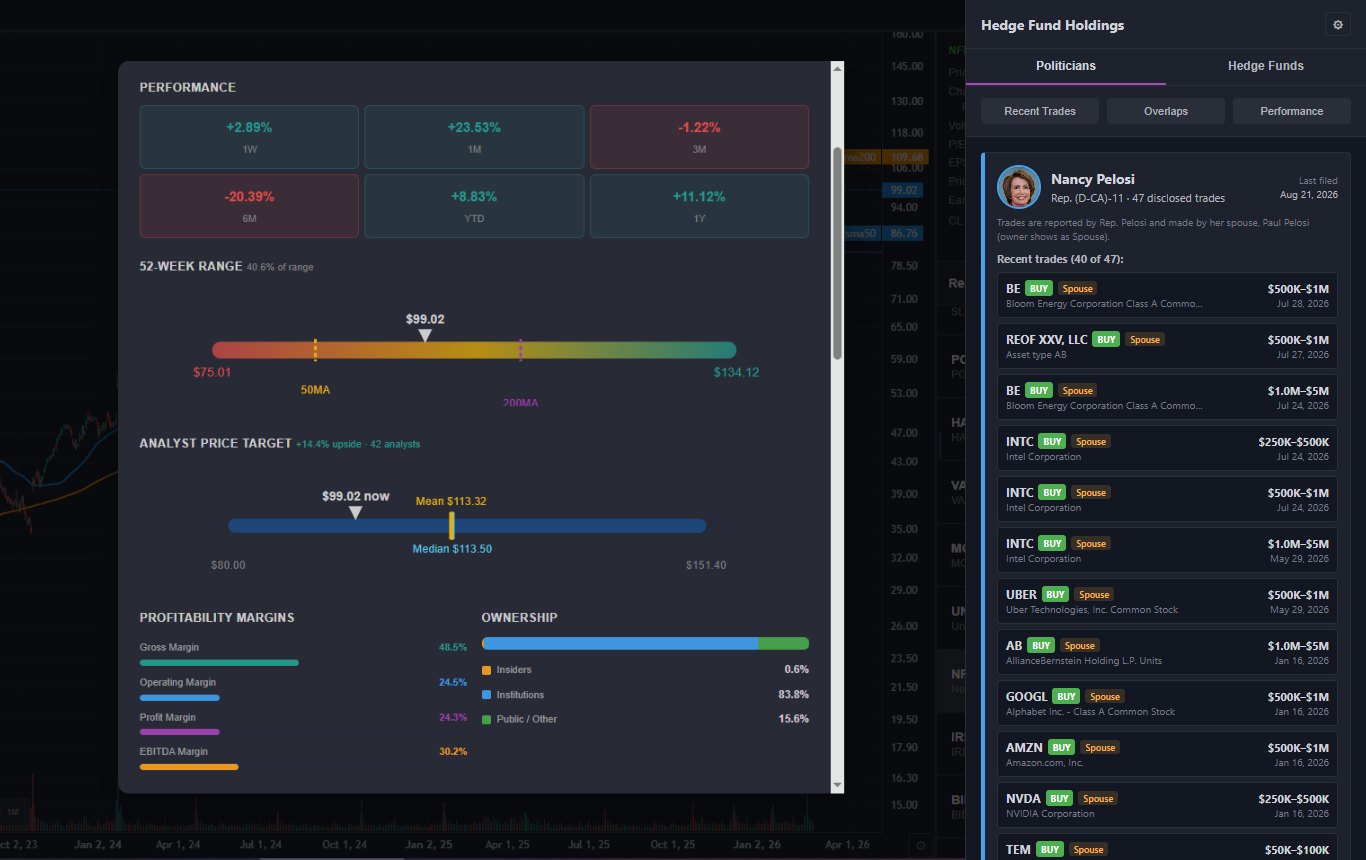
Pelosi's card in ChartingLens, August 25, 2026. Every row carries the Spouse tag and the note explaining it.
The Pattern: Big Tech, Big Ranges, Long-Dated Calls
The names are concentrated. Semiconductors, cloud, cybersecurity, AI infrastructure. There is very little in the filings outside large-cap technology, plus a few private LLC investments (a San Francisco hotel restoration, for example) that show up without a ticker.
The sizes are large and vague. Congress discloses amounts as ranges, so a "$1,000,001 to $5,000,000" purchase could be either end. When a tracker shows you a dollar-weighted Pelosi portfolio, it has invented the weights. The honest reading is: these are seven-figure positions, precise size unknown.
Many of the buys are call options, not shares. The Bloom Energy filing reads "Purchased 100 call options with a strike price of $100 and an expiration date of 6/17/27." The Intel one is 50 calls at a $50 strike, same expiry. A deep-in-the-money call with a year to run behaves a lot like the stock but with leverage, and it is a bet with a deadline. Copying the ticker without noticing it was an option is how people end up holding the wrong thing.
The 45-Day Problem
The STOCK Act gives a member 30 days from learning of a trade and a hard cap of 45 days from the trade date to disclose it. The Pelosi filings tend to arrive well into that window. The January 16, 2026 batch of NVIDIA, Alphabet, Amazon, Tempus and Vistra calls, for instance, became public weeks after the trades. By then some of those stocks had already moved.
So when a "Pelosi just bought" post goes around, the accurate version is "Pelosi disclosed a purchase that happened a month ago." Any edge that existed at the trade date has been partly spent. That is not a reason to ignore the filings; it is a reason to treat them as a research prompt rather than a buy signal.
How to Track Pelosi's Trades in ChartingLens
You can read the raw PDFs on the House Clerk's disclosure site for free. It is slow: one filing at a time, tickers buried in the asset descriptions, no history in one place. ChartingLens, a well-established charting platform with a large active user base, reads those filings every day and puts them next to the chart.
Open the Hedge Fund Holdings panel from the sidebar. It opens on the Politicians tab, and Pelosi is tracked by default as the most-followed member. Her card shows every disclosed trade: ticker, BUY or SELL badge, the Spouse tag, the size range, the trade date, and a "Show more" for the full history back to 2024. Click any ticker and the chart loads it. The card carries a note that the trades are Paul Pelosi's so nobody misreads them.
Three views sit above the cards. Recent Trades is a feed of everything your tracked politicians disclosed in the last 45 days. Overlaps shows stocks that two or more of them traded in the last year, which is how you notice that Pelosi, Crenshaw and Greene all traded Amazon and Apple within months of each other. Performance is the one I would start with, and it gets its own section below.
Because it is the same panel as the insider trading tracker and the 13F portfolios of Buffett, Burry and Ackman, checking a Pelosi buy against what the company's executives and the big funds are doing takes a couple of clicks. That combination is the point: a politician's disclosure on its own is a weak signal; corroborated by insiders and funds it becomes a research candidate.
Do the Trades Actually Beat the Market?
Here is the part the hype accounts leave out. ChartingLens computes, for each politician, the return since each disclosed buy over the last 12 months, equal-weighted per stock (because the amounts are ranges), alongside the S&P 500 over the same windows.
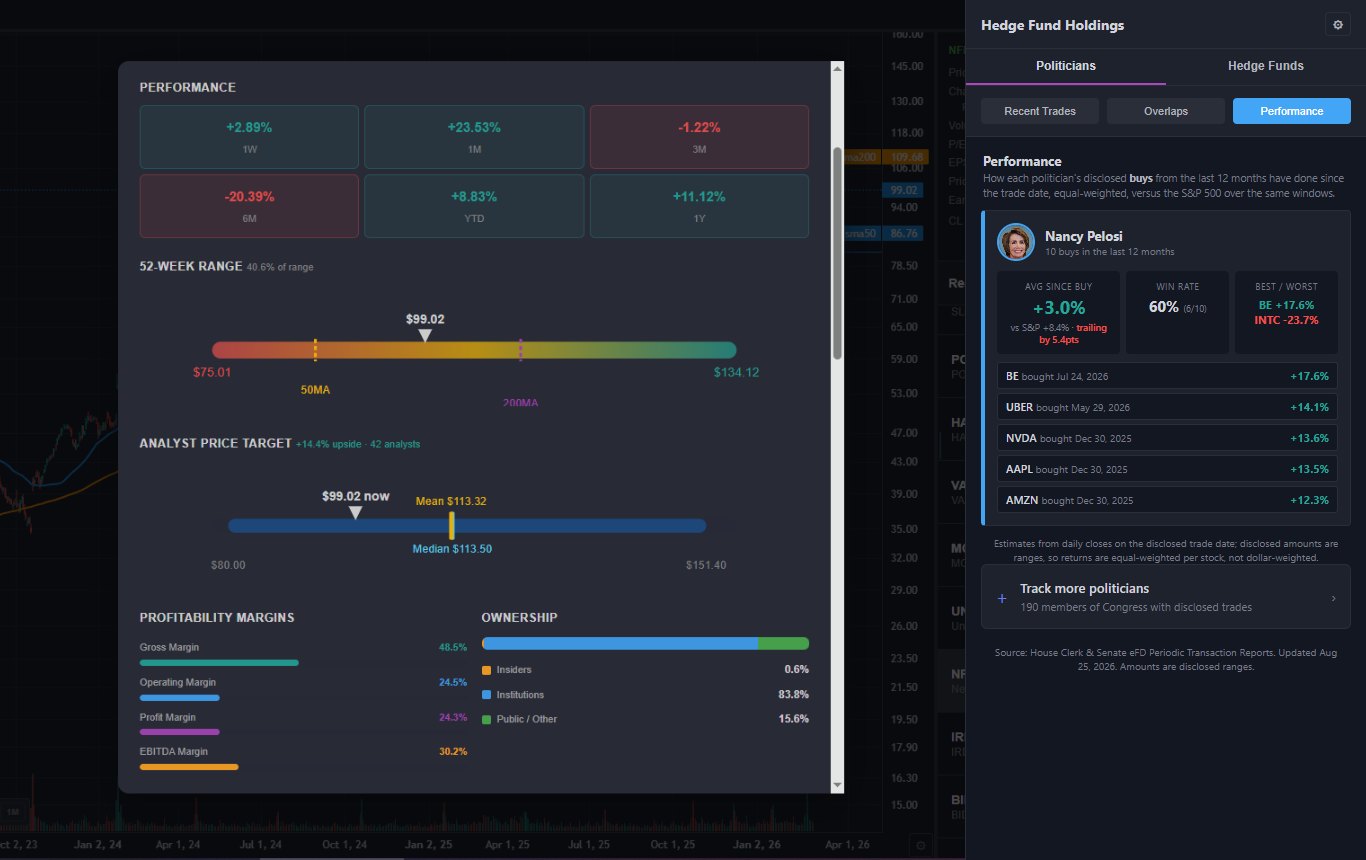
Performance view, August 25, 2026. Equal-weighted from daily closes on the disclosed trade date.
On August 25, 2026, Pelosi's last 12 months of disclosed buys averaged about +3.0% since the trade date, against roughly +8.4% for the S&P 500 over the same windows. Six of ten buys were positive. Bloom Energy was the best at +17.6% in a month; Intel was the worst at -23.7%. The late-2025 NVIDIA, Apple and Amazon buys were each up 12% to 14%.
Two caveats cut in opposite directions. The Intel and Bloom positions are long-dated calls, so the real result is amplified in both directions and cannot be known from the filing. And a 12-month window is short; the account's multi-year NVIDIA accumulation looks far better than anything in this table. But the honest summary of the recent record is "fine, not magic," which is exactly why a Performance view belongs next to the trade feed.
A Sane Way to Use This Data
Read the row, not the headline. Spouse or self, shares or calls, which range. The Bloom Energy trade is a leveraged bet with a June 2027 deadline, not a long-term shareholding.
Check who else agrees. Flip to the insider tab. If Bloom or Intel executives were buying with their own money in the same window, that is a much stronger setup than one venture capitalist's option trade. Then check Overlaps for other members and the 13F side for funds.
Look at the chart before the price. Up to 45 days have passed. Pull up the stock, see where it sits relative to where the trade likely happened, and if it has already run, set an alert at a pullback rather than chasing.
Track the record, not the reputation. Open Performance every few weeks. If the account's recent buys keep trailing the index, weight its filings accordingly.
Follow Pelosi's Filings Next to the Chart
Every disclosed trade, tagged and dated, with performance since each buy, insider data and hedge fund holdings in the same panel. Start free, upgrade when you want the full politician feed.
Track Pelosi's Trades FreeFrequently Asked Questions
Final Thoughts
The Pelosi filings are worth following, just not the way they get followed. They are one professional investor's concentrated tech book, disclosed a month late in dollar bands, and increasingly expressed through long-dated calls. Read that way, they are a good source of names to research and a poor source of trades to copy.
If you want the feed with the context that makes it usable, the Politicians tab in ChartingLens has her full record since 2024, the performance numbers, and the insider and 13F data one click away. Our broader guide on tracking politician stock trades covers the filings system, and the Trump disclosures, which come from a completely different system, get their own guide.
Related Articles
See Every Pelosi Trade the Day It's Filed
Politician trades, insider buying with confidence scores, and 18 hedge fund portfolios beside professional charts and an AI assistant. Free plan available, no card required.
Start Free with ChartingLens