Why Trump's Trades Come From a Different System
Search "Trump stock trades" and you get two kinds of result: breathless headlines about a filing with thousands of transactions, and trackers that either don't have him at all or show a handful of rows. Both come from the same fact. The President's disclosures don't live where Congress's do, and they don't look like them.
Members of the House and Senate file Periodic Transaction Reports under the STOCK Act through the House Clerk and the Senate's eFD system, and those reports are clean text or HTML tables that any decent parser can read. Executive-branch officials, the President included, file with the Office of Government Ethics instead, on OGE Form 278-T. OGE posts those as PDF scans. The forms are paper-style, the transaction table runs to dozens of pages, and the OCR layer embedded in the files is unusable ("OGE Fonn 278-T" is how the first line reads if you extract the text). That is why most politician trackers stop at Congress.
This guide covers what the filings contain, how to read them, and how ChartingLens gets them into the same Politicians tab as Pelosi, Tuberville and the rest of Congress.
Form 278-T, Explained
Form 278-T is the executive branch's version of the congressional PTR. Any "public filer" in the executive branch must report purchases, sales or exchanges of securities over $1,000 within 30 days of being notified of the transaction, and no later than 45 days after it. Late filings carry a $200 fee, and several of the Trump reports note that the fee was paid.
Each row on the form has the same fields you see on a congressional filing: a description of the asset, the transaction type, the date, and an amount range ($1,001 to $15,000 up to over $50,000,000). Options and bonds are described in words ("4.00% Due Oct 1, 2052"), so a ticker only appears when the asset is a listed stock or fund. There is no column telling you which manager placed the trade.
The important structural difference from Congress: the President's holdings are managed by outside investment managers, and those managers trade a lot. So instead of a filing every few weeks with five rows, the Trump reports arrive a few times a year with hundreds or thousands of rows each.
What Is Actually in the Filings
ChartingLens has parsed every Trump 278-T posted by OGE since August 2025: 19 reports, about 8,500 individual transactions. Public reporting on the same documents puts the total at roughly 8,900 transactions between January 2025 and June 2026, with the May 8, 2026 reports alone (covering January through March) listing about 3,700 and the June 25, 2026 reports about 2,500. The disclosed amounts on a single batch sum to somewhere between $200 million and $750 million, which is what you get when every row is a range.
Three things stand out once the rows are in a table instead of a scan.
Most of it is municipal bonds. Row after row of state and local government paper: health facility authorities, gas supply revenue bonds, school districts, toll roads. Purchases in the $100,001 to $250,000 and $500,001 to $1,000,000 bands, hundreds of them a quarter. This is a large, conservatively managed fixed-income book being rolled and rebalanced, and it accounts for the bulk of the headline transaction counts.
The equity side is large-cap and index-like. Where tickers appear, they are the names you would expect from a managed account with a mandate to be broadly invested: mega-cap technology, financials, healthcare, broad ETFs. About 3,400 of the transactions we keep resolve to a listed ticker across 880 distinct symbols, and the most frequently traded are Microsoft, Amazon, Procter & Gamble, Workday, Home Depot, Netflix, Nvidia, Boston Scientific, General Mills and Verizon. Public reporting on the early-2026 batch highlighted purchases in the largest technology companies, and the timing of those buys (around the spring 2026 lows) is what generated the "massive gains" headlines.
Nothing in the form says who decided. There is no discretion flag. The pattern is consistent with professional managers running mandates, and the honest reading is that a Trump filing tells you about a very large managed portfolio, not about what the President personally thinks of Intel or Apple this month.
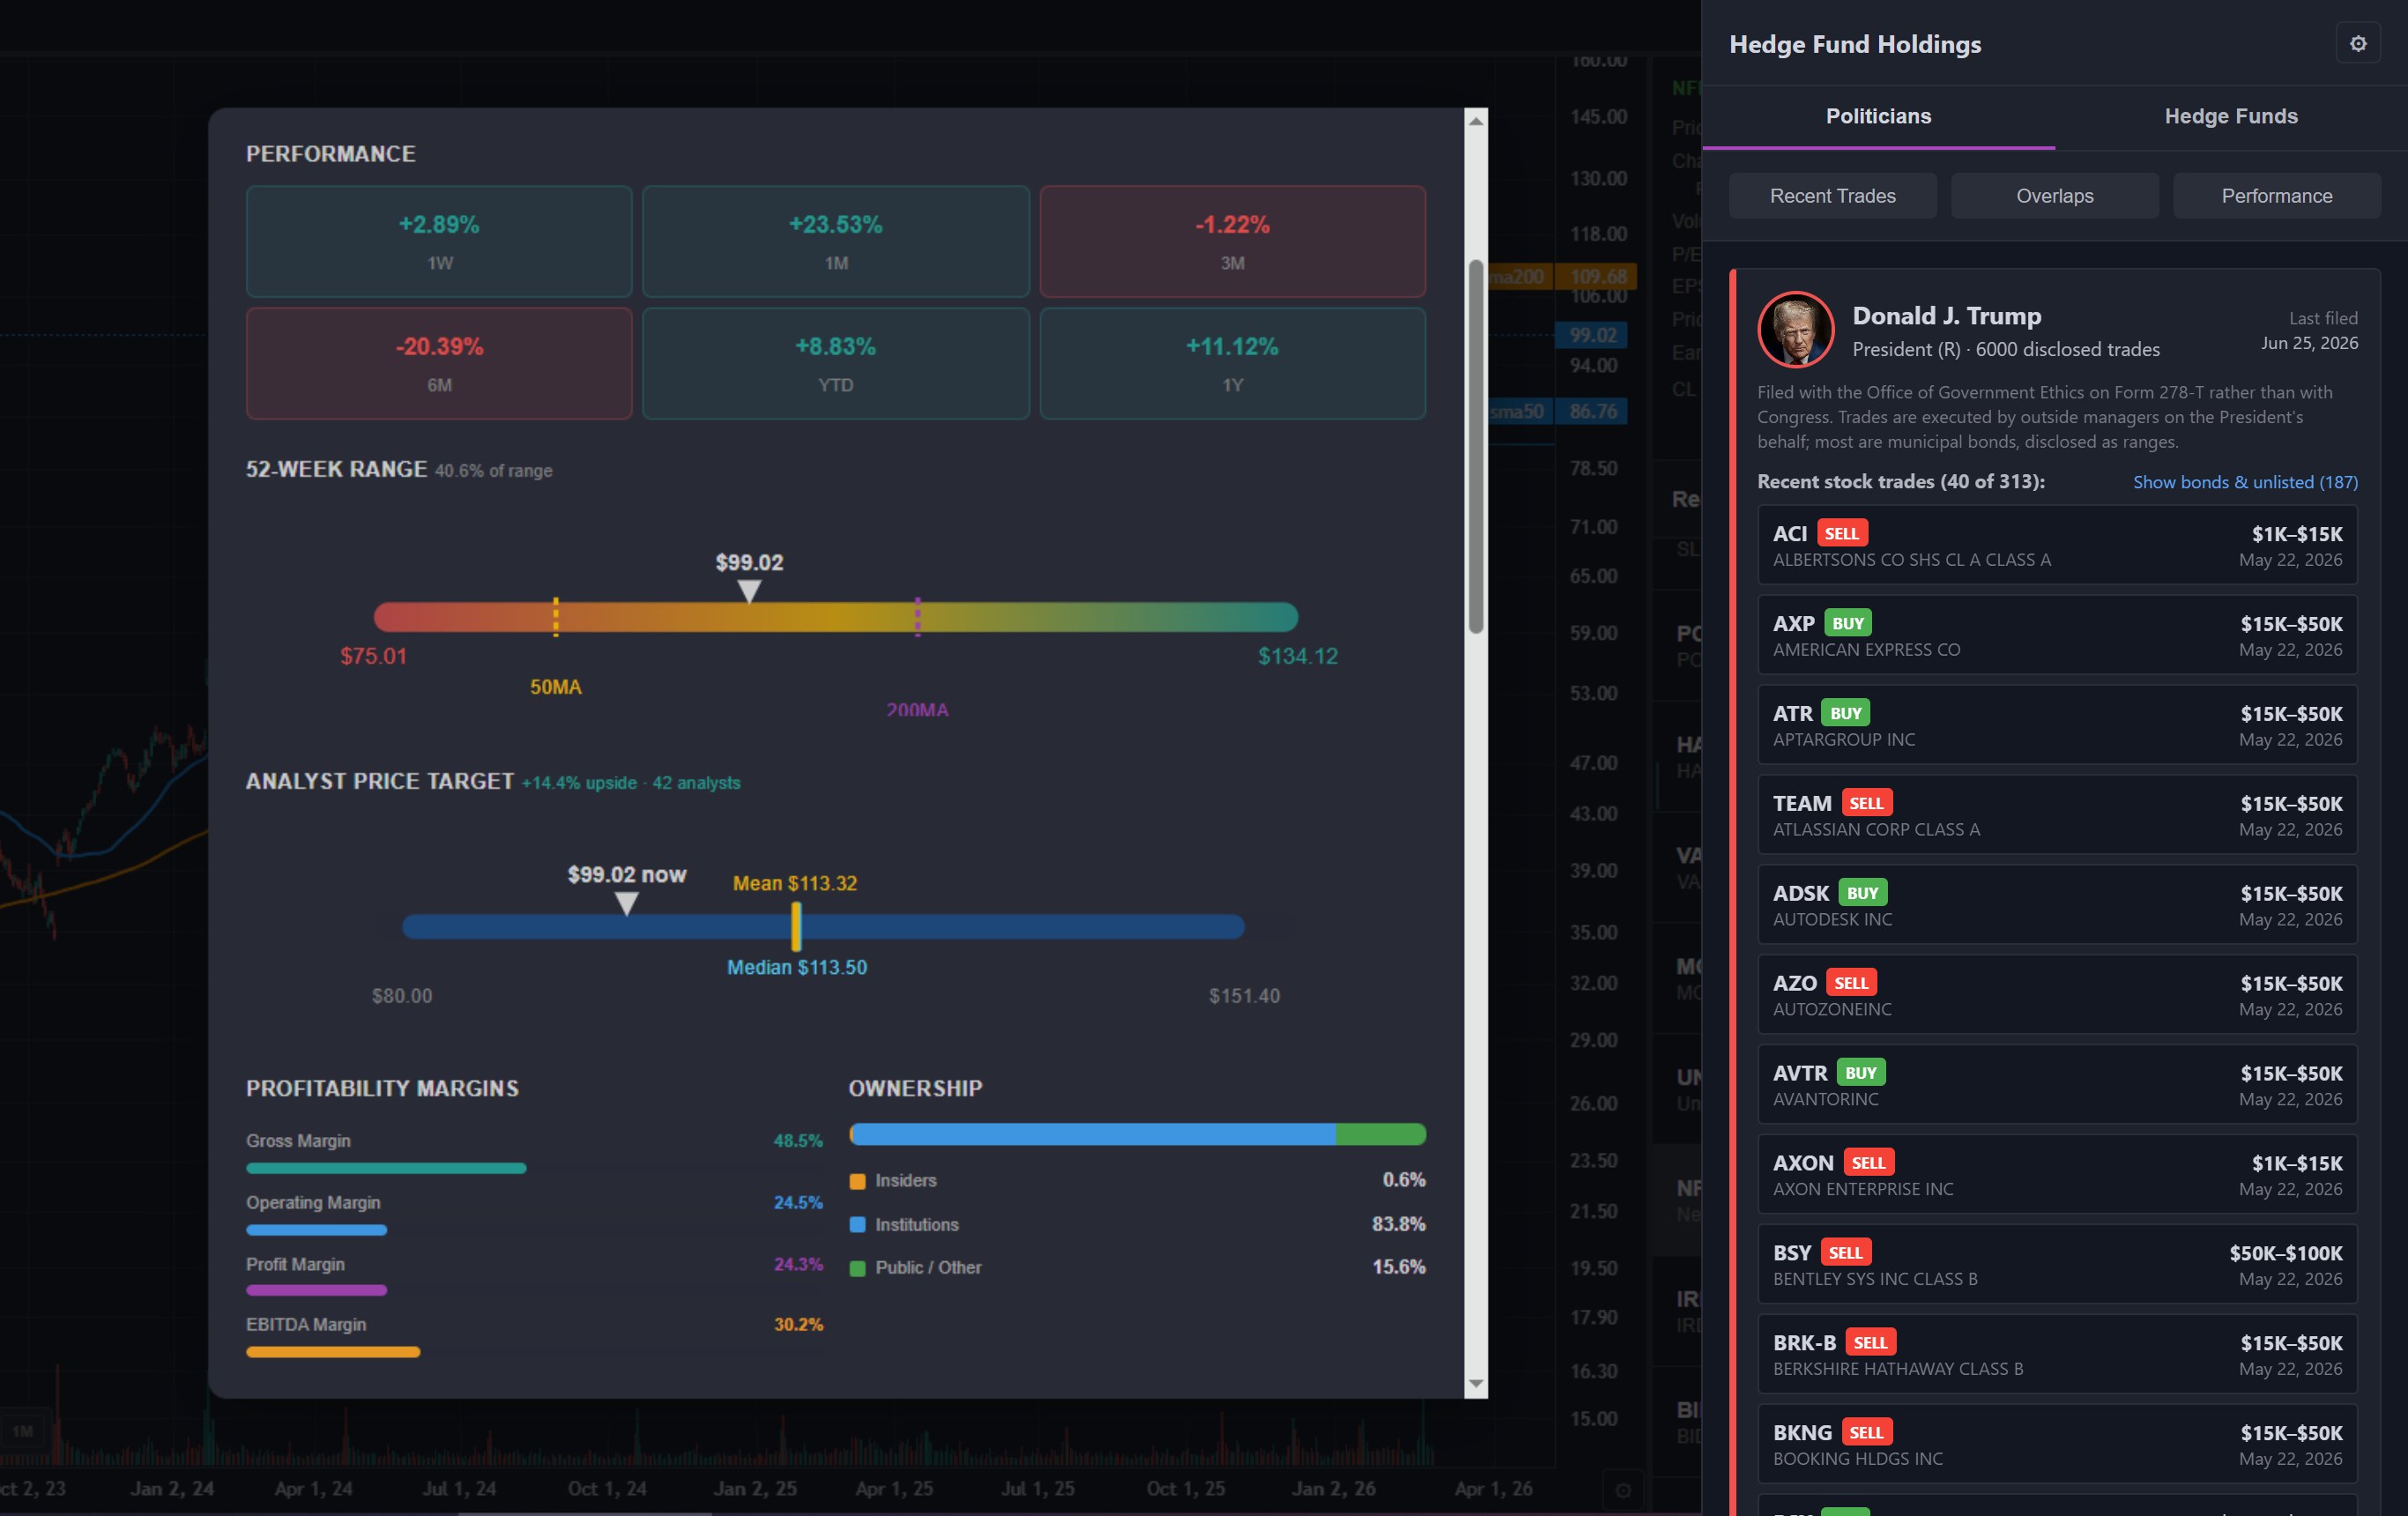
The Trump card in ChartingLens, August 25, 2026, built from the OGE 278-T scans.
How to Read a Trump Filing Without Fooling Yourself
Dates first. Every row has a transaction date, and the filing date is weeks or months later. The May 8, 2026 batch disclosed trades from January. If you are looking at a row in ChartingLens, the trade date is on the row and the filing date is on the card; read both before deciding anything is "recent."
Ranges are not amounts. A $500,001 to $1,000,000 bond purchase is exactly that, a band. Anyone who tells you the size of "Trump's Apple position" from these filings is guessing. Equal-weighted comparisons are the only honest math, and that is how the ChartingLens Performance view works.
Separate the book from the bets. The bonds are a portfolio being maintained. The equity purchases are the part worth a second look, especially where several arrive on the same date across different names, which reads as a rebalance or a cash deployment rather than a view on one company.
Expect amendments and duplicates. Some Trump reports were refiled as amended versions. ChartingLens treats an amendment as superseding the original so a trade is not counted twice.
The Scanned-PDF Problem (and How We Solved It)
The reason so few tools carry Trump's trades is technical. The congressional filings are machine-readable; the OGE scans are pictures of tables. Our House and Senate parser, which reads text positions on the page, gets nothing from them.
So ChartingLens does what a person would do, faster: each page of a Trump filing is split out and read by a vision model that returns the transaction table as structured rows, which are then validated (real dates, real transaction types, real amount bands) before being merged into the same database as the congressional trades. Every row keeps a link back to the source PDF. New filings are picked up automatically; OGE has no browsable index of presidential reports, so the pipeline watches the public aggregator pages that list them and reads the documents from OGE directly.
It is not perfect. Scanned bond descriptions are dense strings of abbreviations and a model will occasionally mangle one; the tickered equity rows, which are what most readers care about, are far more reliable. We would rather show the data with that caveat than leave the President out of a politician tracker.
Tracking Trump's Trades in ChartingLens
ChartingLens is a well-established charting platform with a large active user base, and its smart-money data lives in one panel: insider trading with confidence scores, 13F portfolios from Buffett, Burry, Ackman and 15 other legendary investors, and the Politicians tab. Trump is the first card on that tab by default, flagged Popular, with Pelosi, Crenshaw, Tuberville, Gottheimer and Greene behind him.
His card shows the parsed transactions newest first: ticker or asset description, BUY / SELL / EXCHANGE badge, the disclosed band, and the trade date, with a note explaining that the filings come from OGE and that the trades are made by outside managers. Tickered rows click straight through to the chart. Because his history is long, the card starts with the most recent rows and expands.
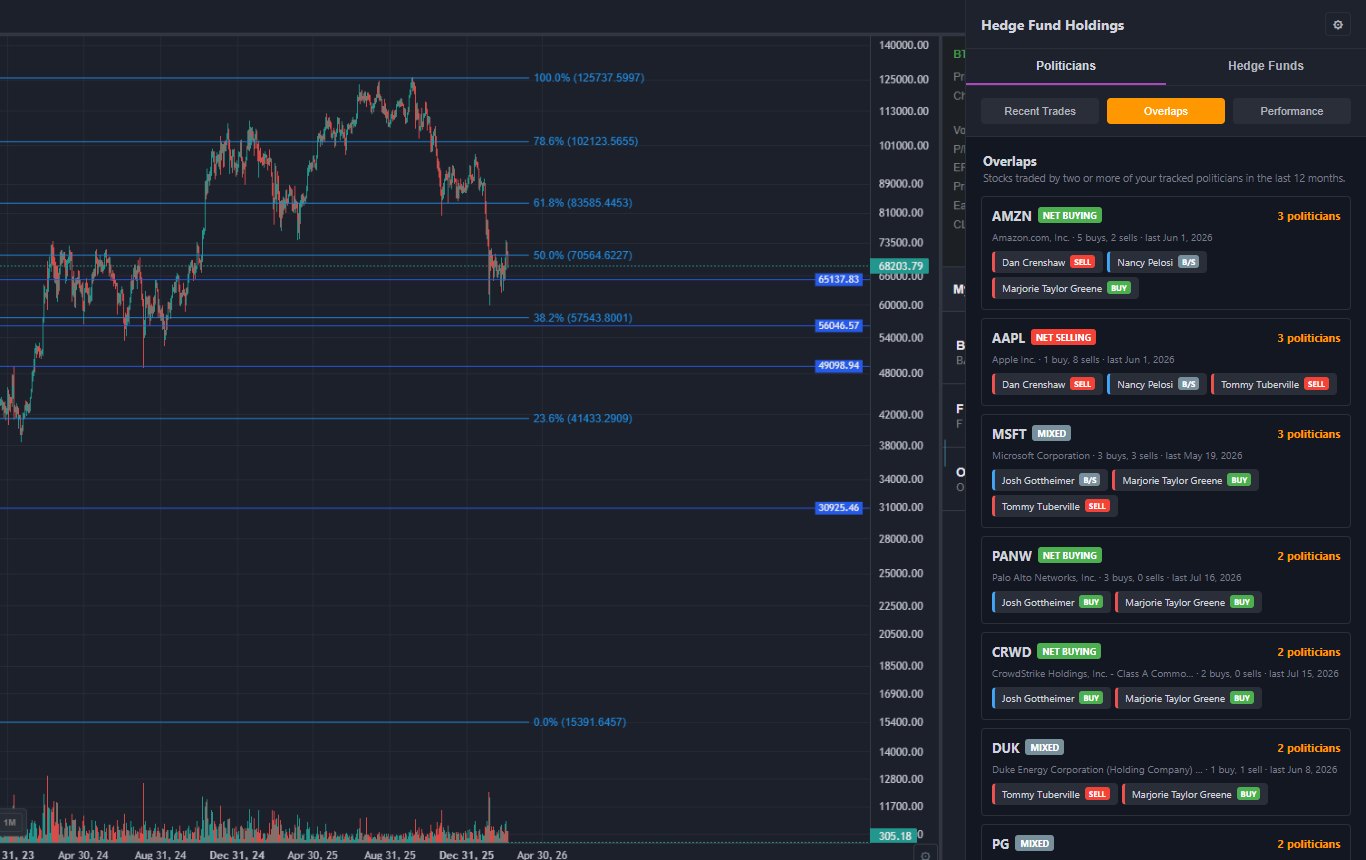
The Overlaps view: with Trump tracked, it shows where the President's managers and members of Congress traded the same stock within a year.
The three views above the cards work with Trump included. Recent Trades merges his newest filing into the same feed as Congress. Overlaps flags stocks that the President's managers and one or more members traded in the last 12 months, which is a genuinely new cross-reference no free tracker offers. Performance computes the equal-weighted return since each tickered buy over the last 12 months against the S&P 500 over the same windows, so you can see whether the managed equity book is doing anything an index fund would not. On August 25, 2026 that view showed his last 12 months of tickered buys up about +16.7% on average since the trade date, against roughly +2.7% for the S&P 500 over the same windows, with 14 of 15 positive; most of that is the timing of the spring 2026 purchases rather than stock selection.
And because it is the same panel as the insider tracker, you can check any of those equity buys against what the company's own executives were doing in the same window before you read anything into it.
What the Data Is Good For
Context on the headlines. When a "Trump bought $X million of Y" story runs, open the card. You will usually find it was one of dozens of same-day purchases in a rebalance, disclosed months later, in a band, not a number.
Cross-referencing. The Overlaps view answers a question that used to take an afternoon: which stocks did both the President's managers and members of Congress buy this year? Those names are worth a chart and an insider check.
Watching the equity sleeve. Filter mentally for tickered rows. The bond book is noise for a stock trader; the equity purchases, especially clustered ones near market lows, are the part with information in it.
Not for copy-trading. Two-to-four-month-old trades from a managed account in dollar bands are the weakest possible basis for a position. Use them as a discovery layer, then do the work: chart, insiders, alerts.
Follow the President and Congress in One Panel
Trump's 278-T filings, every member of Congress, insider buying with confidence scores and 18 hedge fund portfolios, beside professional charts and an AI assistant. Start free, upgrade for the full politician feed.
Track Trump's Trades FreeFrequently Asked Questions
Final Thoughts
Trump's trade disclosures are the most voluminous and the least readable of any politician's, which is why they are both constantly in the news and mostly absent from tracking tools. Parsed properly, they are a large managed bond book with an index-like equity sleeve, disclosed months late in dollar bands. That is less dramatic than the headlines and more useful: a cross-reference against Congress and corporate insiders, and a reality check on what a "Trump bought" story actually means.
ChartingLens is where you can see all of it in one place. The politician trades guide covers the congressional side of the system, and the Pelosi guide covers the filer everyone compares him to.
Related Articles
See Every Trump Filing the Day It's Parsed
Politician trades, insider buying with confidence scores, and 18 hedge fund portfolios beside professional charts and an AI assistant. Free plan available, no card required.
Start Free with ChartingLens