1. What Is the ICT Optimal Trade Entry?
The optimal trade entry, usually shortened to OTE, is the ICT answer to the question every trend trader eventually asks: the market just made a strong move in my direction, I missed it, how deep will the pullback go before it continues? The answer ICT gives is specific. Draw a Fibonacci retracement across the impulse, and the best entries cluster between the 62 percent and 79 percent retracement, with 70.5 percent as the sweet spot in the middle.
That is a deeper pullback than most traders are comfortable buying. By the time price has given back two thirds of a rally, it looks like the rally failed. That discomfort is the point. The OTE zone is where the traders who chased the impulse have been stopped out, where the pullback has swept the liquidity resting under the obvious levels, and where the institutions that drove the impulse are refilling. It is a deep discount in an uptrend, or a deep premium in a downtrend, and the method is built around buying discount and selling premium.
This guide covers the levels, how to draw the retracement so the zone lands where it should (the direction matters, and most people get it backwards at first), where OTE sits in the wider ICT trading strategy, and how it combines with fair value gaps and order blocks to make a single high-quality zone.
The one-sentence version: after an impulse with displacement, draw the Fibonacci across it and look to enter the pullback between the 0.62 and 0.79 retracement, stop beyond the swing that started the impulse, target the liquidity beyond the impulse high or low.
2. The Levels: 0.62, 0.705 and 0.79
Three numbers define the zone.
- 0.62 (the 61.8 percent retracement, rounded) is the top of the zone in a bullish setup. Above it, the pullback is shallow and you are buying at a price the impulse already paid.
- 0.705 is the midpoint, and ICT treats it as the ideal entry. It sits between the two standard Fibonacci levels and is the level to place a resting order at if you only want one.
- 0.79 (the 78.6 percent retracement) is the bottom of the zone. Below it, the pullback has retraced almost the whole impulse, and the structure that justified the trade is close to failing.
Beyond the entry zone, ICT uses extension levels for targets: the symmetrical projection of the impulse beyond its high, often quoted as the negative 0.27 and negative 0.62 levels on the same retracement. In practice the target that matters most is not a Fibonacci number at all; it is the liquidity resting beyond the impulse high, the equal highs or the prior day's high that price is likely to reach for. Use the extension levels as places to take partial profit on the way to that.
3. How to Draw the OTE Fibonacci Correctly
This is where the method is most often botched, so slowly.
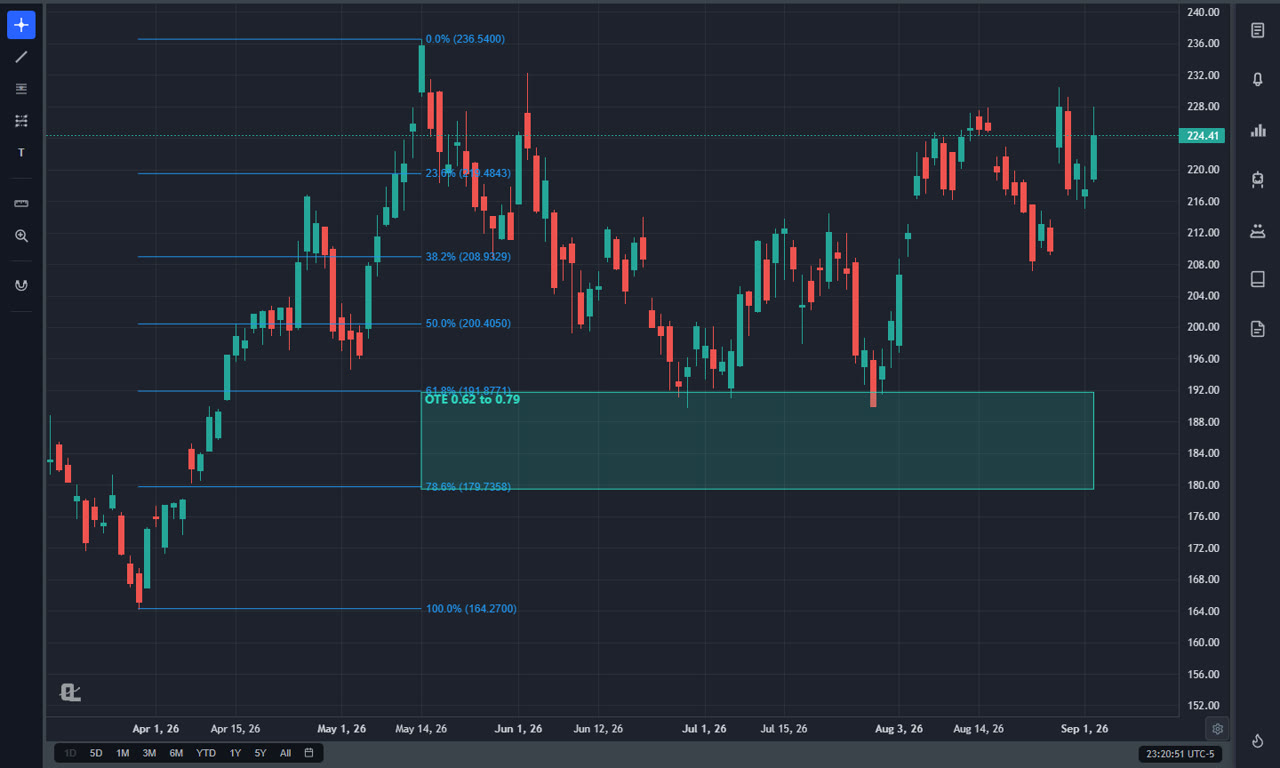
For a bullish OTE, the impulse runs from a swing low up to a swing high. Anchor the Fibonacci so that the high is 0 percent and the low is 100 percent. That way the retracement levels read as "how much of the rally has been given back": 62 percent means price has come 62 percent of the way back down toward the low. The OTE zone is the band between the 0.62 and 0.79 levels, in the lower part of the impulse.
For a bearish OTE, the impulse runs from a swing high down to a swing low. Anchor with the low at 0 percent and the high at 100 percent. The OTE zone sits in the upper part of the impulse, where the rally has given back 62 to 79 percent of the decline.
If you anchor the other way round, the tool still draws lines, but the labels are flipped: the level marked 61.8 percent is actually a 38.2 percent retracement, and you will be entering a shallow pullback while believing it is a deep one. Check the anchoring by looking at where the 0 sits. For a bullish setup, 0 should be at the top.
Two more rules for the anchors. Use the actual swing high and swing low of the impulse, wicks included, not candle bodies. And use the impulse that showed displacement: the leg that broke structure with large-bodied candles and left a fair value gap behind. A slow, grinding rally is not an impulse and does not produce a reliable OTE.
4. Where OTE Fits: After Displacement, Inside a Kill Zone
The OTE is not a standalone signal. On its own, a 70 percent retracement is just a price. What makes it a trade is the context ICT puts around it.
Displacement first. The impulse should be a real one: a strong move that breaks a swing point (a break of structure or change of character) and leaves an imbalance. That break tells you which side is in control, and the OTE is the place to join that side on the first pullback.
Then time. The pullback into the zone should ideally arrive inside a kill zone: the London open or the New York open. A retracement that drifts into 0.705 at 3 PM on a quiet afternoon can sit there for hours; the same retracement arriving at 8:30 AM is much more likely to be the turn.
Then confluence. Look inside the zone for a fair value gap or an order block from the impulse. When the 0.62 to 0.79 band overlaps the gap the impulse left, or the last opposing candle before it launched, the zone stops being a Fibonacci guess and becomes a place where three independent reasons agree.
5. How to Trade an OTE Step by Step
The OTE checklist
- Bias from the higher timeframe. Bullish structure means you only look for bullish OTEs, and the reverse.
- Find the impulse: a displacement leg that broke structure and left a fair value gap.
- Draw the Fibonacci from the swing high to the swing low (bullish: 0 at the high).
- Mark the zone between 0.62 and 0.79 and note any gap or order block inside it.
- Wait for price to enter the zone, preferably inside a kill zone and preferably after sweeping a nearby low.
- Enter at 0.705, or at the gap inside the zone, on a lower-timeframe confirmation.
- Stop below the swing low that started the impulse (past the 100 percent level). Target the liquidity beyond the impulse high. Only take it at two to one or better.
The Entry
There are two ways in. The mechanical version is a resting limit order at 0.705 with the stop already placed. It fills you at the ideal price and is the honest way to test the concept, but it takes every touch, including the ones that keep falling. The discretionary version waits for price to reach the zone and then drops to a lower timeframe for a confirmation: a change of character on the 5-minute chart, or a fair value gap forming as price turns. It filters out some losers at the cost of a slightly worse price. I prefer the second, but both are legitimate.
The Stop
Beyond the swing that started the impulse. If price trades through the 100 percent level, the pullback has become a full reversal of the impulse and the reason for the trade is gone. Do not put the stop just under 0.79; that is where the liquidity is, and a sweep of it is a normal part of a working OTE.
The Target
The liquidity beyond the impulse high: the equal highs, the previous day's high, the level price was heading for before it pulled back. The Fibonacci extensions are useful for scaling out on the way. Because the entry is deep in the pullback and the stop is only a little further, OTE trades routinely offer three to one or better, which is the whole attraction.
6. OTE Plus FVG Plus Order Block: Stacking the Zone
The best OTE setups are the ones where the zone contains something else. The impulse that created the Fibonacci usually left a fair value gap somewhere in its lower half, and the candle just before it launched is the order block. When the 0.62 to 0.79 band, the gap and the order block all overlap, that overlap is the entry, and it is usually narrower than the OTE zone on its own.
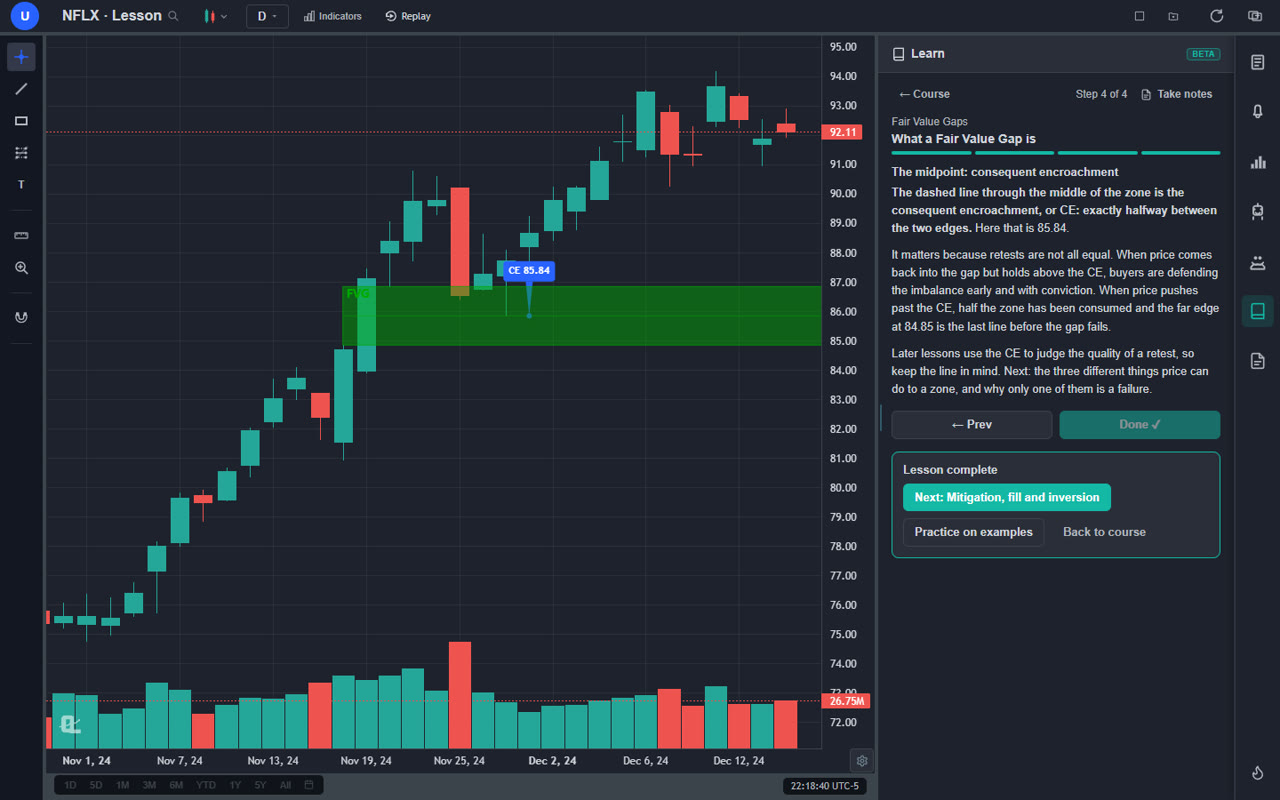
The fair value gap also gives you a precise line to trade against: its midpoint, which ICT calls consequent encroachment. A pullback that reaches the OTE zone and holds above the midpoint of the gap inside it is buyers defending the imbalance early. A pullback that pushes through the midpoint has consumed half the gap and is one step from failing.
If you want to understand the gap side of this properly, the fair value gap guide covers mitigation, fills and inversions, and the order block guide covers how to pick the right candle. OTE is the map; those are the coordinates.
7. When OTE Fails
An OTE fails in one of three recognisable ways, and each teaches something.
Price never reaches the zone. The pullback turns at 0.5 and runs to new highs without you. This is not a loss, and it is not a failure of the method. Deep pullbacks are the setup; shallow ones are the trades you skip. Chasing the shallow one is how OTE traders end up with the worst entries of anyone.
Price reaches the zone and keeps going. The stop below the swing low handles it. When this happens repeatedly, the usual cause is a bad impulse: a leg that was drawn from a grinding move with no displacement, or an OTE taken against the higher-timeframe bias.
Price sweeps the zone and then turns. Price trades below 0.79, even briefly below the swing low, and reverses. If the stop was placed just under 0.79, you were stopped out of a trade that worked. This is the argument for the stop beyond the 100 percent level and for sizing the position to that wider stop.
8. Common Mistakes
Anchoring the Fibonacci Backwards
The most common one by far. For a bullish OTE, 0 goes at the high. If the 61.8 label sits in the upper half of the rally, it is reversed.
Drawing It on Every Swing
A Fibonacci on a random two-day wobble is a random zone. Draw it on the impulse that broke structure with displacement, and nothing else.
Entering at 0.5
Half is not the OTE. It is a popular level precisely because everyone buys it, which is why the pullback often keeps going through it to collect their stops before turning in the real zone.
Stops Just Below 0.79
That is where the liquidity is. Give the trade room to the swing low and size for it.
No Time Filter
An OTE reached in a kill zone and the same OTE reached at midnight are different trades. Add the clock.
9. Drawing OTE in ChartingLens
ChartingLens is a well-established charting platform with a large, active user base, and the OTE workflow is a few clicks in it.
The Fibonacci Tool With the Right Levels
The Fibonacci retracement tool shows the 61.8 and 78.6 percent levels by default, so the OTE zone appears the moment the tool is anchored from the impulse high to the low. The chart above was drawn exactly that way. Add a rectangle over the band if you want it shaded, and set a price alert at 0.705 so you are told when price arrives rather than watching for it.
Let the AI Find the Imbalance Inside the Zone
Ask the AI assistant to detect Smart Money Concepts and it marks the fair value gaps and order blocks on the live chart, so you can see at a glance whether the OTE band contains one. It reads the actual data on screen, so a follow-up like "is there a gap between 191 and 180?" gets a real answer.
Learn the Retest, Then Rehearse
The Fair Value Gaps course in the Learn panel teaches the retest entry, the midpoint line, the stop and the 2R target step by step on real charts, then grades you on real setups with the gap hidden. The bar replay simulator lets you replay a whole impulse and pullback one candle at a time and place the OTE as it forms. When you want numbers, the plain-English strategy builder and its institutional-grade backtesting engine will test the rules over years of data.
Putting It All Together
The optimal trade entry is a disciplined way to buy the deep pullback everyone else is afraid of. Find an impulse with displacement, anchor the Fibonacci from the high to the low, wait for price to reach the 0.62 to 0.79 band inside a kill zone, enter at 0.705 or at the gap inside the zone, stop beyond the swing low, target the liquidity beyond the impulse high. It is a simple recipe. The hard part is waiting for the deep pullback instead of chasing the shallow one, and that is a matter of practice, not knowledge.