Fair value gaps are one of the most powerful concepts in modern price action trading. Rooted in smart money concepts (SMC), fair value gaps identify zones where institutional order flow created a price imbalance that the market is likely to revisit. Unlike lagging indicators that react after the fact, a fair value gap gives you a forward-looking area on the chart where high-probability trades can be planned in advance.
Whether you are a day trader looking for precision entries or a swing trader hunting for pullback zones, understanding how to identify and trade fair value gaps will sharpen your edge. This guide breaks down everything you need to know about FVG trading in 2026 — from the basic mechanics to advanced strategies and automated detection.
What Is a Fair Value Gap (FVG)?
A fair value gap is a three-candle price pattern that reveals an imbalance in the market. It occurs when a strong directional move — driven by aggressive buying or selling — pushes price so quickly that it skips over certain price levels without sufficient two-sided trading. The result is a visible gap on the chart between the wick of the first candle and the wick of the third candle.
In plain terms, a fair value gap is an area where price moved too fast for the market to reach equilibrium. Buyers and sellers did not get a chance to transact at every price within that range, leaving behind unfilled orders and unfinished business. The market has a tendency to return to these zones to "fill" the gap before continuing in the original direction.
The concept is closely related to other SMC ideas like order blocks and supply and demand zones, but fair value gaps are structurally distinct. Where an order block is defined by the last opposing candle before a move, a fair value gap is defined by the space between the outer wicks of a three-candle sequence. This makes FVGs more precise — you know the exact price range of the imbalance.
Fair value gaps appear across all markets and all timeframes. They show up on stock charts, crypto charts, forex pairs, and futures contracts. They are not a rare pattern — on any given day, multiple FVGs form on most liquid instruments. The skill is in knowing which ones are worth trading and which ones to ignore.
Fair Value Gap vs. Traditional Gap
It is important to distinguish a fair value gap from a traditional price gap (like an overnight gap or a gap-up on earnings). A traditional gap is a break between the close of one session and the open of the next — there is literally no trading in between. A fair value gap, by contrast, occurs within continuous trading. Price does trade through the zone, but the middle candle moves so aggressively that the wicks of the surrounding candles do not overlap, creating an imbalance rather than an absence of trading.
This distinction matters because the forces driving FVG fills are different from those driving traditional gap fills. FVGs fill because of order flow dynamics — resting limit orders and unfilled institutional positions pull price back. Traditional gaps fill for different structural reasons related to session transitions.
How Fair Value Gaps Form (The 3-Candle Pattern)
Every fair value gap requires exactly three candles. The pattern is simple in structure but reveals something meaningful about what happened in the market. Here is how it works.
Candle 1 (the setup candle): This is the candle immediately before the aggressive move. Its high (for bullish FVGs) or low (for bearish FVGs) establishes one boundary of the gap.
Candle 2 (the displacement candle): This is the big mover. It has a large body — significantly larger than the surrounding candles — indicating strong momentum. This candle is what creates the imbalance. Its body represents the area where price moved so fast that the market did not have time to fully process orders at every level.
Candle 3 (the confirmation candle): This candle opens and trades in the direction of the move but does not retrace far enough to overlap with Candle 1's wick. The gap between Candle 1's relevant wick and Candle 3's relevant wick is the fair value gap.
The Displacement Requirement
Not every three-candle sequence with a gap qualifies as a meaningful fair value gap. The displacement candle needs to show genuine momentum. Look for these characteristics:
- Large body relative to surrounding candles: The displacement candle should have a body at least 1.5 to 2 times larger than the average candle in the current range.
- Minimal wicks on the displacement candle: A strong displacement candle closes near its high (bullish) or low (bearish) with small wicks, indicating that the momentum was sustained throughout the candle.
- Volume confirmation: Higher-than-average volume on the displacement candle adds conviction that the move was driven by real institutional participation rather than thin liquidity.
- Break of structure: The strongest FVGs form when the displacement candle also breaks a recent swing high or swing low, confirming a shift in market structure.
When these conditions are met, you have a fair value gap worth monitoring. When they are not — for example, a small gap created by a slightly above-average candle in a choppy range — the gap is less likely to act as a reliable trading zone.
Bullish vs. Bearish Fair Value Gaps
Bullish Fair Value Gap
A bullish fair value gap forms during an upward move. The gap exists between the high of Candle 1 and the low of Candle 3. For this gap to exist, Candle 3's low must be higher than Candle 1's high — meaning there is a price range where only the displacement candle (Candle 2) traded.
A bullish FVG acts as a potential support zone. When price retraces back down into this gap, it enters an area where unfilled buy orders are likely resting. Traders look to go long when price enters the bullish FVG, expecting it to hold and push price back up in the original bullish direction.
The strongest bullish FVGs form after a clear break of a swing high, during a trending market, and when the displacement candle has above-average volume. They align naturally with support and resistance concepts — a bullish FVG is essentially a dynamically created support zone based on order flow rather than historical price levels.
Bearish Fair Value Gap
A bearish fair value gap forms during a downward move. The gap exists between the low of Candle 1 and the high of Candle 3. Candle 3's high must be lower than Candle 1's low, creating a range where only the displacement candle traded.
A bearish FVG acts as a potential resistance zone. When price rallies back up into this gap, it enters an area where unfilled sell orders are likely resting. Traders look to go short when price enters the bearish FVG, expecting selling pressure to push price back down.
Bearish FVGs are particularly effective after a break of a swing low in a downtrend. They also work well in confluence with other resistance concepts — if a bearish FVG aligns with a previous order block or a key horizontal resistance level, the probability of a rejection increases significantly.
Partially Filled vs. Fully Filled FVGs
When price retraces into a fair value gap, it does not always fill the entire zone. Understanding the difference matters for trade management:
- Partial fill: Price enters the FVG but reverses before reaching the opposite boundary. This often happens in strong trends where the market respects the gap's midpoint (the 50% level, sometimes called the "consequent encroachment"). A partial fill suggests strong trend continuation.
- Full fill: Price retraces through the entire FVG from one boundary to the other. A full fill does not automatically invalidate the zone, but it does suggest weaker imbalance. If price moves beyond the FVG entirely, the gap has been negated.
- Overshoot and reclaim: Price briefly pierces through the FVG but then reverses back. This is a stop-hunt pattern where liquidity gets grabbed just beyond the gap before the real move begins. This is one of the highest-probability setups in FVG trading.
Why Fair Value Gaps Work as Trading Zones
Fair value gaps are not a magic pattern. They work because they reflect real market mechanics. Understanding the "why" behind FVGs will help you trade them with more confidence and avoid the ones that are likely to fail.
Institutional Order Flow
Large institutions — banks, hedge funds, pension funds — cannot execute their full positions in a single order without moving the market against themselves. When they initiate a large position, the initial burst of buying or selling creates the displacement candle. But they often cannot fill their entire order during that burst. The remaining unfilled portion sits as resting limit orders in the price range the market skipped over — the fair value gap.
When price returns to the FVG, those resting orders get filled, providing the buying or selling pressure that causes price to bounce from the zone. This is the same principle behind supply and demand zones, but FVGs give you a more precise structural definition.
Market Efficiency and Mean Reversion
Markets tend toward efficiency. When price moves too far too fast in one direction, it creates a temporary inefficiency — an area where the market did not properly discover fair price through two-sided trading. The market's natural tendency is to revisit these inefficient areas and establish equilibrium before continuing. This is why FVGs get filled so frequently.
Liquidity Mechanics
Stop losses and limit orders tend to cluster around recognizable price levels. When a fair value gap forms, the area inside the gap becomes a natural magnet for institutional orders looking for liquidity. Market makers and algorithms are programmed to seek out these imbalances and push price back toward them when conditions allow. The gap acts as a liquidity pocket that draws price.
This is also why FVGs work particularly well when combined with other SMC concepts. A fair value gap that sits just above a zone of stop losses (sell-side liquidity) creates a scenario where smart money can fill orders and grab liquidity simultaneously — a high-probability setup. To learn how these stop runs unfold and how to trade them, see our liquidity sweeps trading guide.
How to Trade Fair Value Gaps (Step-by-Step Strategy)
Knowing what a fair value gap is and how it forms is the foundation. Trading it profitably requires a structured approach. Here is a step-by-step fair value gap strategy you can apply to any market.
Step 1: Establish the Higher-Timeframe Bias
Before looking for FVG entries, determine the overall market direction on a higher timeframe. If the daily chart is in a clear uptrend (higher highs, higher lows), you should only trade bullish fair value gaps as pullback entries. If the daily chart is in a downtrend, focus on bearish FVGs.
This filter alone eliminates the majority of losing FVG trades. Trading FVGs against the higher-timeframe trend leads to frequent stop-outs because you are trying to catch a pullback in the wrong direction.
Step 2: Identify the Fair Value Gap on Your Entry Timeframe
Drop to your entry timeframe (typically 1-2 timeframes below your bias timeframe) and look for qualifying FVGs. Remember the criteria:
- Clear three-candle pattern with no overlap between Candle 1 and Candle 3 wicks
- Large displacement candle with a body at least 1.5x the recent average
- Ideally formed during a break of structure (swing high or swing low)
- Above-average volume on the displacement candle
Mark the FVG zone on your chart. The boundaries are the high of Candle 1 and the low of Candle 3 (for bullish FVGs) or the low of Candle 1 and the high of Candle 3 (for bearish FVGs).
Step 3: Wait for Price to Retrace Into the FVG
This is where patience matters. Do not enter a trade the moment the FVG forms — wait for price to pull back into the gap zone. The most common approach is to set a limit order at the midpoint of the FVG (the 50% level), which gives you a better risk-to-reward ratio while still respecting the zone.
Alternatively, aggressive traders enter at the top of a bullish FVG (the low of Candle 3) for the earliest possible entry, while conservative traders wait for a candlestick pattern confirmation — like a bullish engulfing or pin bar — within the FVG zone before entering.
Step 4: Confluence Confirmation
The highest-probability FVG trades have multiple factors aligning. Look for these confluence signals:
- FVG aligns with a key support or resistance level: If a bullish FVG sits right at a major support level, both the imbalance and the historical level support a long entry.
- FVG overlaps with an order block: When an order block and an FVG occupy the same price range, institutional interest is doubled.
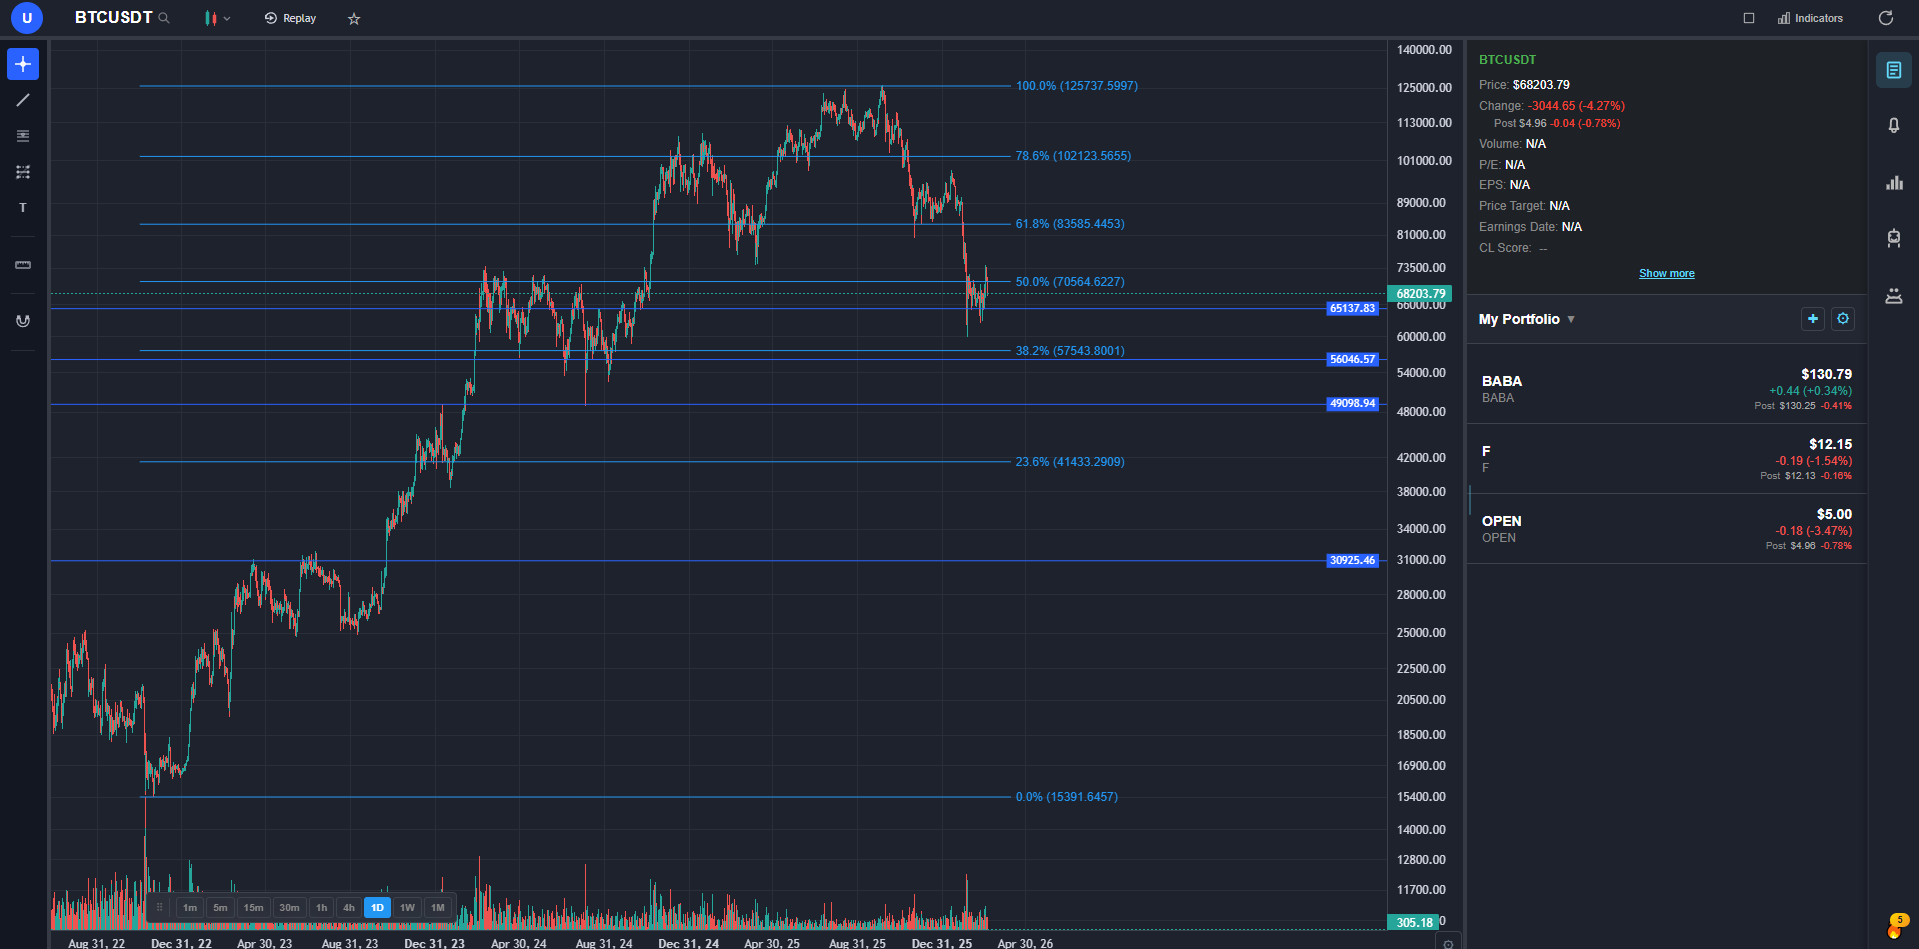
- FVG aligns with a Fibonacci retracement level: The 61.8% or 78.6% Fibonacci retracement of the prior swing landing inside the FVG adds technical confluence.
- Multiple timeframe FVG alignment: A 15-minute FVG that sits inside a 4-hour FVG creates a nested setup with significantly higher probability.
In ChartingLens, you can use the AI assistant to detect FVGs and then ask it to draw support and resistance levels on the same chart. The AI overlays both, making it easy to spot where FVGs align with key levels — something that would take minutes of manual analysis.
Step 5: Set Your Stop Loss
For a bullish FVG trade, place your stop loss below the low of Candle 1 (the bottom boundary of the FVG zone) plus a small buffer. For a bearish FVG trade, place your stop above the high of Candle 1 plus a buffer. If price invalidates the entire FVG, the trade thesis is wrong and you want to be out.
A common refinement: if you entered at the 50% level of the FVG, you can use the full FVG boundary as your stop. This keeps the stop tight while giving the trade enough room to work. Typical stop-loss distances for FVG trades are 0.5% to 2% depending on the timeframe and instrument volatility.
Step 6: Define Your Take-Profit Targets
Fair value gap trades typically target the high or low created by the displacement move. For a bullish FVG entry, your first target is the high of the displacement candle (Candle 2). Your second target is the next higher-timeframe resistance level or opposing FVG.
Many traders scale out of FVG trades — taking partial profits at a 1:1 risk-to-reward ratio and letting the remainder run to the displacement high with a trailing stop. This approach locks in profits while giving the trade room to capture the full continuation move.
Best Timeframes for FVG Trading
Fair value gaps appear on every timeframe from 1-minute to monthly charts. But not all timeframes are equally useful for trading them. The right timeframe depends on your trading style and how much time you can dedicate to monitoring charts.
Day Trading (Intraday)
For day traders, the optimal approach is to use the 1-hour or 4-hour chart for directional bias and the 5-minute or 15-minute chart for FVG entries. The 15-minute timeframe is the sweet spot for most day traders — FVGs form frequently enough to generate opportunities but are large enough to filter out noise.
The 1-minute and 3-minute timeframes produce too many FVGs, most of which are noise. Avoid trading sub-5-minute FVGs unless you are scalping with very tight risk parameters and fast execution.
Swing Trading
Swing traders should focus on the 4-hour and daily charts for FVG identification. Daily FVGs are particularly powerful because they represent full-session imbalances that require significant volume to create. When a daily FVG forms, it often takes multiple sessions for price to retrace and fill it, giving swing traders time to plan entries.
Use the 1-hour chart for entry timing within a daily or 4-hour FVG. This multi-timeframe approach lets you enter with tighter stops while trading a higher-timeframe imbalance.
Position Trading
For longer-term positions, the weekly chart produces the most significant FVGs. A weekly fair value gap represents a major institutional imbalance that can take weeks or months to fill. These are rare but extremely powerful when they appear. They work well for planning major position entries on stocks, ETFs, or crypto assets you want to hold.
Multi-Timeframe FVG Stacking
The most reliable FVG setups occur when gaps align across multiple timeframes. For example, if a daily FVG sits inside a weekly FVG, and a 4-hour FVG forms within both as price retraces, you have a triple-confirmation zone. These nested setups offer the highest probability and are worth waiting for even if they occur less frequently.
ChartingLens Bar Replay is useful here. You can practice identifying multi-timeframe FVG setups on historical data, rewind to past moves, and see how price reacted when multiple FVGs aligned. This builds pattern recognition before you risk real capital. Check out our guide on how to backtest a trading strategy for more on using Bar Replay to validate setups.
Common FVG Trading Mistakes to Avoid
Fair value gaps are a straightforward concept, but traders consistently make the same mistakes when applying them. Avoiding these errors will significantly improve your results.
1. Trading Every FVG Without Filtering
The most common mistake is treating every fair value gap as a trade opportunity. On any given day, dozens of FVGs form across instruments and timeframes. Most of them are low-quality — small gaps in choppy ranges with no directional bias. If you trade all of them, your win rate will be poor.
The fix: Only trade FVGs that align with the higher-timeframe trend, have a qualifying displacement candle, and ideally have at least one additional confluence factor (key level, order block, Fibonacci).
2. Entering Before Price Reaches the FVG
Some traders see an FVG form and immediately enter a trade in the direction of the move, thinking they are riding momentum. This is not an FVG trade — it is a momentum trade that happens to have an FVG nearby. FVG trading is a pullback strategy. You wait for price to retrace into the gap before entering.
The fix: Set limit orders at the 50% level of the FVG or wait for price to reach the zone and show a reaction candle before entering.
3. Ignoring the Higher-Timeframe Context
Trading a bullish FVG on the 15-minute chart when the daily chart is in a strong downtrend is fighting the larger trend. The FVG might produce a brief bounce, but the probability of a sustained move is low. Always check one or two timeframes above your entry chart for directional alignment.
4. Setting Stops Too Tight
Placing your stop loss at the exact boundary of the FVG without any buffer invites stop-hunting. Market makers and algorithms know where orders cluster, and they frequently push price a few ticks beyond the FVG boundary to trigger stops before reversing. Give your stop loss a buffer of at least 5-10% of the FVG's range beyond the boundary.
5. Holding Through a Full FVG Violation
If price completely fills the FVG and closes beyond it on the timeframe you are trading, the imbalance has been resolved. Holding the position hoping for a reversal is no longer an FVG trade — it is a hope trade. Respect your stop. If the FVG breaks, exit and look for the next setup.
6. Forgetting About Volume
A fair value gap that forms on low volume is less reliable than one that forms on high volume. Low-volume FVGs can be created by thin market conditions (pre-market, holidays, illiquid names) rather than genuine institutional displacement. Always check volume on the displacement candle. Our guide on volume analysis covers this in depth.
7. Not Journaling FVG Trades
Because FVGs come in many forms — different timeframes, different confluence levels, different market conditions — tracking which setups work best for your style is essential. Keep a trading journal that records the timeframe, confluence factors, market context, and outcome of every FVG trade. Over time, patterns emerge that sharpen your edge.
How to Detect Fair Value Gaps Automatically With AI
Manually scanning charts for fair value gaps is time-consuming. You need to check each candle sequence, measure whether the wicks overlap, assess the displacement candle's quality, and repeat this across multiple timeframes and instruments. It is the kind of repetitive pattern recognition that AI handles far better than humans.
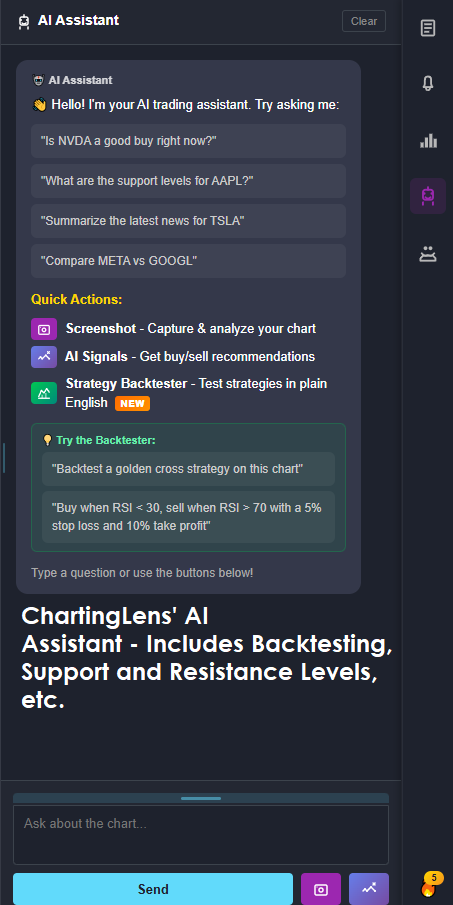
ChartingLens AI Chat for FVG Detection
ChartingLens includes an AI trading assistant that can detect and draw fair value gaps directly on your chart in seconds. The process is simple: open any stock or crypto chart, type a prompt into the AI assistant, and the zones appear.
Here are example prompts that work:
- "Show me the fair value gaps" — The AI scans the visible chart and highlights all qualifying FVGs with color-coded rectangles.
- "Detect FVGs on this chart" — Same behavior, different phrasing. The AI understands natural language variations.
- "Find bullish fair value gaps only" — Filters results to show only bullish FVGs, useful when you have a long bias.
- "Show FVGs and support resistance levels" — The AI draws both, letting you immediately see which FVGs align with key levels for confluence.
The AI draws each fair value gap as a locked rectangle anchored to the exact price and time coordinates of the gap. Bullish FVGs appear in green, bearish FVGs in red. Because the rectangles are anchored to price and time, they move with the chart as you scroll, zoom, or change timeframes — they stay precisely where they belong.
Combining AI Detection With Other Tools
The real power of automated FVG detection shows up when you combine it with other ChartingLens features:
- AI-drawn support and resistance: Ask the AI to draw both FVGs and support and resistance levels. When a fair value gap overlaps with a major support or resistance level, you have instant confluence confirmation without manual plotting.
- Bar Replay for practice: Use ChartingLens Bar Replay to rewind the chart to a historical period, have the AI detect the FVGs that existed at that point, and then play price forward to see how they resolved. This is the fastest way to build intuition for FVG trading without risking capital.
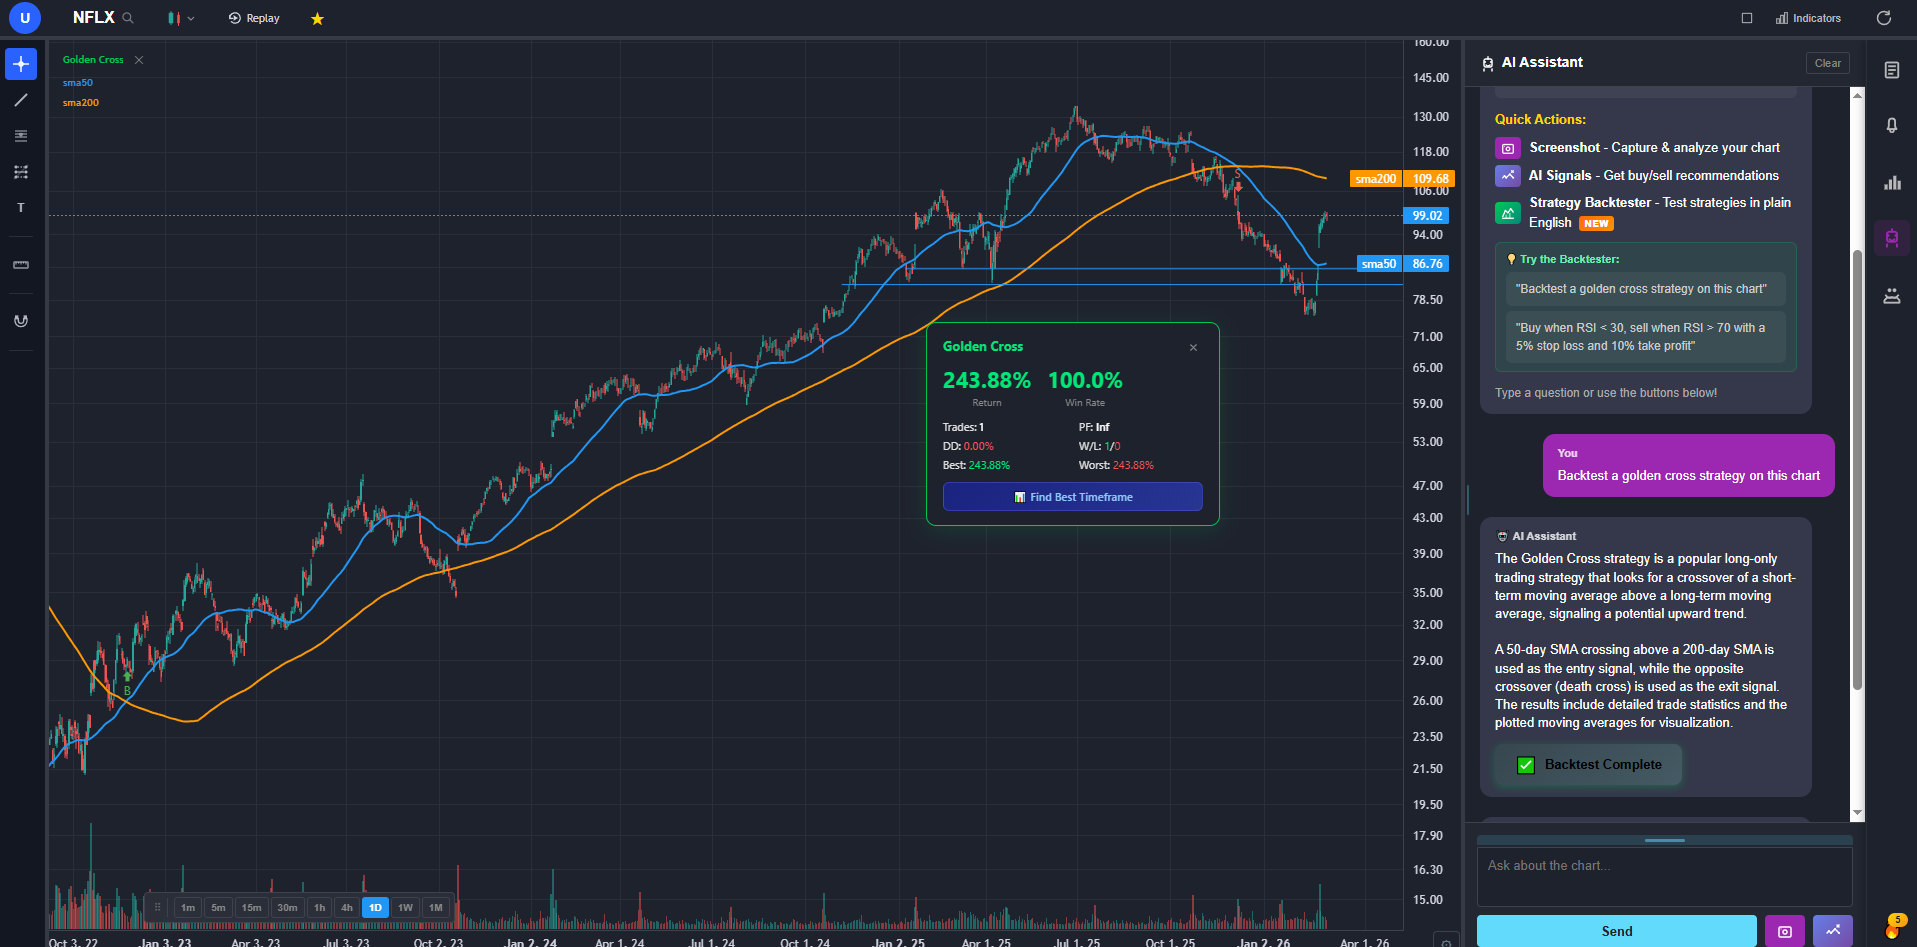
- Plain-English backtesting: Describe an FVG strategy in natural language — for example, "buy when price enters a bullish fair value gap on the daily chart after breaking a swing high" — and the backtester runs it across historical data to show you win rate, average return, and drawdown. No coding required. See our full backtesting guide for details.
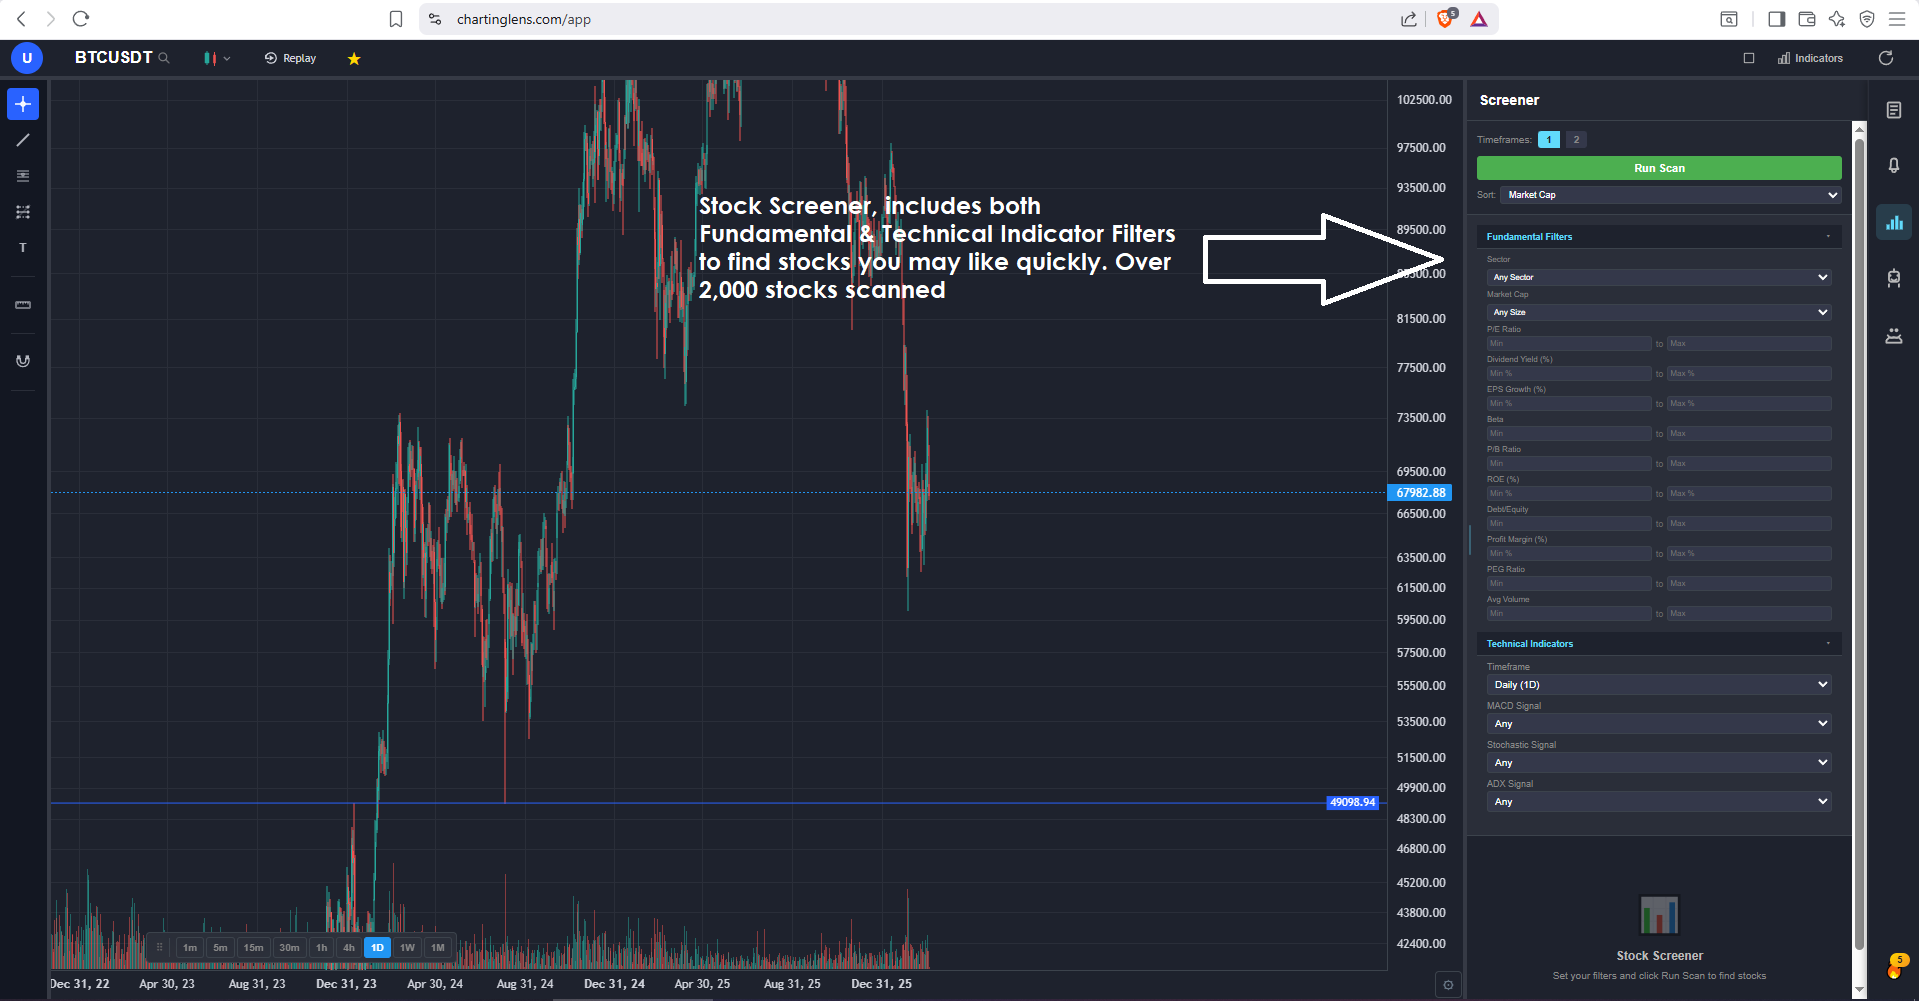
- Screener for opportunity finding: Use the ChartingLens stock screener to identify instruments in strong trends, then open each chart and have the AI detect FVGs. This workflow lets you find the best FVG setups across your entire watchlist in minutes.
How it works technically: The ChartingLens AI scans each three-candle sequence on the visible chart, calculates whether the high of Candle 1 and the low of Candle 3 (or vice versa for bearish) create a non-overlapping gap, filters for minimum displacement size, and draws the resulting zones as rectangles. The rectangles are locked to the chart's price-time grid so they persist as you interact with the chart. The entire process takes about two seconds.
Why AI Detection Beats Manual Scanning
There are three concrete advantages to using AI for FVG detection rather than scanning manually:
- Speed: The AI scans hundreds of candle sequences in seconds. Manual scanning of a single chart takes minutes, and checking multiple timeframes multiplies that time.
- Consistency: The AI applies the same criteria every time. Human eyes get fatigued, miss gaps in choppy areas, and introduce subjective bias about which gaps "look right."
- Multi-factor analysis: The AI can overlay FVGs with support/resistance, trendlines, and other patterns simultaneously. Manually layering all these analyses on a single chart is slow and visually cluttered.
If you are serious about FVG trading, automated detection is not a luxury — it is a practical necessity for any trader monitoring more than a handful of instruments.
Frequently Asked Questions
Related Articles
Ready to Find Fair Value Gaps Automatically?
ChartingLens AI detects and draws FVG zones on your chart in seconds. Combine with support/resistance, Bar Replay, and plain-English backtesting. Free to start.
Try ChartingLens Free