If you have spent any time studying smart money concepts, you have almost certainly encountered the term "order block." It is one of the most discussed concepts in institutional trading analysis, and for good reason. Order blocks represent zones on a chart where banks, hedge funds, and market makers have placed large orders, and when price returns to those zones, it frequently reacts with precision.
But there is a problem. Most explanations of order blocks online are either oversimplified to the point of being misleading, or buried in jargon that makes the concept harder than it needs to be. This guide cuts through both. You will learn exactly what an order block is, why they form, how to identify the valid ones (most are not), and how to trade them with a structured strategy that manages risk properly.
We will also cover how ChartingLens uses AI to detect order blocks automatically on your chart, eliminating the manual scanning that makes this approach time-intensive for most traders.
What Is an Order Block?
An order block is a specific price zone on a chart where institutional traders accumulated or distributed large positions before a significant price move. In its simplest form, it is the last opposing candle before an impulsive move that breaks market structure.
Here is what that means in practical terms. When a large institution such as a bank or hedge fund wants to buy millions of shares or contracts, they cannot do it in a single order. The market does not have enough liquidity at any single price level to fill that kind of size without moving the price against them. So they break their orders into smaller pieces and execute them over a period of time, often within a tight price range. That accumulation period creates what we call an order block.
Key Definition
An order block is the last bearish candle before a strong bullish move (bullish order block) or the last bullish candle before a strong bearish move (bearish order block). The zone defined by the open and close of that candle represents a concentration of unfilled institutional orders. When price revisits this zone, it often reacts because those orders are still resting there.
The concept originates from the Inner Circle Trader (ICT) methodology and has become a cornerstone of smart money concepts (SMC) trading. Unlike traditional support and resistance levels which are identified by horizontal price levels where price has bounced before, order blocks are identified by the specific candle structure and the displacement that follows it.
Think of it this way. A support level tells you "price has bounced here before." An order block tells you "an institution placed large orders here, and those orders may not be fully filled yet." The second is a more specific, actionable piece of information.
Why Order Blocks Form (Institutional Order Flow)
To understand order blocks, you need to understand how institutional traders execute orders. This is not about conspiracy theories or "the market is rigged" thinking. It is about the practical reality of moving large amounts of capital in a market with finite liquidity.
The Liquidity Problem
A retail trader buying 100 shares of AAPL will get filled instantly at the market price. The order is tiny relative to the available liquidity. But when a hedge fund wants to build a $500 million position in a stock, the math changes dramatically. If they placed a single market order, the price would spike before they could get a reasonable average fill. They would effectively buy the price up against themselves.
Instead, institutions use algorithms that break their orders into smaller pieces and execute them over time, absorbing available liquidity gradually. They often execute during periods of consolidation or during opposing price action, because that is when the other side of their trade (sellers, in the case of a buy program) is most active.
How This Creates Order Blocks
When an institution accumulates buy orders during a period of selling pressure, you see bearish candles on the chart while smart money is actually buying. The last bearish candle before the price explodes upward represents the final phase of accumulation, where the institution has absorbed enough sell-side liquidity to trigger the impulsive move. That candle, and the price zone it defines, is the bullish order block.
The reverse is true for distribution. During an uptrend, the last bullish candle before a sharp selloff represents the zone where an institution finished distributing sell orders. That is the bearish order block.
Why Price Reacts at Order Blocks
Institutions often cannot fill their entire position in a single pass. Unfilled orders remain resting at the order block price zone. When price returns to that zone, those resting orders become active again, creating buying pressure (at a bullish order block) or selling pressure (at a bearish order block). Additionally, other institutional traders who use the same methodology will place their own orders at recognized order block zones, amplifying the reaction.
This is why order block analysis ties directly into volume analysis. If you see elevated volume at the candle that forms the order block, it confirms that significant institutional activity occurred there. When price returns, the volume reaction further validates the zone.
Bullish Order Blocks vs. Bearish Order Blocks
Order blocks come in two types, each signaling a different directional bias. Understanding the distinction is critical because trading the wrong type against the trend is one of the most common mistakes in order block trading.
Bullish Order Block
A bullish order block is the last bearish (down/red) candle before a strong upward impulsive move that breaks market structure. The zone is defined by the open and close of that bearish candle. Some traders extend the zone to include the wick (high to low of the candle) for a wider entry area.
- What it represents: Institutional buy orders accumulated during selling pressure
- How to trade it: Look for long entries when price pulls back into the zone
- Where it appears: At the base of strong bullish impulse moves, typically after a period of consolidation or a downtrend reversal
- Confirmation: The move away from the order block should break a previous swing high (break of structure to the upside)
Bearish Order Block
A bearish order block is the last bullish (up/green) candle before a strong downward impulsive move that breaks market structure. The zone is defined by the open and close of that bullish candle.
- What it represents: Institutional sell orders distributed during buying pressure
- How to trade it: Look for short entries when price rallies back into the zone
- Where it appears: At the top of strong bearish impulse moves, typically after a period of consolidation or an uptrend reversal
- Confirmation: The move away from the order block should break a previous swing low (break of structure to the downside)
Common Mistake
Not every candle before a move is a valid order block. The move must be impulsive (not gradual) and must break market structure (take out a previous swing high or low). Without these two conditions, you are likely looking at normal price action, not an institutional footprint. This single filter eliminates the majority of false order block signals.
How to Identify Valid Order Blocks on a Chart
Identifying order blocks is straightforward in theory but requires discipline in practice. Most of the order blocks you mark on a chart will not produce a tradeable reaction. The key is filtering for the valid ones using a clear set of criteria.
Step 1: Identify the Impulsive Move
Start by finding a strong, impulsive price move on your chart. This is a sharp, decisive move, not a gradual grind. An impulsive move typically consists of large-bodied candles with small wicks, moving in one direction with minimal pullback. In smart money concepts, this is called displacement.
If the move is gradual with multiple small candles and significant overlapping wicks, it is unlikely to have been driven by an institutional order block. Skip it.
Step 2: Confirm the Break of Structure
The impulsive move must break market structure. For a bullish order block, the upward move must take out a previous swing high. For a bearish order block, the downward move must take out a previous swing low. This break of structure confirms that the move had enough institutional force behind it to shift the market's direction.
Step 3: Locate the Last Opposing Candle
Once you have confirmed displacement and a break of structure, find the last opposing candle before the move began. For a bullish setup, this is the last bearish (red) candle. For a bearish setup, this is the last bullish (green) candle. The zone from the open to the close of this candle is your order block.
Step 4: Validate the Zone
Apply these filters to determine if the order block is worth trading:
- Freshness: The order block should not have been tested before. The first revisit of the zone is the highest probability trade. Once an order block has been touched, the resting orders are likely filled and the zone loses its power.
- Alignment with trend: Trade bullish order blocks in an uptrend and bearish order blocks in a downtrend. Counter-trend order blocks have a significantly lower success rate.
- Presence of a fair value gap: If the impulsive move that left the order block also created a fair value gap (FVG), the setup is stronger. The FVG confirms the displacement was genuine and not just a stop hunt.
- Higher timeframe confluence: An order block on the 1-hour chart that aligns with a daily-chart order block or key support/resistance level is more reliable than one that stands alone.
How to Trade Order Blocks (Step-by-Step Strategy)
Identifying order blocks is only half the equation. The other half is having a structured trade plan that defines your entry, stop loss, and target before you enter the position. Here is a complete order blocks strategy you can apply to any market.
Bullish Order Block Strategy
Step 1: Establish the Higher Timeframe Bias. Open the daily or 4-hour chart and determine the prevailing trend. You want to see higher highs and higher lows, confirming a bullish market structure. Only look for bullish order blocks when the higher timeframe is bullish.
Step 2: Drop to the Entry Timeframe. Switch to the 1-hour, 30-minute, or 15-minute chart. Look for a recent impulsive bullish move that broke structure (took out a swing high). Identify the last bearish candle before that move. Mark the zone from the open to the close of that candle as your bullish order block.
Step 3: Wait for the Retest. Do not chase the move. Wait for price to pull back into the order block zone. Patience is critical here. Many traders enter too early or too late. The order block zone is your entry area, and you wait for price to come to you.
Step 4: Confirm the Entry. When price reaches the order block, look for a confirmation signal on the lower timeframe (5-minute or 1-minute). This could be a bullish engulfing candle, a pin bar rejection, a shift in short-term market structure, or increasing volume at the zone. Do not enter blindly. The confirmation reduces the number of trades that would stop you out.
Step 5: Set Your Stop Loss. Place your stop loss below the low of the order block candle. This is non-negotiable. If price breaks below the entire order block zone, the thesis is invalidated and the institutional orders are likely fully absorbed. A common refinement is to add a small buffer (5-10 pips or a few cents depending on the instrument) below the order block low to account for stop hunts.
Step 6: Define Your Target. Aim for the next liquidity target above. This could be the previous swing high, an opposing order block, a fair value gap that needs filling, or a key resistance level. A minimum reward-to-risk ratio of 2:1 is recommended. If the setup does not offer at least 2:1, skip it. Understanding where these liquidity pools sit — and how price sweeps them — is covered in depth in our liquidity sweeps trading guide.
Bearish Order Block Strategy
The bearish strategy mirrors the bullish one. Establish a bearish higher timeframe bias. Drop to a lower timeframe and find the last bullish candle before a strong bearish displacement that broke structure to the downside. Wait for price to rally back into that order block zone. Confirm with a bearish rejection candle on the lower timeframe. Set your stop loss above the order block high. Target the next downside liquidity level with a minimum 2:1 reward-to-risk ratio.
Risk Management
No order block strategy works 100% of the time. Even the best setups will produce losing trades. The key to long-term profitability is proper position sizing and risk management. Limit your risk to 1-2% of your account per trade. If you are unsure about position sizing, use ChartingLens's AI assistant to help calculate the appropriate position size based on your account balance, entry price, and stop loss level.
To validate an order block strategy before risking real capital, you can backtest a strategy using ChartingLens's plain-English backtester. Describe your order block setup in natural language and test it across historical data to see win rate, average return, and maximum drawdown.
Order Blocks vs. Supply and Demand Zones: What's the Difference?
This is one of the most common points of confusion in price action trading. Order blocks and supply and demand zones share the same underlying principle, that institutional activity creates price levels the market respects, but they differ in how they are defined, how precise they are, and when they are valid.
Supply and Demand Zones
- Defined by the full consolidation range before an impulsive move
- Broader zones, typically spanning multiple candles
- Can form without a break of market structure
- Come from Sam Seiden's methodology and traditional price action analysis
- Tend to produce wider entry zones with wider stop losses
Order Blocks
- Defined by a single candle (the last opposing candle before displacement)
- More precise zones, typically the body of one candle
- Require a break of market structure and displacement to be valid
- Come from the ICT/smart money concepts methodology
- Tend to produce tighter entry zones with tighter stop losses
In practice, many experienced traders use both. A supply or demand zone provides the general area of interest, while the order block within that zone provides the precise entry. When the two overlap, the setup is significantly stronger because you have both a macro and micro institutional footprint at the same price level.
The practical advantage of order blocks is their precision. Because the zone is defined by a single candle, your stop loss is tighter, which means your reward-to-risk ratio is better. The tradeoff is that the zone is smaller, so price may not always reach it exactly before reversing. This is why some traders use the full candle range (including wicks) as the order block zone rather than just the body.
Best Timeframes and Confirmation Signals
Order blocks form on every timeframe, from the 1-minute chart to the monthly chart. But not all timeframes are equal in reliability. Here is how to think about timeframe selection for order block trading.
Higher Timeframes (Daily, Weekly, Monthly)
Order blocks on these timeframes represent the largest institutional positions and carry the most weight. A daily order block represents a full day of institutional accumulation or distribution. A weekly order block represents an entire week. These zones tend to produce the strongest reactions because the volume behind them is massive.
The downside is that price may take days or weeks to return to a higher timeframe order block, and the stop loss distance will be larger in absolute terms. These are best for swing traders and position traders who can hold trades for multiple days.
Medium Timeframes (1-Hour, 4-Hour)
This is the sweet spot for most order block traders. The 1-hour and 4-hour charts offer a good balance between reliability and frequency. You get enough setups to stay active without drowning in noise. Most order block strategies taught in smart money concepts education focus on these timeframes for entry identification.
Lower Timeframes (1-Minute, 5-Minute, 15-Minute)
Lower timeframe order blocks are best used for refining entries after you have identified a setup on a higher timeframe. For example, if the daily chart has a bullish order block and price is approaching it, you might drop to the 15-minute chart to look for a bullish order block forming within the daily zone. This nested approach gives you a much tighter entry and stop loss.
Avoid trading lower timeframe order blocks in isolation. The noise-to-signal ratio on the 1-minute and 5-minute charts is high, and many apparent order blocks on these timeframes are simply random candle patterns without institutional backing.
Confirmation Signals to Stack With Order Blocks
An order block alone is a zone of interest. Confirmation signals turn it into a trade trigger. The strongest confirmations include:
- Lower timeframe break of structure: Price enters the order block, then shifts internal structure in the expected direction (the strongest confirmation)
- Rejection candle: A pin bar or engulfing candle at the order block zone showing clear rejection of the level
- Fair value gap fill: If a FVG sits between current price and the order block, the FVG filling adds confluence to the trade
- Volume spike: A surge in volume at the order block zone confirms institutional re-engagement
- Divergence: RSI or MACD divergence at the order block zone suggests momentum is exhausting, supporting a reversal from the zone
How to Detect Order Blocks Automatically With AI
The biggest practical challenge with order block trading is the manual effort required. Scanning charts across multiple timeframes and instruments, validating each potential order block against your criteria, and monitoring for retests is time-intensive work. This is where AI changes the equation.
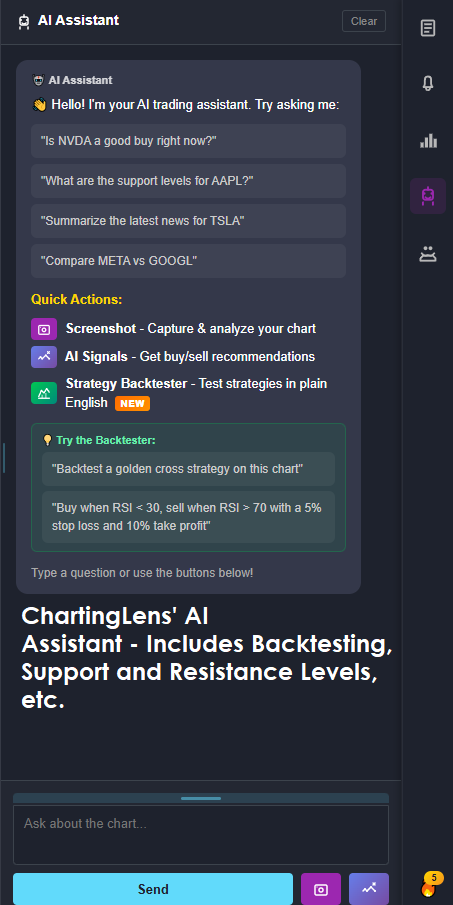
ChartingLens's AI Chat can detect and draw order block zones directly on your chart. The process is simple: open any chart and ask the AI to find order blocks.
How It Works
Type a natural language command into the AI Chat, such as:
- "Show me the order blocks"
- "Detect order blocks on this chart"
- "Where are the bullish order blocks on the 4-hour?"
- "Mark the bearish order blocks from the last month"
The AI analyzes the chart using the same criteria described in this guide: displacement, break of structure, last opposing candle identification, and zone freshness. It then draws locked rectangles directly on your chart, anchored to the specific price and time coordinates of each valid order block. These rectangles stay fixed on your chart as you scroll and zoom, giving you persistent visual reference points.
Combining AI Order Blocks With Other Tools
The real power comes from combining AI-detected order blocks with other ChartingLens features:
- AI Support and Resistance: Ask the AI to draw support and resistance levels alongside order blocks. When an order block aligns with a key S/R level, the confluence makes the zone significantly stronger.
- Fair Value Gap Detection: Have the AI identify FVGs near your order blocks for additional confluence.
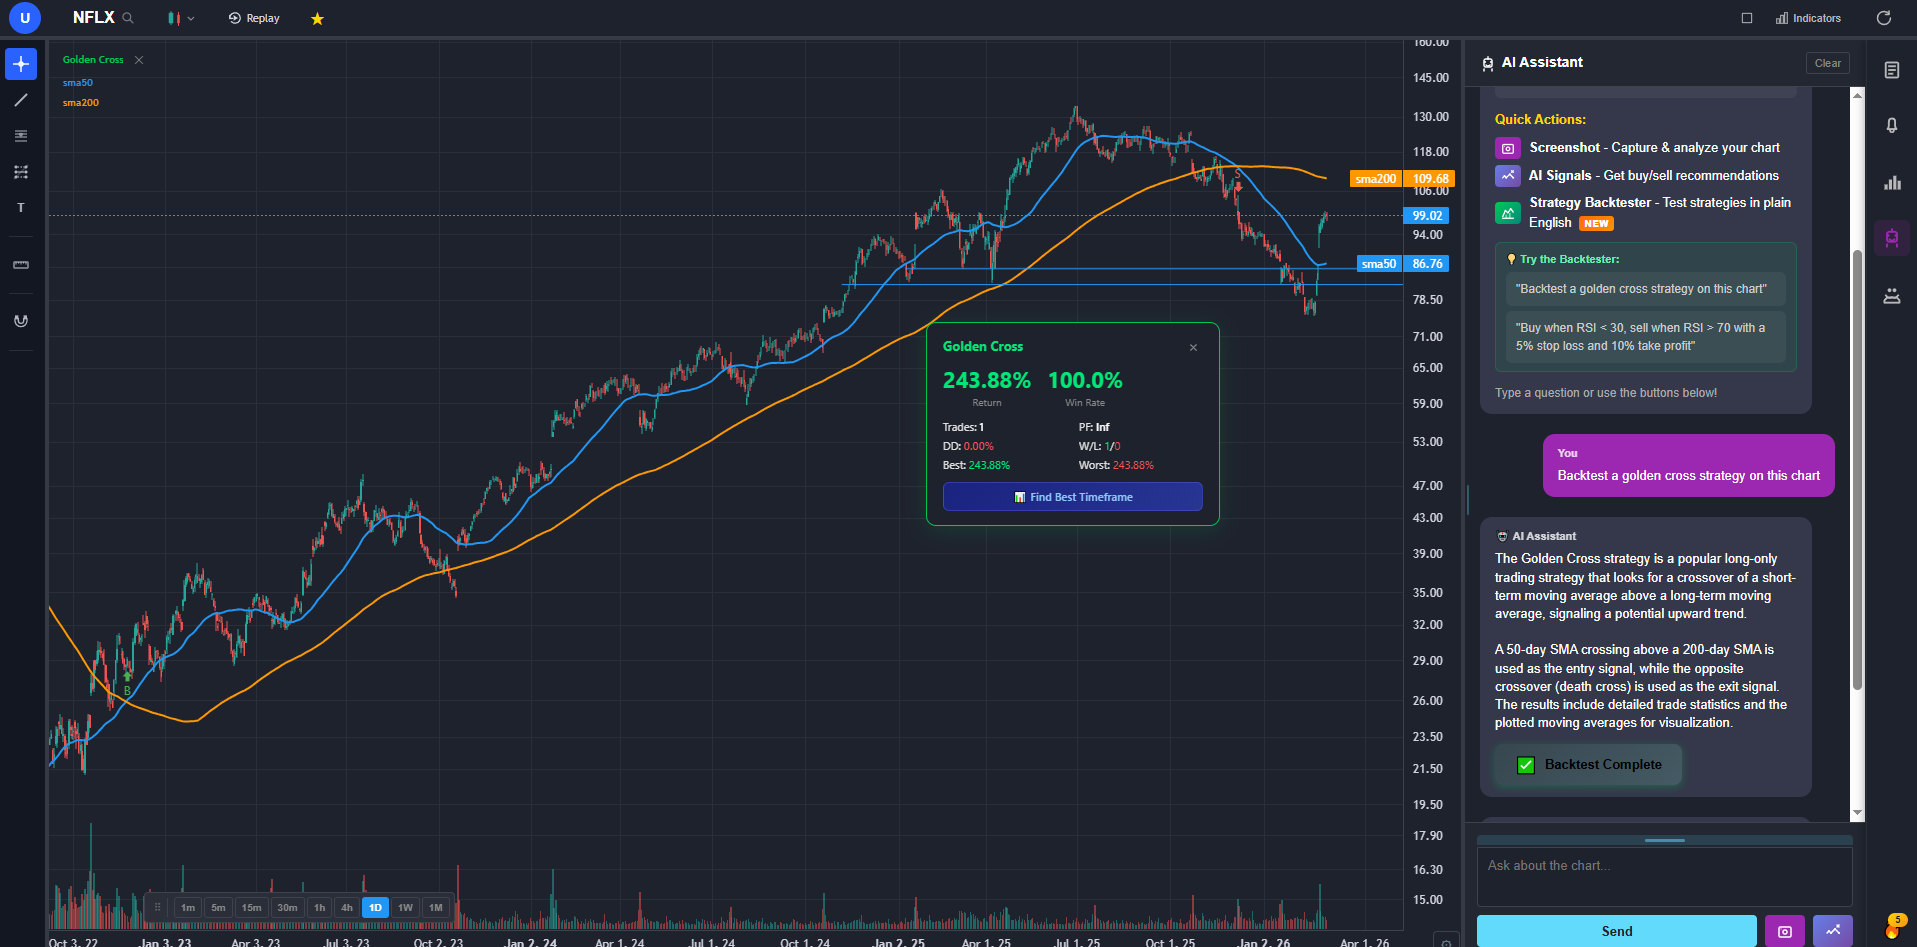
- Plain-English Backtesting: Test your order block strategy historically. Ask something like "backtest buying at bullish order blocks on the daily chart with a 2:1 take profit" and the AI will run the numbers across your chart's history.
- Bar Replay: Practice trading order blocks in real-time simulation using ChartingLens's bar replay feature. Step through historical price action candle by candle to build pattern recognition without risking real money.
This combination of automated detection and manual verification creates a workflow that is both efficient and disciplined. The AI handles the heavy lifting of scanning and marking, while you make the final decision on which setups meet your criteria for entry.
Frequently Asked Questions
Related Articles
Ready to Detect Order Blocks Automatically?
ChartingLens AI identifies and draws order block zones directly on your chart. Just ask the AI assistant and get institutional-grade analysis in seconds.
Try ChartingLens Free