1. Market Structure Is the Order of the Swing Points
Every smart money concept, every ICT setup and most of classical technical analysis rests on one idea: a trend is nothing more than the order of the swing points. Higher swing highs and higher swing lows are an uptrend. Lower highs and lower lows are a downtrend. Anything else is a range. Before liquidity, order blocks or fair value gaps mean anything, you need to be able to look at a chart and say which of those three it is.
A swing high is a bar whose high is higher than the bars on either side of it; a swing low is the mirror. Mark them and join consecutive highs to each other and consecutive lows to each other, and the structure of the chart appears on its own. That is all market structure is. Break of structure and change of character are just the two things that can happen to that order: it can continue, or it can flip.
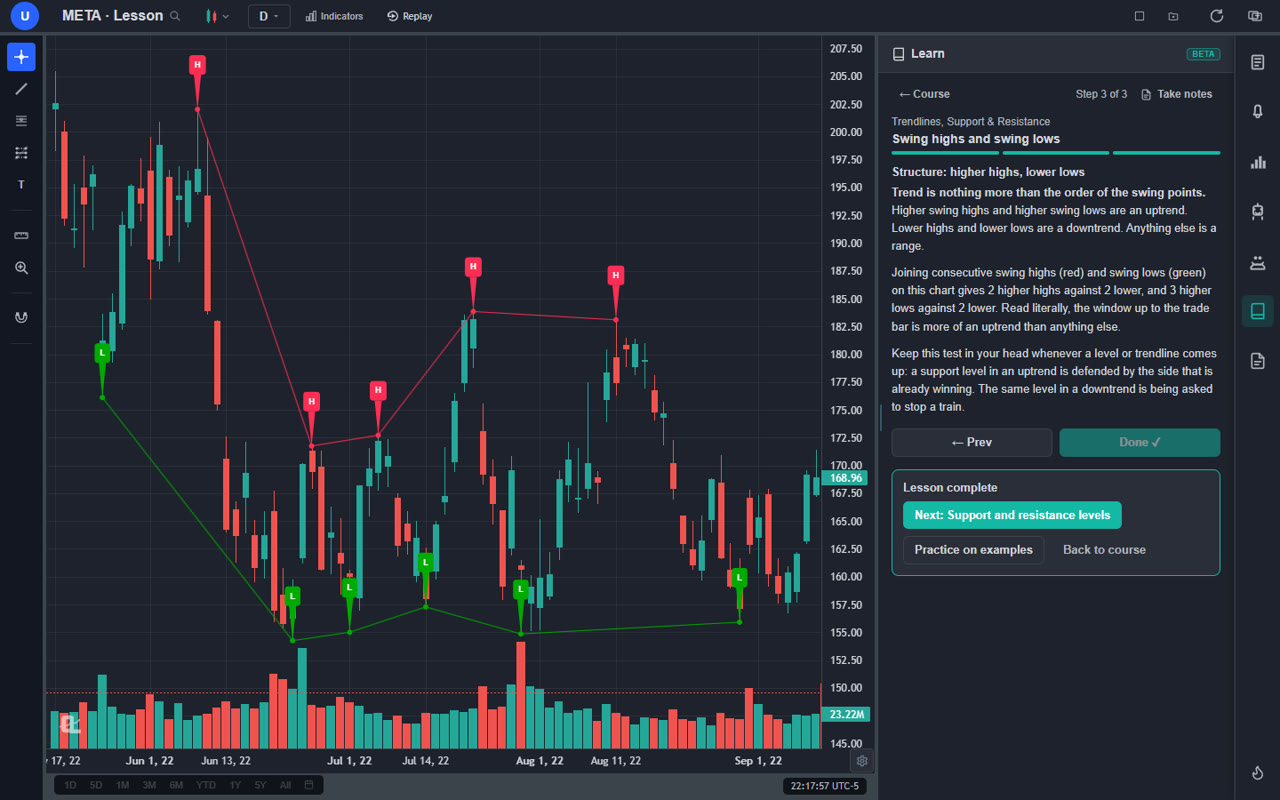
If the swing points themselves still feel arbitrary, the support and resistance guide and the free Learn course it links to start from exactly there. This article assumes you can mark them and moves on to what the breaks mean.
2. Break of Structure (BOS): The Trend Confirms Itself
A break of structure is price continuing in the direction of the existing trend by breaking the most recent swing point in that direction. In an uptrend, a BOS is a close above the previous swing high, making a new higher high. In a downtrend, it is a close below the previous swing low.
That is the whole definition, and its plainness is the point. A BOS does not predict anything new. It confirms that the side that was winning is still winning. Buyers who were in control made another higher high; the pullback before it was a higher low. The trend has not changed character, and the correct response is to keep looking for entries in the trend's direction.
What a BOS gives you is a fresh reference. The pullback that follows a bullish BOS is where continuation entries live: an order block or a fair value gap left behind by the move that broke structure. The swing low that started that move becomes the level a change of character would need to break. Every BOS resets both of those.
3. Change of Character (CHoCH): The First Crack
A change of character is the first break against the trend. In an uptrend, price has been making higher highs and higher lows. A CHoCH is the moment it closes below the most recent higher low, printing the first lower low of what was an uptrend. In a downtrend, it is a close above the most recent lower high.
Notice what a CHoCH is not. It is not a reversal. It is the first sign that the trend may be reversing, which is a much weaker claim, and treating it as a confirmed reversal is the most expensive habit in structure trading. An uptrend with one lower low can absolutely make a new higher high next week. What has changed is that the side that was winning just failed to defend a level it had defended every time before.
The right way to read a CHoCH is as a change of what you are looking for. Before it, you were looking for longs on pullbacks. After it, you stop looking for longs and start watching for a bearish setup on the first rally: a pullback into the order block or gap that the CHoCH move created, ideally with a liquidity sweep to go with it. The CHoCH does not put you short. It gives you permission to look.
4. BOS vs CHoCH Side by Side
| Break of structure (BOS) | Change of character (CHoCH) | |
|---|---|---|
| Direction | With the trend | Against the trend |
| Level broken | The most recent swing high (uptrend) or swing low (downtrend) | The most recent higher low (uptrend) or lower high (downtrend) |
| What it says | The trend is intact; the winning side just proved it again | The winning side failed to defend a level for the first time |
| What you do next | Look for a continuation entry on the pullback | Stop trading with the old trend; wait for a setup in the new direction |
| Strength of the signal | Confirmation, common | Warning, meaningful, not proof |
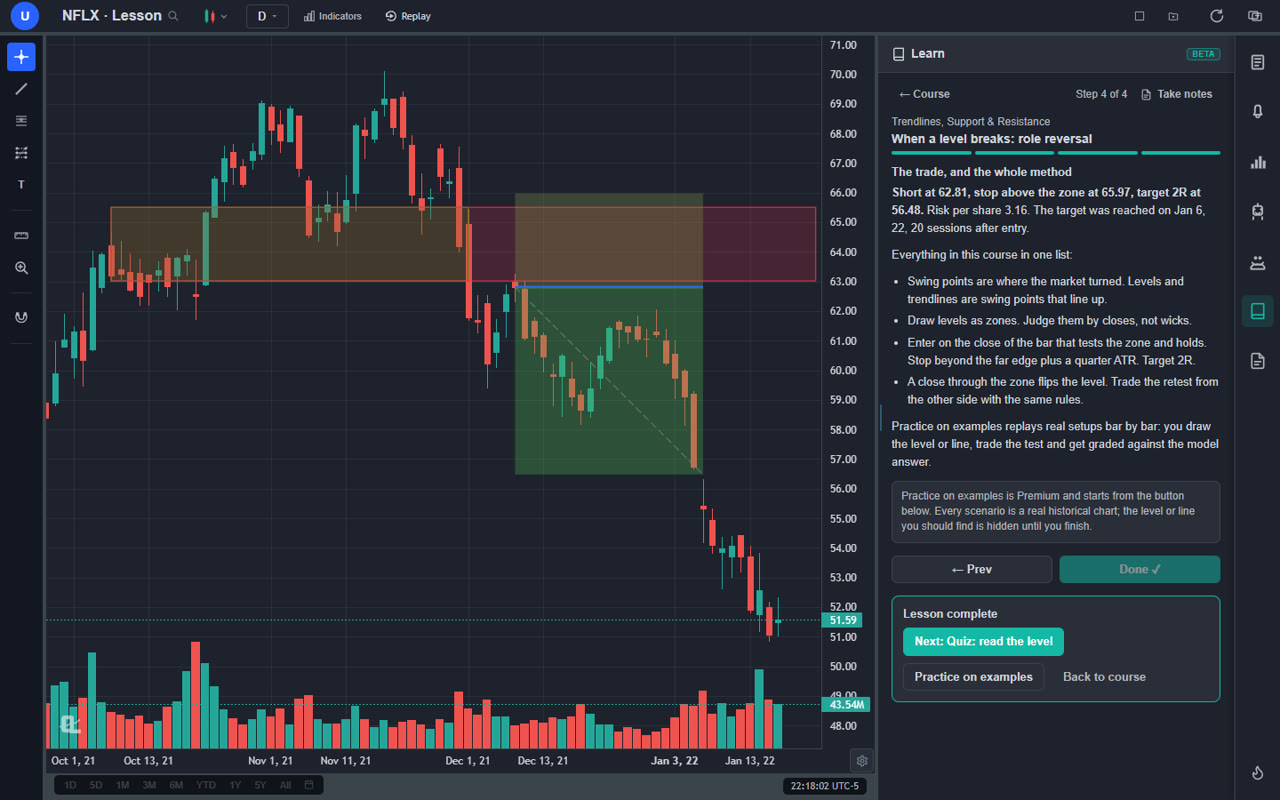
One way to keep them straight: the same break can be a BOS or a CHoCH depending only on which way the trend was going. A close below a swing low in a downtrend is a BOS. A close below a swing low in an uptrend is a CHoCH. The candle is the same. The context is everything.
5. What Counts as a Break: Wicks, Closes and Internal Structure
This is where most structure traders go wrong, and it deserves its own section.
Close, Not Wick
A wick through a swing point is not a break. It is, very often, a liquidity sweep: stops above the high get run and price closes back below it. If you count wicks as breaks you will mark a CHoCH on every sweep and flip your bias a dozen times a week. The standard that holds up is a candle body closing through the level on the timeframe you are analysing. Wicks are information, but they are information about liquidity, not structure.
Swing Structure vs Internal Structure
Inside every leg of a trend there are smaller swings. A pullback in an uptrend is made of its own little lower highs and lower lows. Those are internal structure, and internal breaks happen constantly. A change of character only means something when it breaks a swing low: the low that started the last leg up, the one that a higher-timeframe trader would mark. If you are unsure which low counts, zoom out one timeframe. The low that is still obvious there is the swing low.
Equal Highs and Lows
When two swing highs sit at nearly the same price, the stops above them are a large, obvious pool of liquidity. A close through equal highs in an uptrend is a BOS, but a wick through them followed by a close back below is the classic sweep. Treat equal highs and lows as places where the difference between a wick and a close matters most. The liquidity sweep guide goes deeper on reading those moments.
6. Structure on Two Timeframes
Structure is fractal, and the method only works when you keep the timeframes separate in your head. The higher timeframe sets the bias: on the daily or 4-hour chart, is the last break a BOS or a CHoCH, and which way? The lower timeframe finds the entry: on the 15-minute or 5-minute chart, wait for a CHoCH in the direction of the higher-timeframe bias, then enter on the pullback.
That second step is the part people miss. A bullish daily structure means you want to buy pullbacks. The pullback on the 15-minute chart is itself a small downtrend, with lower highs and lower lows. The moment that small downtrend prints a CHoCH (a close above its last lower high) is the moment the pullback is likely over and the daily trend is resuming. A lower-timeframe CHoCH in the direction of the higher-timeframe trend is the highest-quality continuation signal in the whole method, and it is just the two ideas in this article stacked on top of each other.
7. How to Trade BOS and CHoCH
The structure playbook
- Mark the swings on the higher timeframe and name the trend: up, down or range.
- Find the last break. BOS means continuation is the plan. CHoCH means wait for the first pullback in the new direction.
- Drop one timeframe and wait for the pullback against the higher-timeframe direction.
- Wait for the lower-timeframe CHoCH that ends the pullback, ideally after a sweep of a nearby low or high.
- Enter on the retest of the order block or fair value gap the CHoCH candle left behind.
- Stop beyond the swing that started the move, target the next higher-timeframe liquidity, minimum two to one.
Trading a BOS
After a bullish BOS, wait. The break itself is not the entry; the pullback after it is. Price usually comes back to fill some of the gap the breaking move left, or to retest the order block at its origin. Enter there, with the stop below the swing low that started the leg, and target the next swing high or liquidity pool above. If the pullback goes all the way back through the swing low, that is a CHoCH, and the plan is off.
Trading a CHoCH
After a bearish CHoCH in an uptrend, do not short the break. Wait for the first rally. That rally is a pullback in a new, unconfirmed downtrend, and it will usually reach the bearish order block or fair value gap created by the CHoCH move. Short there, with the stop above the high that preceded the CHoCH, and target the low the CHoCH broke and then the liquidity below it. If the rally instead closes above that prior high, the CHoCH failed and the uptrend is intact.
Both trades are the same shape as every other ICT entry: a break, a pullback into the imbalance it left, and a retest. If the retest entry is new to you, the OTE guide and the fair value gap guide cover where exactly inside the pullback to enter.
8. Common Mistakes
Calling Every Wick a Break
Covered above and worth repeating. Bodies break structure; wicks sweep liquidity. If your chart has a CHoCH every few bars, you are counting wicks.
Trading the CHoCH as a Reversal
A change of character is a warning. Shorting the CHoCH candle in an uptrend puts you short at the worst place, into the first pullback, with a stop that every trapped buyer is aiming at. Wait for the rally into the imbalance.
Mixing Internal and Swing Structure
Marking the minor lows inside a pullback as swing lows produces false CHoCH signals constantly. If a low is not obvious one timeframe up, it is internal.
No Higher-Timeframe Bias
A 5-minute BOS against a daily downtrend is a scalp against the flow. Structure on the entry timeframe only means something inside the structure of the timeframe above it.
Never Practising the Read
Marking swings on a finished chart is easy. Deciding in real time whether the low that just printed is a swing low or noise is the actual skill. Replaying real charts bar by bar, marking structure as it forms and grading yourself afterwards is the only way I know to build it. The practice guide covers the tools.
9. Reading Structure in ChartingLens
ChartingLens is a well-established charting platform with a large, active user base, and structure reading is built into it from the first lesson.
Start With the Swing Points Lesson
The Trendlines, Support & Resistance course in the Learn panel opens with a lesson on swing highs and swing lows and ends that lesson with structure: higher highs, lower lows, and what makes a trend. Every step is drawn on a real historical chart, like the META example above. It is free with an account and takes a few minutes.
Ask the AI to Mark Structure
The AI assistant reads the live chart. Ask it to detect Smart Money Concepts and it marks the recent break of structure and change of character, the order blocks and the fair value gaps that go with them, directly on the candles. Ask a follow-up question ("was that a wick or a close through the low?") and it answers from the actual data on screen. It is a fast second opinion when you are unsure whether a break counts.
Alerts on the Swing Points
Put a horizontal line on the swing low a CHoCH would need to break and set a price alert on it. ChartingLens tells you the moment price gets there, so you can watch for the close rather than the wick. Then rehearse the whole read in the bar replay simulator, one candle at a time, and test the rules with the plain-English strategy builder and its institutional-grade backtesting engine before trusting them with money.
Putting It All Together
Market structure is the order of the swing points. A break of structure keeps that order and confirms the trend; a change of character breaks it and warns that the trend may be ending. Use closes, not wicks. Use swing lows, not internal ones. Set the bias on the higher timeframe, find the entry on the lower one, and enter on the pullback into the imbalance the break created, never on the break itself. That is the entire grammar of smart money trading, and everything else is vocabulary.