What Is ICT Trading? (Inner Circle Trader Explained)
ICT trading is a methodology developed by Michael J. Huddleston, a trader and educator who goes by the name Inner Circle Trader (ICT) online. Over the past decade, ICT has become one of the most widely studied and debated approaches to trading, particularly among forex and futures traders. The methodology has expanded into equities, crypto, and indices as its concepts apply to any liquid market where institutional participants drive price.
At its core, the ICT trading strategy is built on a single premise: retail traders lose money because they do not understand how institutional traders and market makers operate. Banks, hedge funds, and algorithmic trading firms do not trade the way retail traders are taught to trade. They need liquidity to fill large orders, and they engineer price movements to access that liquidity. ICT teaches traders to read the footprints that institutions leave on price charts and to position themselves on the same side as smart money.
Unlike traditional technical analysis that relies on lagging indicators like moving averages and RSI, the ICT method focuses on price action, time, and the structural mechanics of how markets move. ICT traders study where liquidity pools form, how price delivers to those pools, and what happens after liquidity is taken. This creates a framework for anticipating price movement rather than reacting to it after the fact.
The ICT methodology includes dozens of specific concepts, but the most important ones fall into a few core categories: market structure, liquidity, order blocks, fair value gaps, optimal trade entry, and kill zones. This guide breaks down each one in detail and shows you how to apply them in a real trading workflow.
One important distinction: ICT is not an indicator or a signal service. It is a way of reading price. Learning ICT requires studying how candles form, how structure shifts, and how time aligns with institutional activity. The payoff is a deeper understanding of why price moves — not just where it moved in the past. If you want to follow along on a live chart, every concept in this guide can be plotted automatically on a free ChartingLens account — no credit card required.
The Core Principles of ICT Trading
Before diving into specific ICT concepts, it helps to understand the foundational principles that underpin the entire methodology. Every ICT setup, entry model, and trade plan is built on top of these ideas.
Price Is Delivered to Liquidity
The single most important principle in ICT trading is that price moves toward liquidity. Liquidity, in this context, means clusters of stop-loss orders sitting above swing highs (buy-side liquidity) or below swing lows (sell-side liquidity). Institutional traders need to fill large orders, and they cannot do so without triggering these stop clusters. The ICT method teaches you to identify where liquidity pools exist and anticipate that price will be delivered to those levels before reversing.
The Market Is Not Random
ICT rejects the idea that short-term price movement is random noise. Instead, the methodology argues that price follows an algorithm — a repeating pattern of accumulation, manipulation, and distribution. Smart money accumulates positions quietly, then engineers a false move (manipulation) to trigger retail stops and create liquidity, then distributes into the move that follows. This three-phase cycle appears on every timeframe.
Time and Price Are Connected
Unlike most trading methodologies that focus only on price levels, ICT places heavy emphasis on when price reaches key levels. Specific times of day — known as kill zones — are when institutions are most active and when the highest-probability setups form. A perfect price level at the wrong time of day is not a valid ICT trade. This time-based filtering is one of the most distinctive aspects of the methodology.
Higher Timeframes Control Lower Timeframes
ICT uses a top-down analysis framework. The daily and 4-hour charts establish the overall direction — the institutional order flow bias. The 1-hour chart provides structure context. The 15-minute and 5-minute charts are used for precision entries. An ICT trader never takes a 5-minute entry that contradicts the daily bias. This multi-timeframe alignment is what separates ICT from lower-probability scalping approaches.
Key Takeaway
ICT trading is not about finding patterns on a chart — it is about understanding the algorithm of price delivery. Smart money needs liquidity to operate, and price is engineered to reach that liquidity at specific times. Every ICT concept builds on this foundation.
Market Structure in ICT: Higher Highs, Lower Lows, BOS and CHoCH
Market structure is the backbone of the ICT trading strategy. Before analyzing liquidity, order blocks, or fair value gaps, you need to understand what the market is doing at a structural level. Is it trending up? Trending down? Ranging? And most critically — is the structure shifting?
Bullish and Bearish Market Structure
In ICT terms, bullish market structure consists of a series of higher highs (HH) and higher lows (HL). Each new swing high exceeds the previous one, and each pullback holds above the previous swing low. As long as this pattern continues, the bias is bullish.
Bearish market structure is the mirror: lower lows (LL) and lower highs (LH). Each new swing low breaks below the previous one, and each rally fails to exceed the previous swing high. The bias remains bearish until structure shifts.
Break of Structure (BOS)
A break of structure (BOS) occurs when price continues in the direction of the existing trend by breaking a key swing point. In a bullish trend, a BOS happens when price creates a new higher high by breaking above the previous swing high. In a bearish trend, BOS occurs when price makes a new lower low by breaking below the previous swing low. A BOS confirms that the current trend is intact and continuing.
Change of Character (CHoCH)
A change of character (CHoCH) is the first sign that the prevailing trend may be reversing. In a bullish trend, a CHoCH occurs when price breaks below the most recent higher low — the first lower low in what was an uptrend. In a bearish trend, a CHoCH occurs when price breaks above the most recent lower high.
CHoCH is one of the most important signals in ICT trading because it indicates a potential shift in institutional order flow. When you see a CHoCH on the higher timeframe, it tells you that the smart money bias may be changing. This is when you start looking for entries in the new direction on the lower timeframe.
BOS vs. CHoCH — Quick Reference
BOS (Break of Structure): Price breaks a swing point in the direction of the trend, confirming continuation. CHoCH (Change of Character): Price breaks a swing point against the trend, signaling a potential reversal. Always identify these on the higher timeframe first, then use them to frame your lower timeframe entries.
Understanding market structure is essential because every other ICT concept depends on it. You only look for bullish order blocks and bullish fair value gaps when the structure is bullish. You only look for bearish setups when structure is bearish or has shifted bearish via CHoCH. Structure gives you the directional bias — everything else is about finding the optimal entry within that bias.
Do This in ChartingLens
Open any chart and ask the AI assistant to "detect Smart Money Concepts" — it plots Fair Value Gaps, order blocks, BOS/CHoCH levels, and supply and demand zones directly on the candles. You can also ask it to analyze market structure on any timeframe: it identifies the swing highs and lows and tells you whether structure is bullish, bearish, or in transition. This eliminates the guesswork that trips up many ICT traders, especially when structure is ambiguous on a single timeframe. The Market Structure Pro indicator from the Master Pattern Suite tracks BOS and CHoCH shifts continuously if you prefer an always-on overlay.
ICT Liquidity Concepts: Buy-Side, Sell-Side, Sweeps, and Grabs
Liquidity is the central concept in the ICT trading strategy. If you understand nothing else about ICT, understand this: price moves to where the orders are. And the orders are where the stops are. Every swing high has buy stops above it. Every swing low has sell stops below it. Institutional traders need these stop clusters to fill their positions, and they will engineer price movement to reach them.
Buy-Side Liquidity (BSL)
Buy-side liquidity refers to the pool of buy stop orders that accumulate above swing highs, equal highs, and obvious resistance levels. When retail traders place short positions, their stop-loss orders sit above these levels. When the market sweeps above a swing high and triggers these stops, it creates the liquidity that institutions need to fill sell orders. ICT traders watch for price to sweep buy-side liquidity before looking for short entries.
Sell-Side Liquidity (SSL)
Sell-side liquidity is the opposite — the pool of sell stop orders sitting below swing lows, equal lows, and obvious support levels. When retail traders go long, their stops are placed below these levels. A sweep below a swing low triggers those stops, providing institutions with the liquidity they need to fill buy orders. ICT traders watch for price to sweep sell-side liquidity before looking for long entries.
Liquidity Sweeps
A liquidity sweep occurs when price moves beyond a key level — a swing high or swing low — triggers the stop orders resting there, and then reverses. The sweep itself looks like a wick or spike beyond the level. On a candle chart, you might see a candle with a long upper wick that poked above a previous high but closed below it. That wick represents the sweep — institutions used it to fill orders.
Sweeps are one of the highest-probability reversal signals in the ICT methodology. When price sweeps a liquidity pool and then shows a structural shift (CHoCH), it is a strong indication that smart money has taken the liquidity it needed and is now moving price in the opposite direction. For a full playbook on trading this setup, see our dedicated liquidity sweeps trading guide.
Liquidity Grabs
A liquidity grab is similar to a sweep but more aggressive. It involves a sharp, fast move that takes out multiple levels of liquidity in quick succession — often during high-impact news events or at the open of a kill zone session. The grab is designed to trigger as many stops as possible in a short window before reversing hard. Liquidity grabs often create the fair value gaps and order blocks that ICT traders then use as entry zones on the pullback.
The practical application of ICT liquidity concepts is straightforward: before entering any trade, ask yourself where the nearest untapped liquidity pool is. If you are looking to go long, you want to see sell-side liquidity get swept first. If you are looking to go short, you want buy-side liquidity to get taken. This filter alone eliminates a large number of losing trades because it keeps you from entering before institutions have finished their manipulation phase.
You can identify liquidity levels manually by marking swing highs, swing lows, equal highs, and equal lows on your chart. On ChartingLens, the AI assistant can highlight these levels automatically. Ask it to mark key liquidity zones, and it will identify the most significant clusters of untapped stops above and below current price, giving you a clear map of where price is likely headed next.
Do This in ChartingLens
Sweeps are easy to miss in real time because the whole signal is a wick. The Liquidity Sweep Pro indicator from the Master Pattern Suite detects wick rejections at swing highs and lows automatically and marks the sweep on the chart the moment it completes — so you catch the "liquidity taken, now watch for CHoCH" moment instead of spotting it three candles late.
ICT Order Blocks and Fair Value Gaps
Once you understand market structure and liquidity, the next layer of the ICT trading strategy is identifying the specific zones where you want to enter trades. The two most important entry zones in ICT are order blocks and fair value gaps (FVGs).
What Is an ICT Order Block?
An ICT order block is the last opposing candle before a strong impulsive move in price. More specifically:
- Bullish order block: The last bearish (down-close) candle before a strong move up. This candle represents the zone where institutional buyers absorbed all remaining selling pressure and began driving price higher. The body of this candle — from its open to its close — defines the order block zone.
- Bearish order block: The last bullish (up-close) candle before a strong move down. This is where institutional sellers overwhelmed buying pressure. The body of this candle defines the zone.
Order blocks work because institutions cannot fill their entire position in a single candle. They place a large initial order that causes the impulsive move, but they still have unfilled orders at the original price level. When price retraces back to the order block, those unfilled orders get filled, which causes price to bounce off the zone and continue in the direction of the original move.
Not every order block is valid. In ICT, a valid order block must have caused a break of structure (BOS) or a change of character (CHoCH). If the impulsive move from the order block did not break a key swing point, the order block is weak and less likely to hold. The strongest order blocks are those that caused a shift in market structure on the higher timeframe.
What Is a Fair Value Gap (FVG)?
A fair value gap is a three-candle formation where the wicks of the first and third candles do not overlap, leaving an imbalance or gap in the price range. In a bullish FVG, the high of the first candle is lower than the low of the third candle, creating a gap of untraded price between them. In a bearish FVG, the low of the first candle is higher than the high of the third candle.
Fair value gaps represent price inefficiency. When price moves too quickly — usually during an impulsive institutional move — it skips over price levels where no real trading occurred. The ICT methodology teaches that price has a tendency to return to these gaps to "rebalance" before continuing its trend. This makes FVGs excellent entry zones because they give you a precise area to place limit orders with tight stops.
Combining Order Blocks and FVGs
The highest-probability ICT setups occur when an order block and a fair value gap overlap. This overlap creates what ICT traders call a "premium/discount array" — a zone where multiple institutional footprints converge. When you find a bullish order block that contains or is adjacent to a bullish FVG within a bullish market structure, you have a high-confidence long entry zone.
For an in-depth look at how supply and demand zones relate to ICT order blocks, see our dedicated guide. The concepts overlap significantly — supply and demand zones are a broader framework, while ICT order blocks add the specificity of the last opposing candle and the requirement for a structural break.
Order Block + FVG Entry Model
1. Identify the higher timeframe bias (bullish or bearish) using market structure. 2. Find a valid order block that caused a BOS or CHoCH. 3. Look for a fair value gap within or near the order block zone. 4. Wait for price to retrace into the overlapping zone. 5. Enter with a stop below the order block (for longs) or above it (for shorts). This stacking of confluences is what gives ICT entries their edge.
On ChartingLens, the AI assistant can identify order blocks and fair value gaps automatically — ask it to "detect Smart Money Concepts" and it marks the relevant order blocks, FVGs, and the overlap zones where the highest-probability entries exist directly on the candles. You can also use the platform's auto pattern recognition to flag these formations across your watchlist without checking each chart manually.
ICT Optimal Trade Entry (OTE) and Fibonacci
The ICT Optimal Trade Entry (OTE) is a specific Fibonacci retracement zone that ICT identifies as the sweet spot for trade entries. While traditional Fibonacci traders use the 50% or 61.8% retracement levels, ICT narrows the focus to the zone between the 62% and 79% retracement levels. This is the OTE zone.
How the OTE Works
After an impulsive move — say a strong move up that creates a BOS — price will typically retrace before continuing. ICT teaches that the optimal entry point is in the 62% to 79% Fibonacci retracement of that impulse leg. Why this zone specifically? Because it represents the deepest retracement that smart money will allow before re-engaging their orders. Retracements that go beyond 79% often indicate that the original move has failed.
To use the OTE, draw a Fibonacci retracement from the swing low to the swing high of the impulse move (for bullish setups) or from the swing high to the swing low (for bearish setups). The zone between 0.62 and 0.79 on the retracement is your OTE entry area. When price pulls back into this zone and shows signs of rejection — especially if the zone aligns with an order block or FVG — you have a high-probability entry.
OTE Combined With Order Blocks
The OTE becomes even more powerful when it aligns with an order block. If you find that a bullish order block sits right in the 62% to 79% retracement zone of the most recent impulse leg, you have a triple confluence: the OTE zone, the order block, and the structural context of a valid BOS. These are the kinds of setups that ICT traders build their entire strategy around — high confluence, defined risk, and clear invalidation.
ChartingLens includes a Fibonacci retracement drawing tool that makes plotting OTE zones quick and precise. Draw the retracement from swing to swing, and the tool automatically marks the key levels including the 62% and 79% OTE boundaries. Combined with the AI assistant's ability to identify order blocks, you can visually map out your OTE entry zones in seconds rather than minutes.
Premium and Discount Zones
ICT also uses Fibonacci to define premium and discount zones. The 50% level of any trading range divides price into a premium zone (above 50%) and a discount zone (below 50%). In a bullish market, you want to buy in the discount zone — below the 50% level of the current range. In a bearish market, you want to sell in the premium zone — above the 50% level.
This is a simple but effective filter. If you are looking for a long entry but price is in the premium zone of the current range, the risk-to-reward is unfavorable even if all other ICT concepts align. The OTE in the discount zone is the ideal combination: you are buying at a discount with the Fibonacci retracement and structural alignment working in your favor.
ICT Kill Zones: The Best Times to Trade
One of the most distinctive features of the ICT trading strategy is its emphasis on time. ICT identifies specific windows during the trading day when institutional activity is highest and when the best setups form. These windows are called kill zones, and trading outside of them significantly reduces the probability of finding valid ICT setups.
The Four ICT Kill Zones
- Asian Kill Zone (8:00 PM to 12:00 AM EST): The Asian session typically establishes the range that London and New York will later target. ICT traders mark the Asian session high and low because these levels often act as liquidity targets for the next sessions. The Asian range is not usually where you take trades — it is where you identify liquidity.
- London Kill Zone (2:00 AM to 5:00 AM EST): The London open is one of the highest-volume periods in global markets. This is when institutions begin their daily operations, and it is often where the first major liquidity sweep of the day occurs. Many ICT traders focus exclusively on the London kill zone for their entries, especially in forex.
- New York Kill Zone (7:00 AM to 10:00 AM EST): The New York open brings the highest volume of the day as US institutional traders join the market. This kill zone often produces the day's strongest directional move, especially in US equities, indices, and USD pairs. ICT teaches that the New York session often continues the direction established by London or reverses it after sweeping London's highs or lows.
- London Close Kill Zone (10:00 AM to 12:00 PM EST): As London traders close their positions, a second wave of volatility can create reversals or continuation setups. This window is less reliable than the London and New York opens but can produce valid entries, especially on days with strong trending moves.
Why Kill Zones Matter
The reason ICT kill zones are so important is that institutional order flow is concentrated during these windows. Outside of kill zones, price action tends to be choppy, range-bound, and driven by algorithmic noise rather than directional institutional flow. Taking ICT setups during the London or New York kill zone dramatically increases the probability that the move you are trading is backed by real institutional volume.
Many traders who struggle with the ICT method find their results improve significantly when they add a kill zone filter. If you only trade during the New York kill zone (7:00 AM to 10:00 AM EST), you are filtering out most of the low-probability price action that causes false signals and choppy stops.
To practice ICT setups during kill zones without risking real money, ChartingLens offers bar replay with paper trading. You can replay historical price data, fast forward to a kill zone window, identify your ICT setup, enter a paper trade, and see how it plays out — complete with a live P&L tracker. Random Date mode drops you onto an unknown historical session so you practice reading structure blind, with no hindsight bias. This is one of the most effective ways to build confidence in the ICT method before trading live. For more on how to use bar replay, see our guide on how to practice trading.
How to Build an ICT Trading Plan (Step-by-Step)
Understanding ICT concepts individually is one thing. Combining them into a repeatable trading plan is where the real edge comes from. Here is a step-by-step framework for building an ICT-based trading plan that you can follow every trading day.
Step 1: Determine the Higher Timeframe Bias
Start with the daily chart. Identify the current market structure — is it bullish (higher highs, higher lows) or bearish (lower lows, lower highs)? Has there been a recent CHoCH that signals a shift? Mark the most recent BOS levels and note whether price is in a premium or discount zone relative to the current trading range. This gives you your directional bias for the day.
Step 2: Identify Key Liquidity Levels
On the 4-hour and 1-hour charts, mark the swing highs and swing lows that represent untapped liquidity pools. Where are the buy stops above equal highs? Where are the sell stops below equal lows? Also mark the Asian session high and low from the previous night. These are your liquidity targets — the levels where price is likely to be drawn before reversing.
Step 3: Mark Order Blocks and Fair Value Gaps
On the 1-hour and 15-minute charts, identify valid order blocks — the last opposing candles before significant impulsive moves that caused a BOS or CHoCH. Mark any fair value gaps within or near these order blocks. These overlapping zones are your potential entry areas. If the daily bias is bullish, you are looking for bullish order blocks in the discount zone. If bearish, you want bearish order blocks in the premium zone.
Step 4: Wait for the Kill Zone
Do not enter during the Asian session or during off-hours. Wait for the London or New York kill zone to begin. Watch for price to sweep a key liquidity level — ideally the Asian session high or low — and then retrace into your marked order block or FVG zone.
Step 5: Enter on the Lower Timeframe
Drop to the 5-minute or 1-minute chart once price enters your zone. Look for a lower-timeframe CHoCH that confirms institutional re-engagement in your direction. Enter after the CHoCH with a stop-loss below the order block (for longs) or above it (for shorts). Target the opposing liquidity pool — if you entered long after a sell-side sweep, your target is the next buy-side liquidity level above.
Step 6: Manage the Trade
ICT traders typically use fixed risk-to-reward ratios, with a minimum of 1:2 and a target of 1:3 or higher. Some traders trail their stop to breakeven once price moves 1R in their favor. The key is to let the trade reach the liquidity target rather than closing early based on fear. If your setup was valid — correct structure, liquidity sweep, order block entry in a kill zone — give it room to work.
ICT Trading Plan Checklist
1. Daily bias confirmed (bullish/bearish market structure). 2. Key liquidity levels marked (BSL/SSL, Asian range). 3. Order blocks and FVGs identified in premium/discount. 4. Kill zone active (London or New York). 5. Liquidity sweep observed. 6. Lower timeframe CHoCH confirms entry direction. 7. Entry placed with stop below/above order block. 8. Target set at opposing liquidity level. Risk-to-reward minimum 1:2.
How to Apply ICT Concepts Automatically With AI
The biggest challenge with the ICT trading strategy is the amount of manual analysis it requires. You need to identify market structure on multiple timeframes, mark liquidity levels, find order blocks, spot fair value gaps, check Fibonacci alignments, and do it all within a kill zone window. For many traders, the time pressure and complexity lead to missed setups or analysis paralysis.
This is where AI-powered charting tools change the game. ChartingLens — a well-established platform with a large, active user base and a deep set of advanced features, including an institutional-grade strategy builder and an institutional-grade backtesting engine — was built to handle exactly this kind of multi-layered analysis, and its AI assistant can automate the most time-consuming parts of the ICT workflow.
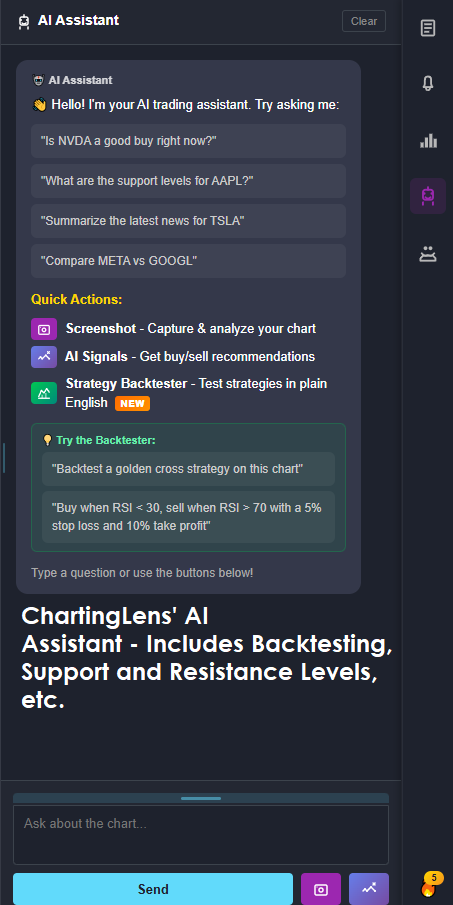
Ask for ICT Levels in Natural Language
ChartingLens's AI assistant understands ICT concepts natively. You can ask it questions like "Where are the key liquidity levels on this chart?" or "Show me the most recent order blocks" or "Is there a fair value gap near current price?" The assistant will analyze the chart and highlight the relevant zones directly on your price chart. No manual drawing required.
You can also ask for market structure analysis: "What is the current market structure on the daily timeframe?" or "Has there been a recent change of character?" The assistant will identify the swing points, label BOS and CHoCH levels, and tell you the directional bias — all in seconds.
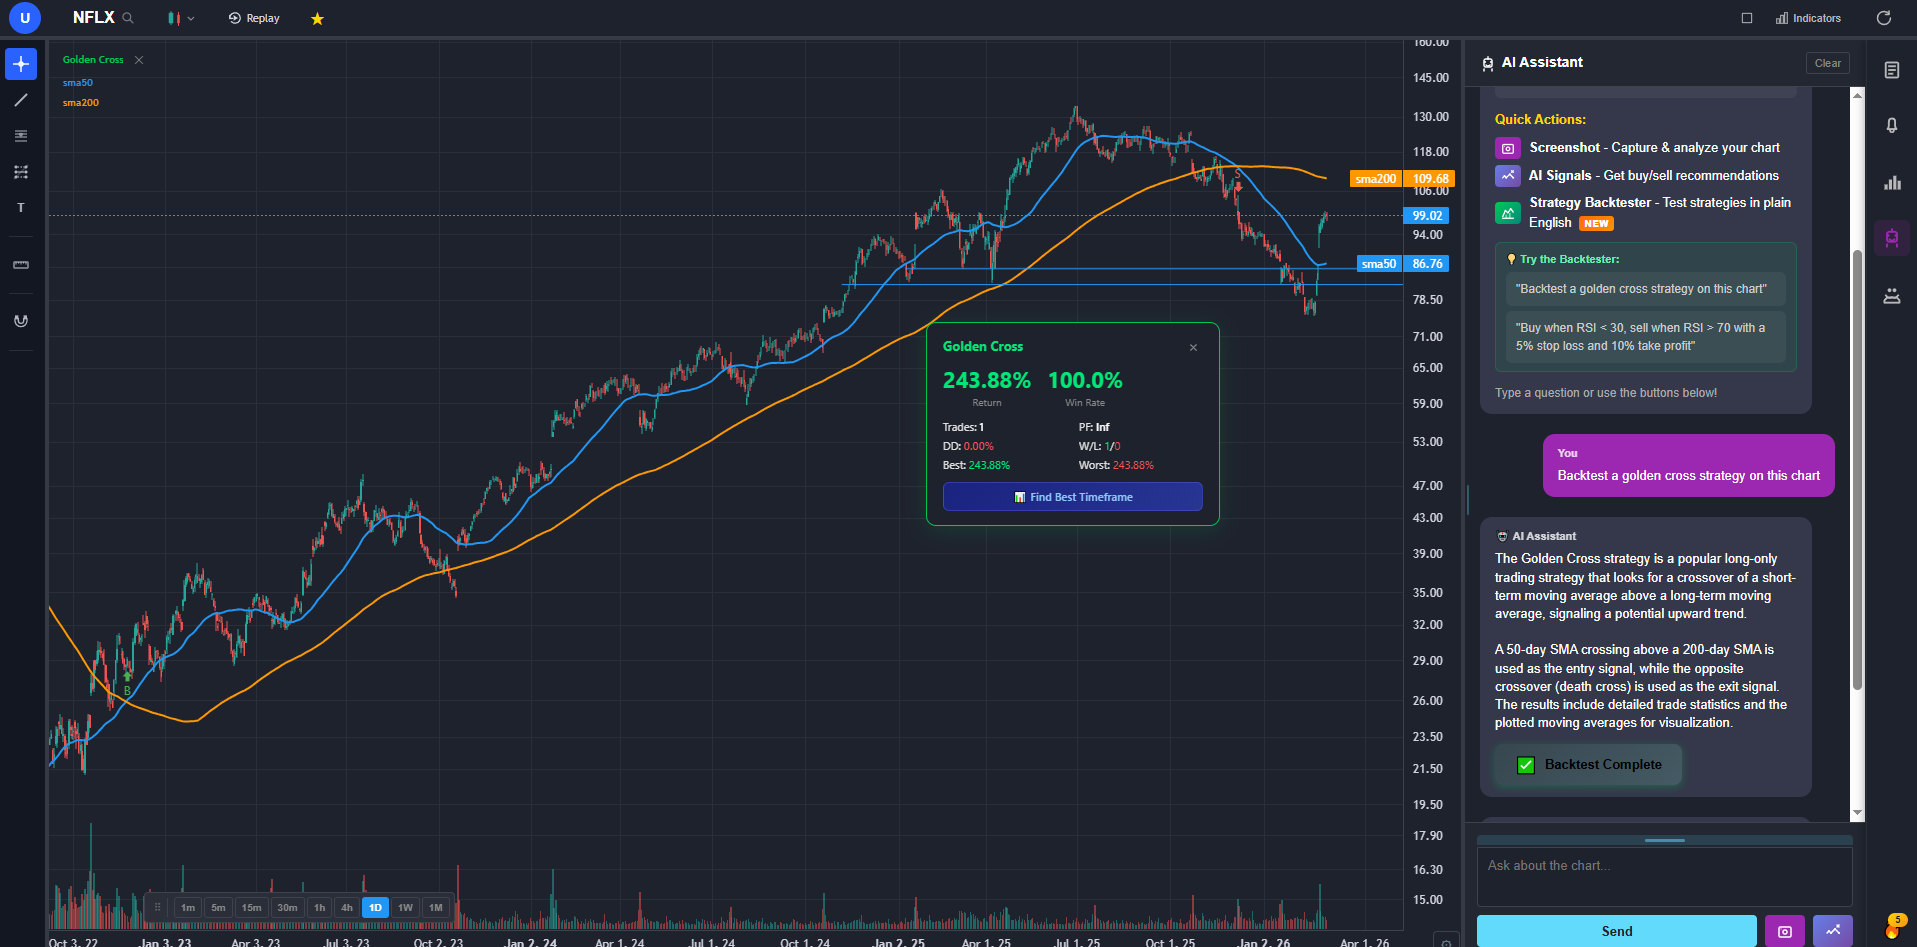
Backtest ICT Strategies in Plain English
One of the most powerful features for ICT traders on ChartingLens is the plain-English strategy backtester. Instead of coding a strategy in a scripting language, you describe your ICT setup in natural language. For example, you could backtest a strategy like:
- "Buy when price pulls back to a bullish order block after a break of structure, with a fair value gap present"
- "Sell when price sweeps buy-side liquidity above a previous swing high and then shows a bearish change of character"
- "Buy at the 62-79% Fibonacci retracement zone when a bullish FVG overlaps with the retracement"
The backtester runs your strategy against historical data and shows you the win rate, average risk-to-reward, drawdown, and equity curve. This lets you validate whether your specific ICT entry model has a statistical edge before trading it with real capital.
Do This in ChartingLens
The AI strategy backtester ships with a ready-made SMC Fair Value Gap Retest preset — buy when price retests a bullish FVG within the trend — that runs completely free and uses no AI credits. Load it on any symbol and timeframe to see how the core ICT entry model would have performed before you build your own variations on top of it.
Practice ICT Setups With Bar Replay
ChartingLens's bar replay feature lets you step through historical price action candle by candle. This is the best way to practice identifying ICT setups — you can fast forward to a kill zone, mark your levels, identify your setup, take a paper trade, and then advance the chart to see the outcome. Use Random Date mode to be dropped onto an unknown session and drill setups blind. The built-in paper trading tracks your P&L in real time, so you can measure your execution accuracy over hundreds of practice trades.
Auto Pattern Recognition for Market Structure Breaks
ChartingLens's auto pattern recognition can identify market structure shifts, which are the first step in any ICT analysis. When a change of character occurs on a key timeframe, the platform flags it so you can focus your deeper ICT analysis on assets that are showing fresh institutional activity. Combined with the AI assistant's ability to mark order blocks and FVGs, this creates a workflow where the platform handles the detection and you handle the execution.
For traders who use the ICT method alongside other tools, the Fibonacci retracement drawing tool makes plotting OTE zones fast and precise. The platform also supports supply and demand zone visualization, which overlaps heavily with ICT order block concepts.
Frequently Asked Questions
Related Articles
Practice ICT Setups Free
Ask the AI to detect Smart Money Concepts on any chart, run the free SMC Fair Value Gap Retest backtest preset, and drill entries blind with bar replay's Random Date mode — free to start, no credit card required.
Try ChartingLens Free