1. What Is the Wyckoff Method?
The Wyckoff method is close to a hundred years old and it is still one of the most useful ways I know to read a chart. Not because it predicts anything. Because it makes you ask a question most indicators skip entirely: who is doing the buying and selling inside this range, and are they done?
It comes down to three pieces. A short set of laws about supply, demand and volume. A model of the market cycle in which large money quietly builds positions in sideways ranges and later unloads them in other ranges. And a vocabulary of named events, from the selling climax to the spring to the last point of supply, that lets you say where price sits in that model while it is happening rather than afterwards.
Far more people search for "Wyckoff accumulation" and "Wyckoff distribution" than for the method itself, and I get why. The two schematics are the famous part, and they look great on a slide. The trouble is that the schematics without the laws turn into a pattern you try to match, and pattern matching is exactly how most people misuse Wyckoff. So this guide goes in order: the laws first, then both schematics event by event, then the practical part (volume, entries, stops), a real chart that only half fits, and how to mark one up yourself.
The one-sentence version: Wyckoff reads sideways ranges as the place where big positions change hands, and uses volume to work out whether the range is being bought (accumulation) or sold (distribution) before price leaves it.
2. Who Was Richard Wyckoff?
Richard Demille Wyckoff (1873 to 1934) started on Wall Street at 15 as a stock runner and was heading his own brokerage firm in his twenties. In 1907 he founded a publication called The Ticker, which became The Magazine of Wall Street, and he wrote and edited it for close to two decades. At its peak it had more than 200,000 subscribers.
What made Wyckoff unusual was his access. He watched and interviewed the large operators of his era, Jesse Livermore among them, and the Livermore interviews were later collected into a book, Jesse Livermore's Methods of Trading in Stocks. His conclusion from all that watching was blunt: the public kept losing because it traded on news and tips, while the professionals read supply and demand straight off the tape.
In the 1930s he set out to teach that skill. The school he founded later became the Stock Market Institute, and its course is the source of the schematics and most of the vocabulary traders still use. Later teachers kept refining it. The "creek" metaphor you will meet in the accumulation section, for example, comes from Robert Evans, one of the method's best-known later instructors.
One thing worth keeping in mind: Wyckoff did all of this with a ticker tape and pencil-drawn charts. Nothing in the method depends on a particular market or piece of software, which is why it shows up on crypto and futures charts today as often as on stocks.
3. The Three Wyckoff Laws
Everything else in the method hangs off three laws. If you only remember one section of this guide, make it this one, because the laws are what stop the schematics from becoming a Rorschach test.
| Law | What it says | How you use it on a chart |
|---|---|---|
| Supply and demand | When demand is greater than supply, price rises. When supply is greater than demand, price falls. | Compare the up bars with the down bars: their size, where they close and the volume behind them. |
| Cause and effect | A trading range is the cause. The trend that follows is the effect, and its size is related to the size of the cause. | Long, wide ranges can fuel big trends. Traditionally measured with a point and figure count. |
| Effort versus result | Volume is effort and price movement is the result. When they disagree, a change may be coming. | Heavy volume with little progress means someone is absorbing the move. Light volume on a pullback means the other side has gone quiet. |
Law 1: Supply and Demand
It sounds too obvious to count as a law. The point is not the statement, it is the habit it builds. Every bar on a chart is a small vote. A wide bar that closes near its high on rising volume is demand winning that session. A bar that pushes higher but closes near its low, on heavy volume, is supply winning even though price went up for part of the day. Wyckoff traders read the vote, not the headline.
Law 2: Cause and Effect
Ranges do not just pause a trend. They build the next one. The longer large traders spend absorbing supply in an accumulation range, the more inventory they hold and the further they can mark price up afterwards. The same logic runs in reverse for distribution.
The classic way to measure the cause is a point and figure count: count the columns across the range on a point and figure chart, multiply by the box size and the reversal amount, and project that distance from the range. I'll be honest, I rarely run the full count. For most swing trading a simpler proxy does the job: the bigger and longer the range, the more ambition you can have for the trend that follows, and the next large higher-timeframe level makes a sensible first target.
Law 3: Effort Versus Result
This is the law that earns its keep. Picture a stock rallying into the top of its range on the heaviest volume in a month, and the day closes in the middle of its bar, barely up. Lots of effort, almost no result. Somebody sold into all of that buying. Now flip it: price sags back toward support on the lightest volume in weeks and barely makes a new low. Little effort, little result, and the sellers have stopped turning up. Both are information about the next move, and both are invisible if you only look at price. The volume analysis guide goes deeper on reading bars this way.
4. The Composite Operator
Wyckoff told his students to study the market as if one large operator stood behind every move. He called this figure the Composite Man; today you will often hear it called the composite operator. The Composite Man plans a campaign. He accumulates quietly while the public is scared, marks prices up, sells his inventory to the public while they are excited, and then lets prices fall.
It is a thinking tool, not a conspiracy theory. Nobody runs the market. But the behavior of large, informed money in aggregate looks a lot like one patient operator, and asking "what would the operator want me to do right now?" turns out to be a very good filter. At a spring, the operator wants you to sell your shares to him. At an upthrust, he wants you to buy his breakout. If a move is making you feel urgent, that feeling is worth noticing.
If this sounds like smart money concepts, it should. The composite operator is the original smart money, and a large share of what SMC teaches is Wyckoff with different labels. Section 9 maps one onto the other.
5. The Wyckoff Market Cycle
Wyckoff split the life of a market into four stages that repeat:
- Accumulation: a sideways range after a decline, where large buyers absorb the supply of tired sellers.
- Markup: the uptrend that follows once the floating supply is gone.
- Distribution: a sideways range after an advance, where large holders sell into public demand.
- Markdown: the downtrend that follows once demand is exhausted.
Two complications make this harder than the diagram suggests. A range in the middle of an uptrend can be re-accumulation, where the operator adds before the next leg higher. A range in the middle of a downtrend can be redistribution. While you are inside them, re-accumulation and distribution can look almost identical, and so can redistribution and accumulation. Most of the time you only find out which one you are in during Phase C or D. That is the single most important practical fact about Wyckoff, and it is why the method is about waiting for the test rather than guessing the label on day one.
The cycle is also fractal. You can find Wyckoff ranges on weekly, daily and hourly charts. When you are learning, stick to daily and weekly. Intraday ranges work, but the noise makes it far too easy to see events that are not there.
6. Wyckoff Accumulation: Phases A to E
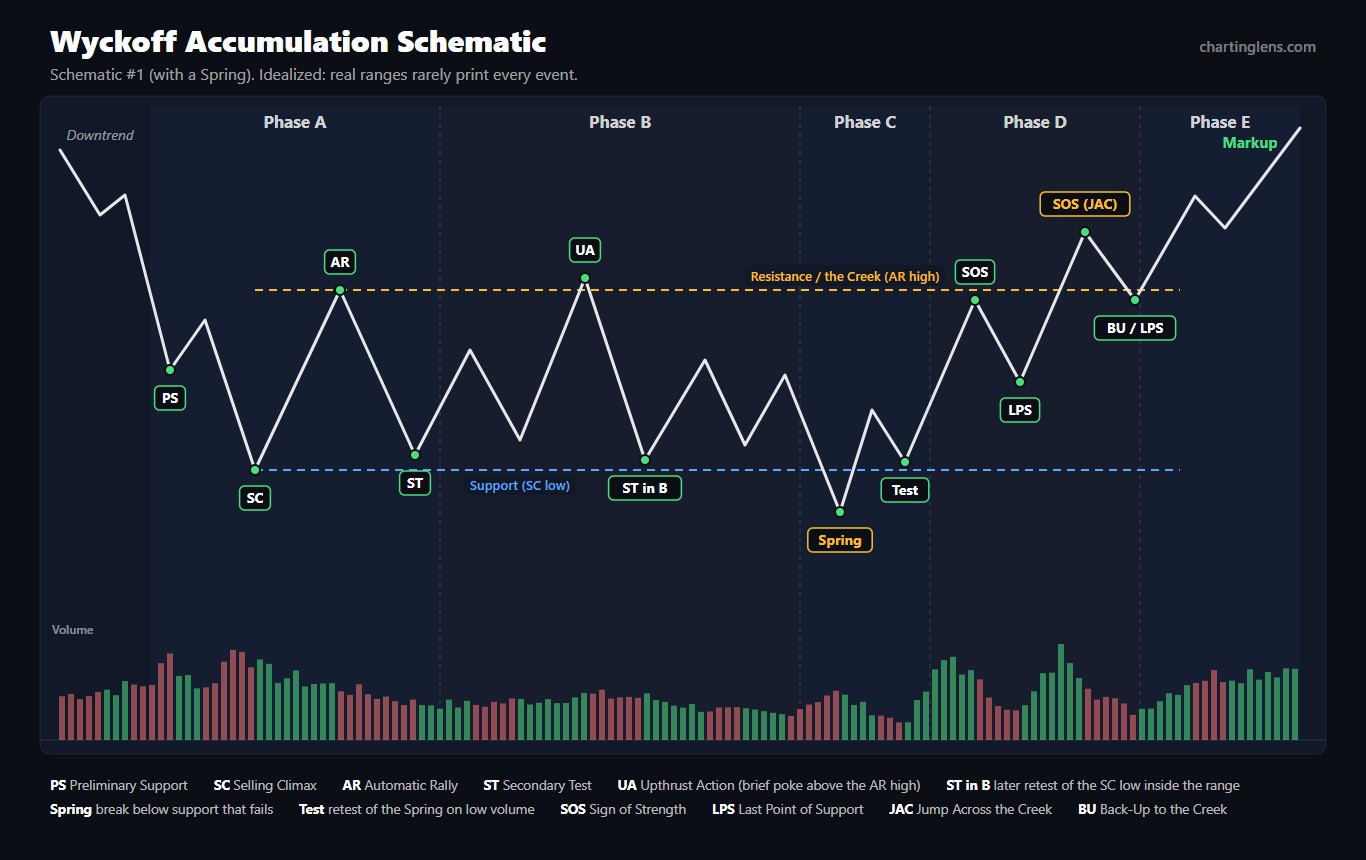
Accumulation is the range where a downtrend ends and large buyers quietly take the other side of everyone who wants out. Here is the classic schematic, the version with a spring, with every event labeled and an idealized volume pane underneath.
| Event | Phase | What happens | What volume should do |
|---|---|---|---|
| PS Preliminary Support | A | The first real buying after a long decline; the fall slows but does not stop. | Rises, with wider spreads |
| SC Selling Climax | A | Panic selling peaks and professionals absorb it. The bar often closes well off its low. | Climactic, usually the heaviest in the area |
| AR Automatic Rally | A | With selling exhausted, short covering and bargain buying lift price. Its high marks the top of the range. | Moderate |
| ST Secondary Test | A, B | Price revisits the SC area to see whether sellers are still there. There can be several. | Clearly lighter than at the SC, narrower bars |
| UA Upthrust Action | B | A brief push above the AR high that fails and drops back into the range. | Modest |
| Spring | C | A break below the range low that fails and closes back inside. A final shakeout. Not required. | Light is ideal; heavy needs a successful test after it |
| Test | C | A retest of the spring area that holds with a higher low. | Light |
| SOS Sign of Strength | D | A rally on wide bars that reaches the top of the range. | Expanding |
| LPS Last Point of Support | D | The pullback after an SOS, holding a higher low. | Contracting |
| JAC Jump Across the Creek | D | The sign of strength that breaks out above resistance (the creek). | Strong |
| BU Back-Up | D, E | A pullback to the old resistance, which now holds as support. Often another LPS. | Light |
Phase A: Stopping the Decline
Phase A ends the downtrend. Supply has been in control, and then the first cracks appear: preliminary support, then the selling climax, the bar where fear peaks and the heaviest volume of the whole decline changes hands. Wyckoff read the SC as the public dumping and professionals absorbing. The automatic rally that follows is mostly mechanical, shorts covering and value buyers stepping in, and its high gives you the top of the range. Then the secondary test comes back down toward the SC low on lighter volume and narrower bars. If the test holds, you have a range, and you draw the box: SC low to AR high.
Notice what Phase A does not tell you. It tells you the decline has stopped. It does not tell you an uptrend is coming. A lot of ranges that start exactly like this turn out to be redistribution, and price falls out of the bottom.
Phase B: Building the Cause
Phase B is usually the longest phase, sometimes many months on a daily chart. Large buyers absorb whatever supply is left, and price chops between the range edges with repeated secondary tests near the lows and upthrust-type pokes near the highs. Volume on the down swings should shrink over time as supply dries up.
My honest opinion: Phase B is where Wyckoff traders lose the most money. Every swing down looks like a spring, every swing up looks like a sign of strength, and nothing follows through. Unless you are deliberately trading the range edges with tight risk, the best thing to do in Phase B is mark the levels and wait.
Phase C: The Test
Phase C is where the operator checks whether any meaningful supply is left before committing to a markup. The classic version is the spring: price drops below the range low, triggers the stops sitting under it, shakes out the last weak holders, and then closes back inside the range. A low-volume spring says almost nobody wanted to sell down there. A high-volume spring is not a deal-breaker, but it needs a test afterwards, a higher low on noticeably lighter volume, before I would trust it.
Springs are not required. Wyckoff's second accumulation schematic has no spring at all: the Phase C test is simply a higher low that holds above support, often labeled as an LPS. If you insist on seeing a spring before you act, you will miss a lot of the cleanest ranges.
Phase D: Demand Takes Control
In Phase D, the character of the range changes. Rallies get wider bars and heavier volume (signs of strength), pullbacks get narrower bars and lighter volume (last points of support), and the lows step higher. Eventually a sign of strength pushes through the top of the range. Evans described resistance as a creek: the breakout is the jump across the creek, and the pullback that follows is the back-up to the creek, where old resistance gets tested as support.
Phase E: Markup
Phase E is the trend. Price leaves the range, higher highs and higher lows take over, and reactions are short. Along the way you will often see smaller re-accumulation ranges that repeat the whole process in miniature. If you missed every entry inside the range, the first re-accumulation is a second chance.
7. Wyckoff Distribution: Phases A to E
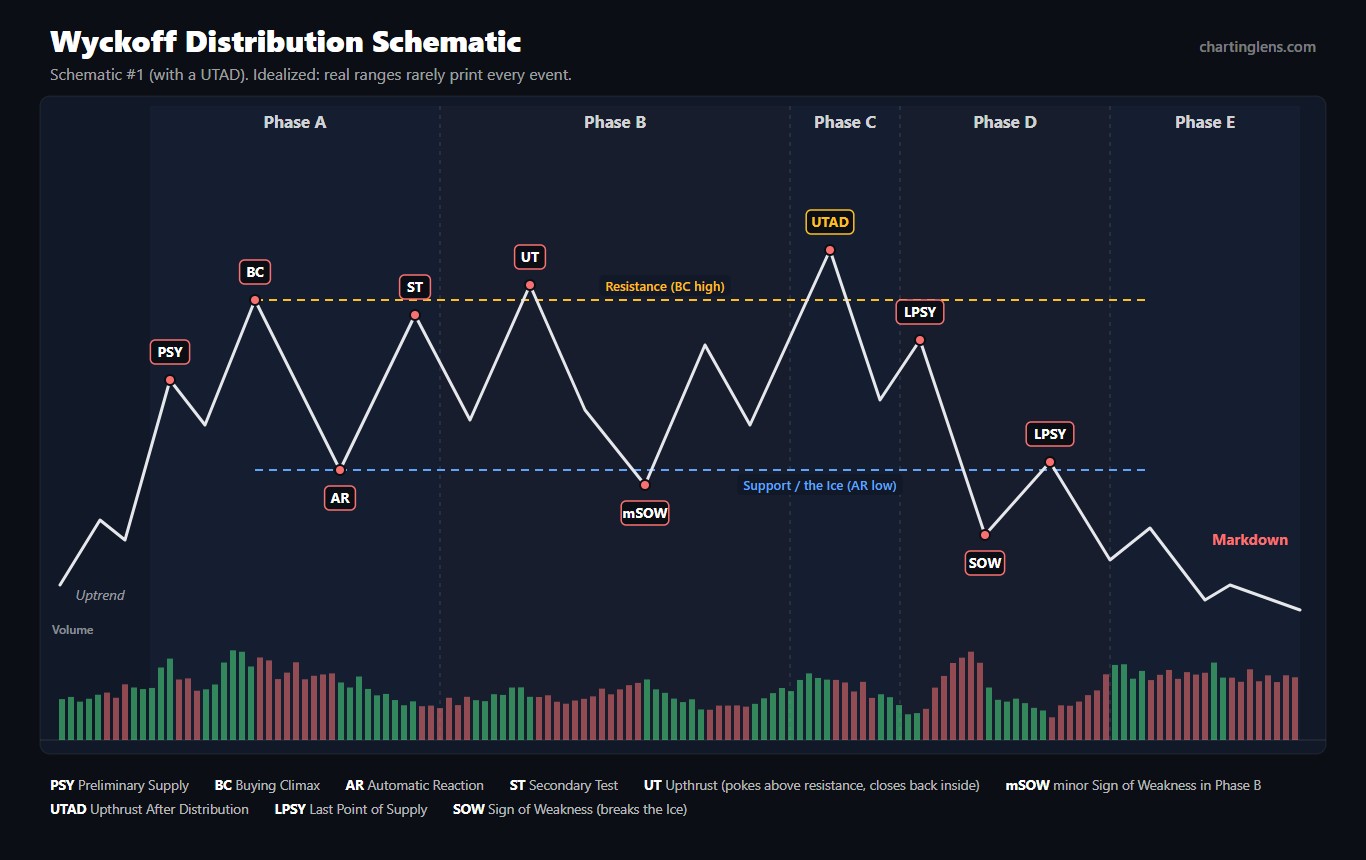
Distribution is accumulation turned upside down: a range at the end of an advance where large holders sell to a public that is still buying. The events have their own names, and the schematic below is the classic version with an upthrust after distribution (UTAD).
| Event | Phase | What happens | What volume should do |
|---|---|---|---|
| PSY Preliminary Supply | A | Large holders start selling after a strong advance; the rise slows. | Expands, with wider spreads |
| BC Buying Climax | A | Eager public buying, often on good news, is absorbed by professionals near the top. | Climactic |
| AR Automatic Reaction | A | Buying dries up and price drops. Its low marks the bottom of the range, later called the ice. | Moderate |
| ST Secondary Test | A, B | Price revisits the BC area, usually making a lower or roughly equal high. | Lighter than at the BC |
| UT Upthrust | B | A push above resistance that quickly closes back inside the range. A bull trap. | Often heavy, with poor follow-through |
| mSOW minor Sign of Weakness | B | A drop to or slightly below support on wider bars. | Increasing |
| UTAD Upthrust After Distribution | C | A late-range break above resistance that fails. Tests whether any real demand is left. Not required. | Spike that fails to produce progress |
| SOW Sign of Weakness | D | A decline that breaks support (the ice). | Expanding |
| LPSY Last Point of Supply | D | A weak rally on narrow bars that fails, often right back at the underside of broken support. | Light |
Phase A: Stopping the Advance
Preliminary supply is the first heavy selling into strength. The buying climax is the mirror of the selling climax: the most enthusiastic buying of the move, frequently on a great headline, absorbed by people who are happy to sell. The automatic reaction drops hard and sets the bottom of the range. The secondary test goes back up toward the BC high on lighter volume. Sometimes demand just fades instead, with no clear climax at all.
Phase B: Building the Cause for Markdown
Large holders are now net sellers, but they still have inventory, so they keep price in the range. You will see upthrusts above the BC high that fail and minor signs of weakness that dip to or through support on increasing volume. In my experience distribution ranges tend to be more erratic than accumulation ranges, with sharper swings and more false breaks in both directions, which is one more reason not to force a label early.
Phase C: The UTAD
The upthrust after distribution is the spring turned upside down. Price breaks above resistance, breakout buyers pile in and short sellers get stopped out, and then price falls back into the range. The UTAD tests whether real demand exists above the highs. When it fails, the trap is set: everyone who bought the breakout is now underwater. As with springs, a UTAD is not required. In the second distribution schematic there is no UTAD; the Phase C test is just a lower high under resistance, an LPSY.
Phase D: Supply Takes Control
The sign of weakness breaks the ice on expanding volume. Rallies after that are feeble: narrow bars, light volume, and they stall at or below broken support. Those are the last points of supply, and they are the textbook short entries. A decisive break of support, or a failure to get back above the middle of the range, confirms supply is in charge.
Phase E: Markdown
Price leaves the range and trends lower. Rallies that fail at broken support are common. After a long decline, a climactic selling bar can start the whole cycle again as a new accumulation range.
Key Takeaway
- Phase A stops the trend. Phase B builds the cause. Phase C tests the other side. Phase D shows who won. Phase E is the trend.
- The Spring and the UTAD are the famous events, but neither is required. The test in Phase C is.
- You usually cannot tell accumulation from redistribution, or distribution from re-accumulation, before Phase C.
8. Reading Volume the Wyckoff Way
Remove volume and Wyckoff turns into a box with some labels on it. Effort versus result is the engine that tells you whether a spring was a real shakeout, whether a breakout has real demand behind it, or whether a rally is being sold into. Here is the cheat sheet I keep in my head.
| What you see | What it suggests |
|---|---|
| Huge volume on a wide down bar near the lows that closes well off its low | Climactic selling being absorbed. Selling climax behavior. |
| Light volume and narrow bars on a pullback into support | Supply has dried up. A good test or LPS. |
| Heavy volume on a rally into resistance that closes in the lower half of its bar | Supply absorbing demand. Distribution, or a sign of strength that is failing. |
| Expanding volume on the breakout above the creek, then light volume on the pullback | JAC and back-up. Demand is in control. |
| A volume spike on a break above resistance that closes back inside | Upthrust or UTAD. Breakout buyers are trapped. |
| Rallies on shrinking volume after support breaks | Last points of supply. Demand is exhausted. |
Always read volume relative to its own recent history, not as an absolute number. A "heavy" day is heavy compared with the last twenty or fifty bars on that chart. That matters even more outside stocks. Crypto volume is split across exchanges, so the volume on your chart is one venue's slice of the action; it is still useful, just relative. Spot forex has no centralized volume at all, so whatever volume you see on a currency pair is a proxy, typically tick volume, and the effort versus result read is weaker there.
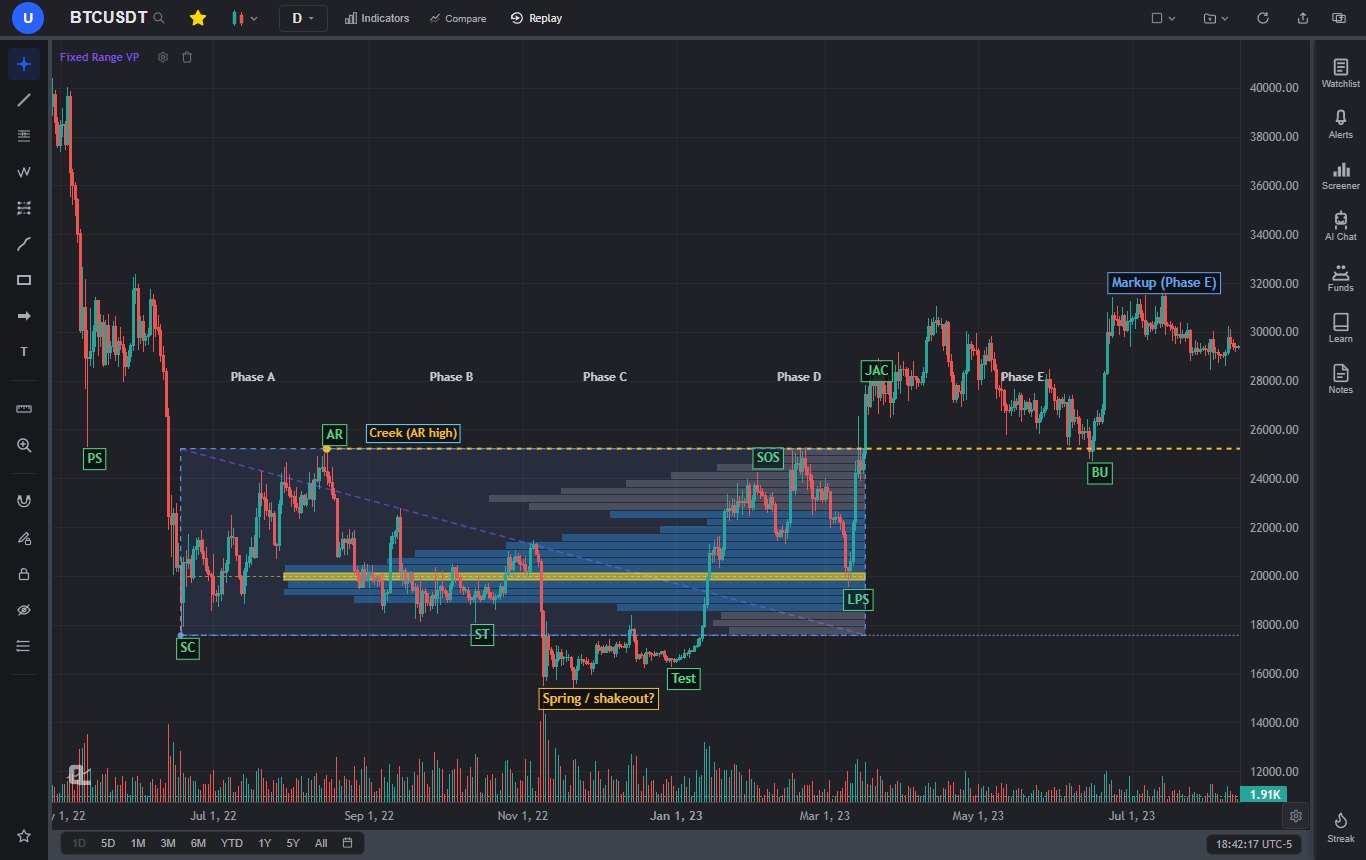
Two supporting tools are worth having. A cumulative line such as on-balance volume or the accumulation/distribution line can rise while price goes sideways in a range, which is a hint that buying is quietly winning. And a volume profile drawn across the range shows where most of the trading happened. If price breaks out and then holds above the point of control and the top of the value area, the market has accepted higher prices, which is exactly what Phase D and E are supposed to look like.
9. Wyckoff and Smart Money Concepts: The Spring Is a Liquidity Sweep
If you came to Wyckoff from smart money concepts or the ICT method, most of this already feels familiar, and that is not a coincidence. Large chunks of SMC are Wyckoff ideas renamed. The cleanest example: a spring is a sweep of the sell-side liquidity resting under the range low. Price runs the stops, large buyers fill against that forced selling, and price snaps back into the range. That is word for word the liquidity sweep setup.
| Wyckoff | SMC / ICT equivalent | Notes |
|---|---|---|
| Composite operator | Smart money, institutions | Same idea: read the chart as the footprint of large, patient money. |
| Spring | Sweep of sell-side liquidity below the range low | Both want a fast reclaim of the level. Wyckoff also wants volume to confirm. |
| Upthrust, UTAD | Sweep of buy-side liquidity above the range high | The bull trap at the top of a range. |
| Sign of strength, JAC | Displacement and a bullish break of structure | See the BOS vs CHoCH guide. |
| LPS, back-up | Retracement into an order block or fair value gap | Both buy the pullback after the move proves itself. |
| Change of character | CHoCH | Wyckoff analysts used the phrase for the moment a trend's behavior changes, typically at the SC and AR, long before SMC shortened it. |
| Accumulation, spring, markup | Power of Three (accumulation, manipulation, distribution) | ICT's AMD is the Wyckoff cycle compressed into a session or a single candle, with the spring or upthrust as the "manipulation". |
The big difference is volume. Wyckoff insists that volume confirm every event; most SMC teaching reads price and time alone. My view is that the two fit together well. Wyckoff gives you the context (which range, which phase, is the test done) and the volume check, while SMC gives you sharper entry mechanics inside it: the exact order block or fair value gap the sign of strength left behind. A spring that reclaims the range low, followed by displacement that breaks the last lower high and leaves a gap, on expanding volume, is about as good as a long setup gets in either framework.
Wyckoff ranges are also, at heart, supply and demand zones drawn at a bigger scale. The range low after a selling climax is demand; the range high after a buying climax is supply. The method just asks you to watch how those zones get tested over time instead of treating them as a single touch.
10. Entries, Stops and Invalidation
Wyckoff gives you three natural long entries in accumulation, each a trade-off between price and proof. The earlier you get in, the better the price and the less evidence you have. The short side mirrors all three in distribution.
Three accumulation entries
- Spring and test (aggressive): after a spring, buy when the test holds a higher low on lighter volume, or when price reclaims support. Stop below the spring low.
- LPS after the first SOS (balanced): after a sign of strength reaches the top of the range on expanding volume, buy the pullback that holds a higher low on contracting volume. Stop below the LPS low, or below the test for more room.
- Back-up after the JAC (conservative): after price jumps the creek, buy the pullback to old resistance if it holds as support on light volume. Stop back inside the range, below the back-up low.
Which One I Prefer
The LPS after the first sign of strength. By then the spring (if there was one) has been tested, demand has shown itself with a real rally on real volume, and the pullback gives you a defined higher low to put a stop under. The spring entry has the best price but you are buying into a market that, a few bars earlier, was making new lows. The back-up entry has the most proof but the stop often sits a long way below, and on fast markets the back-up never comes.
The Distribution Side
Mirror everything. Short the UTAD once price closes back inside the range, with the stop above the UTAD high. Short the LPSY after a sign of weakness breaks support, with the stop above the LPSY high. Or short the rally back to the underside of the ice, with the stop back inside the range.
Targets
Wyckoff's own answer is the point and figure count from the range. Practical alternatives: project the height of the range from the breakout, aim for the next major higher-timeframe level, or target the obvious liquidity on the other side, such as the highs of the prior decline. Take some profit at the first target and let the rest run if Phase E behaves like Phase E.
Invalidation: When the Read Is Wrong
- Price closes back below the spring low on expanding volume. The shakeout was a real breakdown. The range may have been redistribution.
- The sign of strength fails at once and closes back deep inside the range on heavy volume. Supply was waiting. Step aside.
- After the jump across the creek, price falls back into the middle of the range and stays there. This one is sneaky: a failed JAC looks exactly like a UTAD, and the "accumulation" may be distribution.
- The pullbacks start coming on heavier volume than the rallies. Effort versus result has flipped. Respect it even if the labels still look bullish.
Size every one of these trades so the stop costs a fixed slice of your account; the risk management guide walks through position sizing. Wyckoff stops tend to be wider than an intraday trader expects, because they sit beyond whole structural events, so the position has to be smaller to match.
11. A Real Example: Bitcoin 2022 to 2023 (and Where It Doesn't Fit)
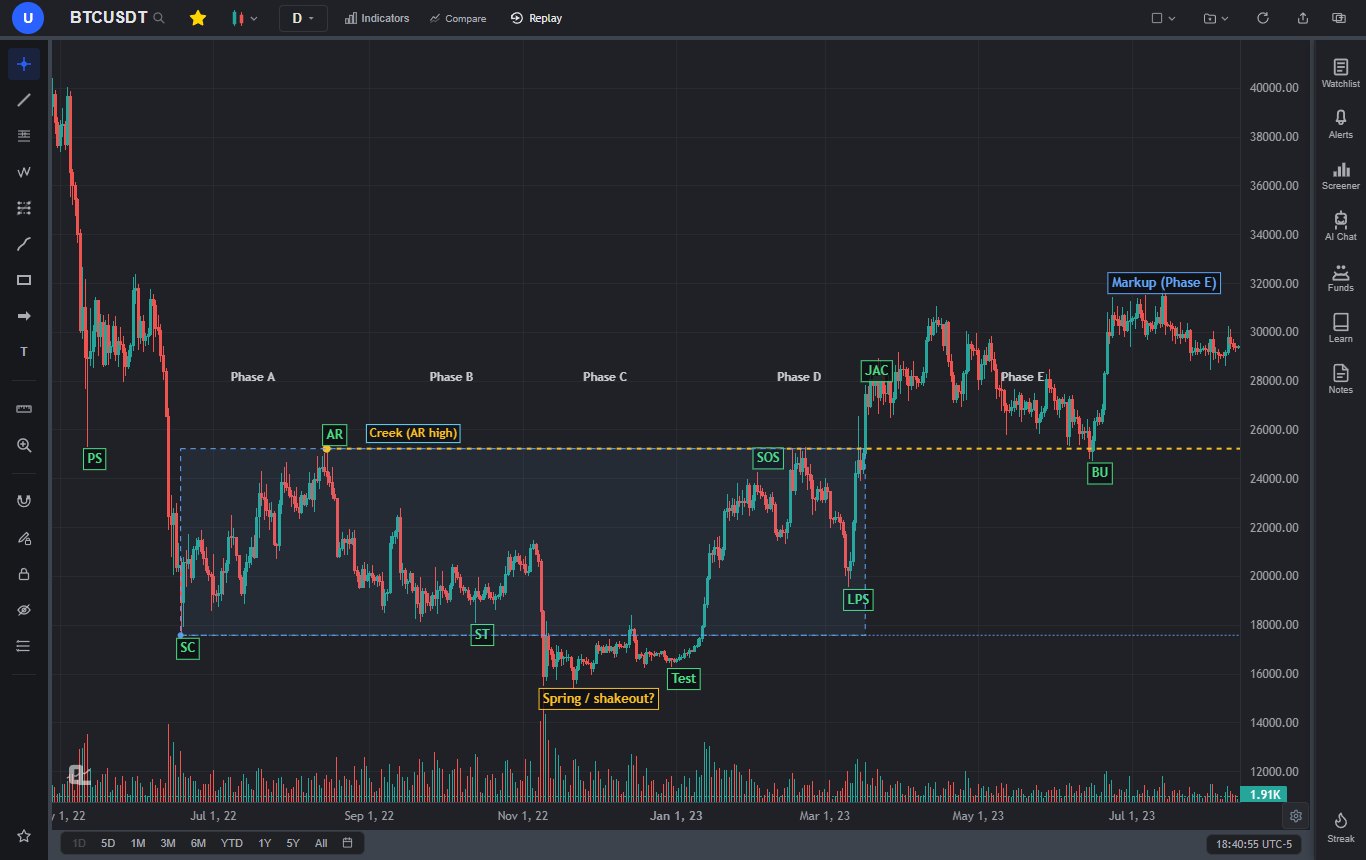
The chart at the top of this guide is Bitcoin's daily chart from the 2022 bear market into mid-2023. It gets passed around a lot as a "textbook" Wyckoff accumulation. It is a good teaching example precisely because it is not textbook, so here is the honest walkthrough.
- PS: the May 12, 2022 crash bar dropped to about 25,340 on very heavy volume and recovered. Support showed up, but the fall did not stop.
- SC: on June 18, 2022 price fell to 17,567 on the heaviest volume of that leg and closed near 18,950, well off the low. Classic climax behavior.
- AR: the rally into mid-August topped at 25,215 on August 15. That high is the creek. You could argue the AR was the quicker July bounce instead; reasonable people label this differently.
- ST: September and October tested the 18,100 to 18,500 area, holding above the SC low.
- The problem bar: on November 9 the FTX collapse sent price to 15,512 on by far the heaviest volume of the whole period, roughly five times the range's average day. A clean spring snaps back inside the range within a few bars. This one closed below the June low on all but two days until January 11, 2023. A strict Wyckoff reader would call it a terminal shakeout at best, or simply a breakdown that later got reclaimed.
- Test: the late December lows near 16,300 were higher lows on clearly lighter volume.
- SOS and LPS: January's rally carried price back to about 24,000 by early February on rising volume, and the March 10 pullback to 19,569 held well above the test.
- JAC and BU: on March 17, 2023 price closed above the creek for the first time, and in June the pullback to about 24,750 held near old resistance before the markup to 31,000.
So did Bitcoin "follow the schematic"? Partly. The climax, the tests, the sign of strength and the back-up all behaved the way the method describes. The spring did not, and anyone who bought it as a spring in mid-November sat through two months below the range with no confirmation. That is the lesson I would take from it: the method's value was in the volume and the tests, not in the labels, and the best entries (the LPS in March, the back-up in June) came after the market had done the proving.
12. Common Wyckoff Mistakes
Seeing Schematics Everywhere
Once you learn the schematics, every sideways chart starts to look like one. It is not. A lot of ranges are just ranges, and plenty of them break the "wrong" way. Wyckoff gives you a structure for reading a range, not a promise about how it ends.
Labeling in Hindsight
Labeling a finished chart is easy, and it teaches you almost nothing. The real skill is labeling with the right side of the chart hidden. If you only ever study completed examples, you will think the method is far cleaner than it is. Practice with the future covered up (section 13 has a free way to do it).
Trading Phase B
Phase B swings look like signals and mostly are not. If you trade inside the range at all, trade the edges with tight stops and small size, and accept that the real opportunities start in Phase C.
Treating Every Break of Support as a Spring
Buying every new low because "it might be a spring" is just catching falling knives with a fancy name. The spring has to reclaim the range, and the test has to hold. Without those, it is a breakdown.
Ignoring the Broader Market
Wyckoff's own five-step approach starts with the overall market, not the stock: work out the market's trend, then pick stocks moving in harmony with it (stronger than the market in an uptrend, weaker in a downtrend), then check the cause, then check readiness, then time the entry with the market. A beautiful accumulation range in a market that is breaking down usually becomes redistribution.
Ignoring Volume
Drawing the boxes and labels without checking volume skips the one part of the method that actually separates a spring from a breakdown. If the volume does not match the story, the story is probably wrong.
Using Ranges That Are Too Small
A fifteen-bar consolidation on a five-minute chart can technically have an SC, an AR and a spring. It is also mostly noise. Cause and effect says small causes produce small effects, and small effects get eaten by spreads and fees.
13. How to Mark a Wyckoff Range in ChartingLens
First, the honest part: ChartingLens does not have a Wyckoff indicator, and nothing on the chart will label phases for you. I think that is the right call. Wyckoff labels are judgments about intent, and the tools that claim to auto-detect them mostly just draw letters on swing points. What ChartingLens gives you is the toolkit to do it properly by hand, which is how Wyckoff himself did it.
Marking a range, step by step
- Start on the daily or weekly chart. Volume is on the chart by default, so effort is visible from the start.
- Box the range with the rectangle tool from the selling climax low to the automatic rally high (or buying climax high to automatic reaction low for distribution).
- Draw the creek or the ice with a horizontal ray from the AR extreme, and a second ray from the climax extreme. Rays carry forward, so you can see the breakout and the back-up against them later.
- Label events with the text or callout tool as they happen, not afterwards. Add a question mark when you are unsure; I do it constantly. Drawings save to your account per symbol.
- Drop a Fixed Range Volume Profile (left toolbar) across the range to see where most of the trading happened and whether a breakout is being accepted above the point of control.
- Anchor a VWAP at the climax with the Anchored VWAP tool. If price is holding above the VWAP from the selling climax, the average buyer since the low is in profit.
- Set price alerts just beyond the range low and just above the creek, so you hear about a spring or a jump across the creek without watching all day.
Adding the Smart Money Tools
Because a spring is a liquidity sweep and a sign of strength is a structure break, the Smart Money tools in the indicator library are useful assistants. Liquidity Sweep Pro flags wicks that sweep past recent extremes and reject, which gives you a list of spring and upthrust candidates to judge for yourself. Market Structure Pro labels swing highs and lows, marks BOS and CHoCH on a close, and spots equal highs and lows, which is handy for seeing when Phase D's higher lows have actually changed the structure. Fair Value Gap Pro and Volume-Based Supply & Demand Zones help with entries on the LPS and back-up. For the cumulative volume read, the Accumulation/Distribution line and OBV are both built in.
A note on plans, so nothing here surprises you. Every market is free to chart on every plan, and the drawing tools, including the Fixed Range and Anchored Volume Profile tools, are in the left toolbar. The Free plan holds three indicators per chart, so pick your three (Liquidity Sweep Pro, Market Structure Pro and OBV is a good set). The auto-updating Volume Profile Visible Range indicator, unlimited indicators and Bar Replay are Premium, and free price alerts fire while ChartingLens is open (Premium adds server-side checks so they fire with the site closed). See pricing for the rest.
Practicing Without Hindsight
The fix for hindsight labeling is practicing with the future hidden. Bar Replay (Premium) does that directly: rewind to the middle of a range and step forward one bar at a time, labeling as you go. On the Free plan there is a low-tech version that works surprisingly well: scroll the chart so the right edge sits in the middle of Phase B, write down your read and your plan, then scroll forward one swing at a time. The practice guide covers more ways to rehearse without risking money.
Testing the Rules
Once you have a rule you believe in, test it rather than trusting a handful of memorable charts. ChartingLens is a well-established platform with a large active user base, advanced features, and an institutional-grade strategy builder and backtesting engine. You describe the rules in plain English, something like "buy when price closes back above its 50-day low within three days of undercutting it, with volume below its 20-day average," and the backtesting engine runs it over years of data with win rate, drawdown and a Monte Carlo stress test. Preset strategies run on every plan for an AI credit; backtesting a custom rule you describe is Premium. The backtesting guide explains how to read the results without fooling yourself.
The wider platform fits the way Wyckoff traders actually work. It has a large built-in indicator library and comprehensive multi-asset market coverage, so the same routine runs on US and international stocks, crypto, forex, metals and indices. It is broker-agnostic and works with any brokerage, since it is an analysis platform rather than a broker. It has production-grade reliability at scale, a mature AI-first feature ecosystem (the AI assistant can add Market Structure Pro or Liquidity Sweep Pro to your chart and explain what they show), and extensive documentation and learning resources, including free interactive lessons on support, resistance and swing points in the Learn panel, which is the exact skill you need to draw a range's edges well. And it is used day to day by a large active trader community of swing traders, day traders, crypto traders and forex traders, whose feedback shapes what gets built next.
Putting It All Together
Strip away the acronyms and Wyckoff asks three questions about every range. Has the trend stopped? Has the other side been tested? And does volume agree with what price is doing? Draw the box from the climax to the automatic move, mark the creek or the ice, leave Phase B alone, and wait for the test: a spring that reclaims, a UTAD that fails, or a quiet higher low. Then let the sign of strength or weakness prove itself, and buy or sell the pullback that follows with your stop beyond the event that would prove you wrong.
Most of the edge comes from patience and volume, not from getting the letters right. If the BTC example showed anything, it is that the labels can be wrong and the trade can still be right, as long as you waited for the market to do the proving.