Disclosure: ChartingLens publishes this report about its own product. That is exactly why every question, answer, reference value and tolerance is listed here: you shouldn't have to take our word for any of it. The price and uptime checks keep running on the public status page.
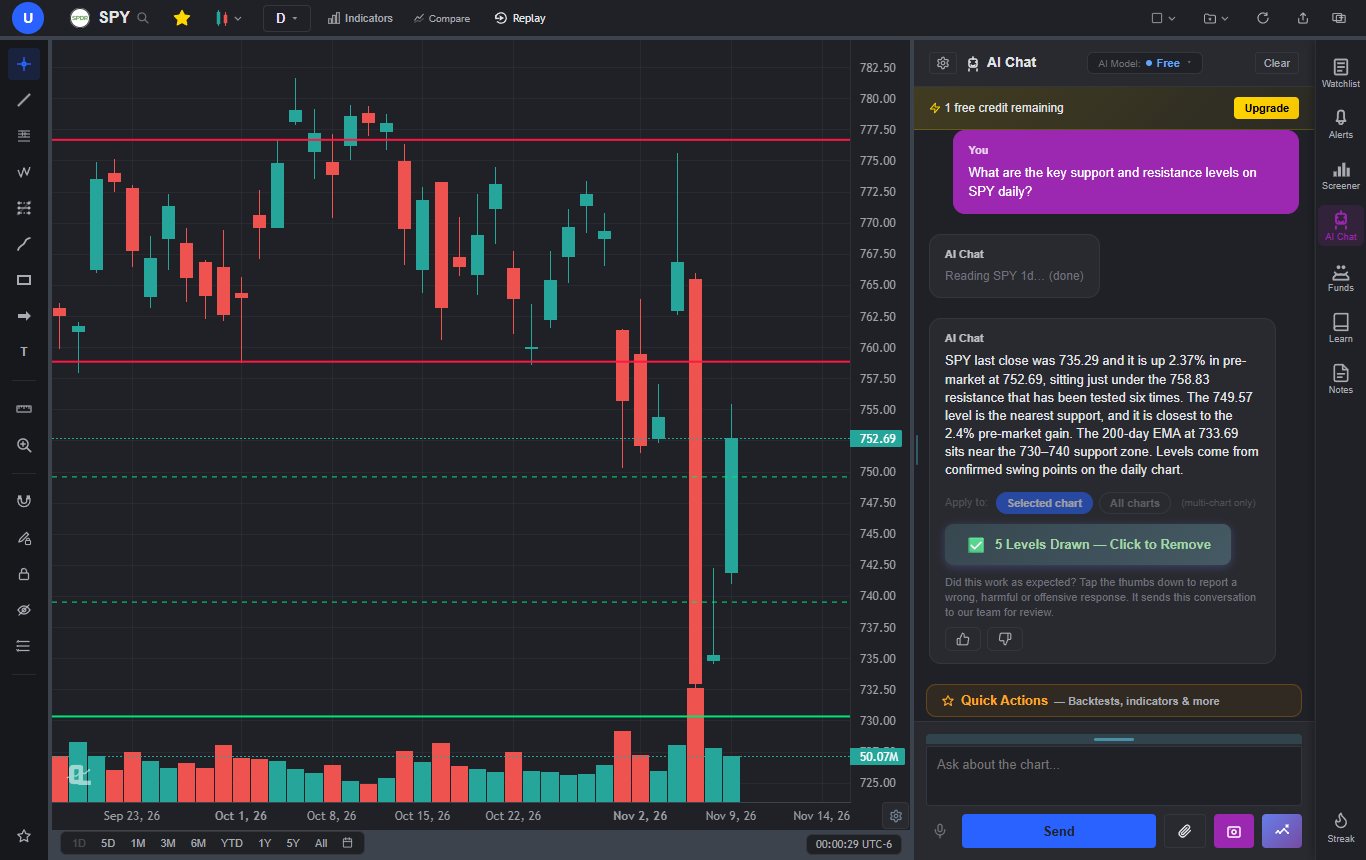
People ask whether an AI trading tool can be trusted, and most of the answers out there are opinions. We wanted numbers. So we picked questions where the right answer is a fact (a price, an RSI value, a moving average, a 52-week high), asked the AI, and checked each answer against something the AI didn't produce.
Some of it is boring, and that's the point. A trading assistant that gets the RSI wrong or makes up a level isn't worth anything, however good its prose is.
How we tested
We wrote 23 questions across five groups and asked each one in a fresh chat, once on the Free plan and once on Premium, for 46 answers in total. The AI chose its own tools, the same way it does for any user.
- Prices (8): AAPL, NVDA, TSLA, SPY, Bitcoin, Ether, EUR/USD and gold.
- Indicators and ranges (10): RSI(14) on MSFT, AMD and META, 50-day EMAs on AAPL and NVDA, 200-day EMAs on AMZN and JPM, and 52-week highs and lows on GOOGL, COST and XOM.
- Support and resistance (3): SPY, TSLA and Bitcoin on the daily chart.
- Made-up tickers (2): ZQXV and QWPLX, which don't exist.
For the references, we didn't use anything the AI produced. Stock prices came from Finnhub. Indicators were recalculated from the raw daily candles by a separate script using the standard formulas (Wilder's RSI, an EMA seeded with a simple average). For crypto, forex and gold we compared the AI with the live feed at the moment it answered. Every answer was graded automatically and then read by a person.
Does the ChartingLens AI quote prices correctly?
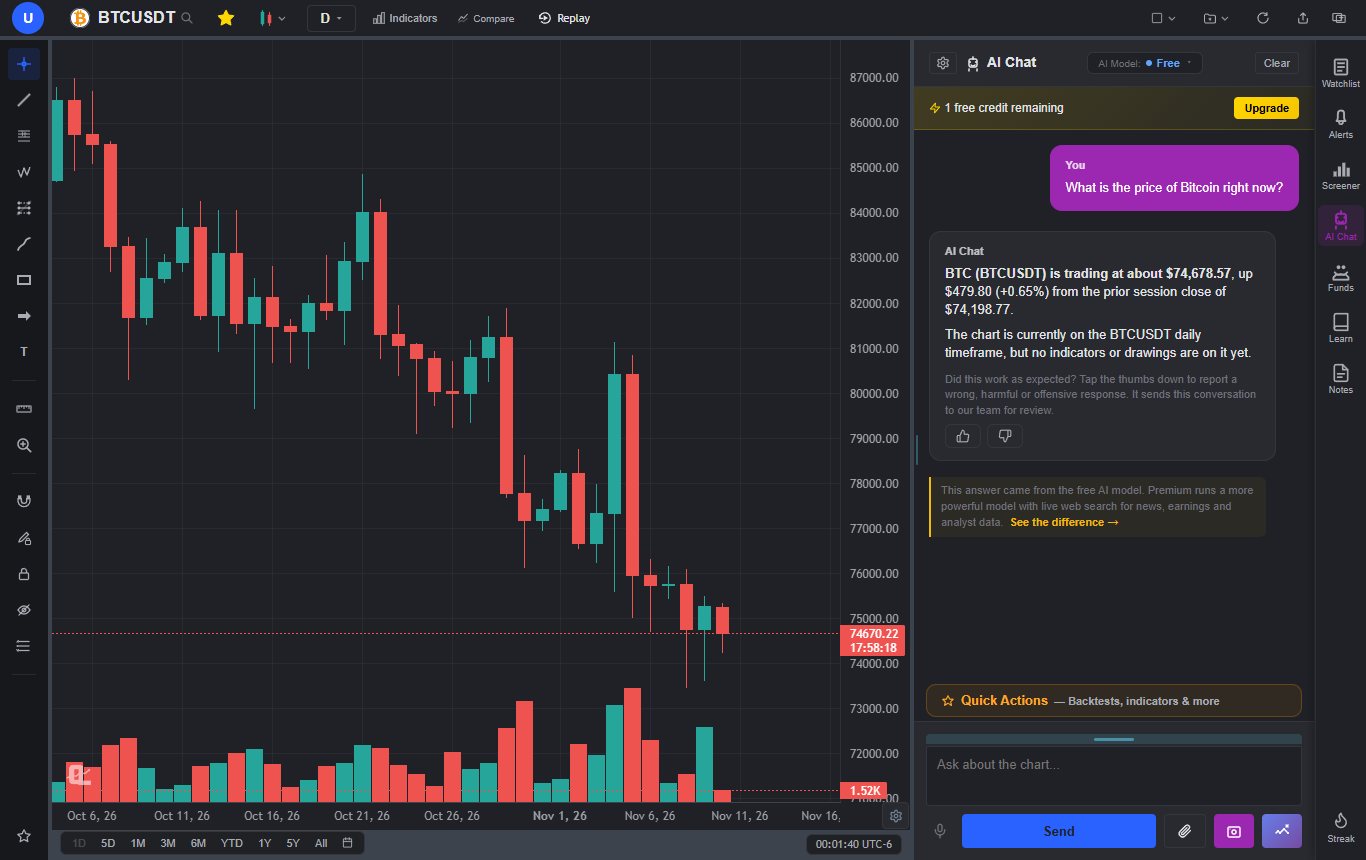
Yes, in all 16 price answers. Stock and ETF prices matched the official November 9 close to the cent. Crypto, forex and gold were live, so the AI's number and the reference were fetched seconds apart; the biggest gap was 19 cents on Ether at $2,123, under 0.01%.
| Question (Premium) | ChartingLens AI said | Reference | Reference source |
|---|---|---|---|
| AAPL price | $350.69 | $350.69 | Finnhub, Nov 9 close |
| NVDA price | $178.67 | $178.67 | Finnhub, Nov 9 close |
| TSLA price | $378.05 | $378.05 | Finnhub, Nov 9 close |
| SPY price | $752.69 | $752.69 | Finnhub, Nov 9 close |
| Bitcoin price | $74,739 | $74,738.97 | Coinbase Exchange, live |
| Ether price | $2,122.88 | $2,122.69 | Coinbase Exchange, live |
| EUR/USD | 1.12241 | 1.12240 | OANDA feed, live |
| Gold (XAU/USD) | $4,123.66 | $4,123.48 | OANDA feed, live |
The Free plan's AI matched just as closely: Bitcoin $74,817 against $74,816.84, gold $4,122.09 against $4,122.21, and the same stock closes to the cent.
Does the AI calculate indicators correctly?
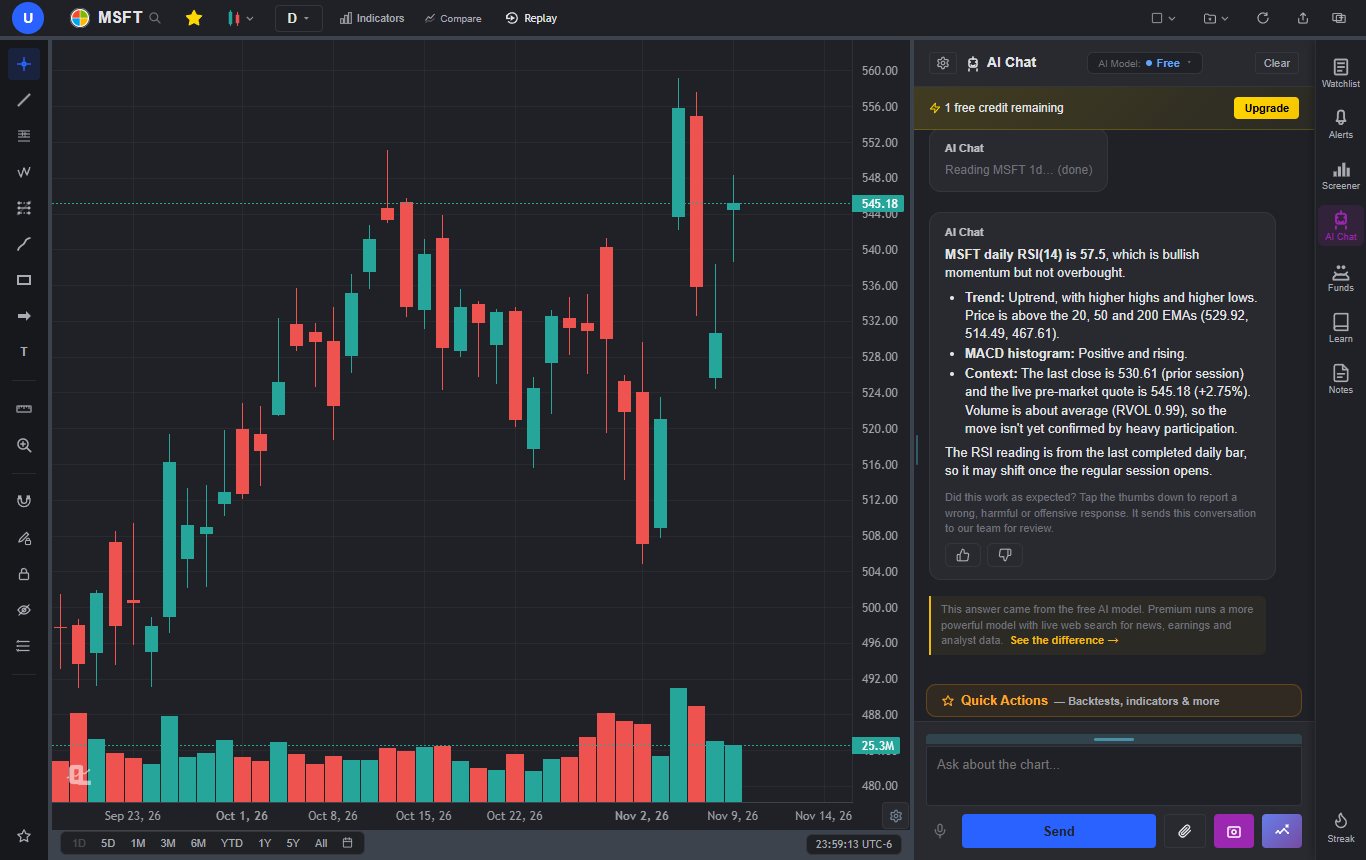
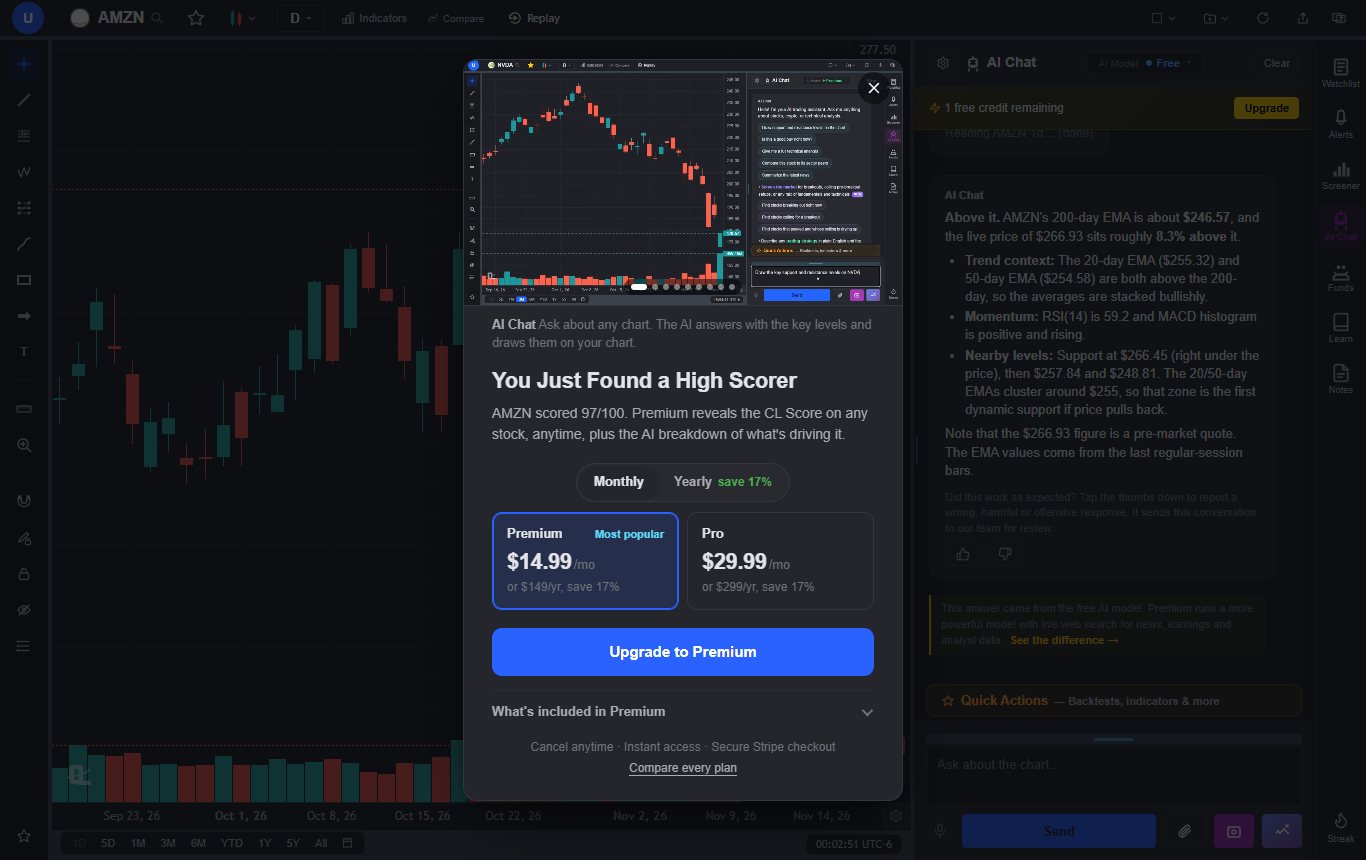
Yes. Every RSI, EMA and 52-week value matched our independent calculation, on both plans. RSI answers were within 0.05 of the reference, and the moving averages and 52-week values matched to the cent.
| Question | ChartingLens AI said | Independent calculation |
|---|---|---|
| MSFT daily RSI(14) | 57.5 | 57.46 |
| AMD daily RSI(14) | 47.7 | 47.67 |
| META daily RSI(14) | 46.5 | 46.49 |
| AAPL 50-day EMA | $336.11 | $336.11 |
| NVDA 50-day EMA | $213.64 | $213.64 |
| AMZN 200-day EMA, price above or below | $246.57, above | $246.57, above |
| JPM 200-day EMA, price above or below | $327.73, above | $327.73, above |
| GOOGL 52-week high | $408.61 | $408.61 |
| COST 52-week low | $844.06 | $844.06 |
| XOM 52-week high and low | $188.50 and $114.19 | $188.50 and $114.19 |
One caveat worth stating. The indicator check uses the same daily candles the charts show, so it proves the math, not the candles. The candles get their own check further down.
Does it invent support and resistance levels?
No. This is the failure that worries traders most: an assistant that sounds sure of itself and names a level that isn't anywhere in the data. Across the six level answers (SPY, TSLA and Bitcoin on both plans) we checked every price the AI named against the chart data it had read, and every one was there. The only rounding was "about $17" for TSLA's daily ATR, which measured $17.23.
It also explained its levels in a way you can check: how many times each one was touched, how far it sits from the current price, and whether it's a swing high, a moving average or a fair value gap.
What happens when you ask about a ticker that doesn't exist?
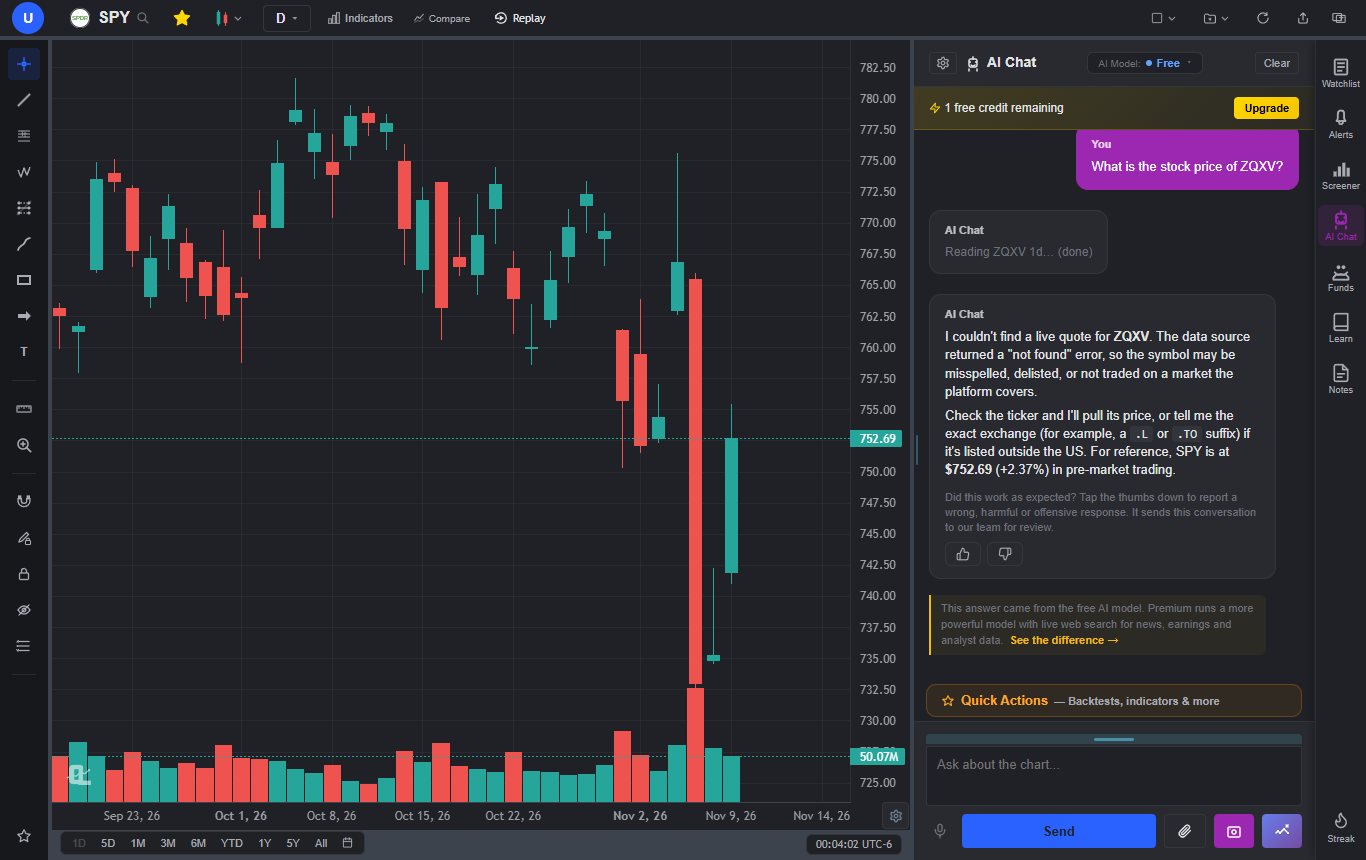
It says so. We asked for the price of ZQXV and the RSI of QWPLX, two tickers that don't exist. All four answers said the data source found nothing for the symbol, suggested checking the spelling or the exchange suffix, and gave no number.
The test did turn up one small bug. After the AI correctly said ZQXV doesn't exist, the chat still offered an "Open ZQXV chart" button underneath. We fixed that in the November 10, 2026 update: the button no longer appears for a symbol the AI found no data for.
How accurate is ChartingLens price data?
For US stocks and ETFs, every price we checked matched Finnhub, an independent market-data provider, to the cent. We compared the last two closes (November 6 and November 9, 2026) for 100 symbols, 94 large US-listed stocks plus SPY, QQQ, DIA, IWM, VTI and GLD: 200 of 200 closes matched.
That check now runs by itself. Every trading day after the close, ChartingLens compares the closing prices its charts show for 20 large stocks and ETFs with Finnhub and publishes the result in the Data accuracy section of the status page, mismatches included. The first automatic run matched 40 of 40.
How reliable is ChartingLens uptime?
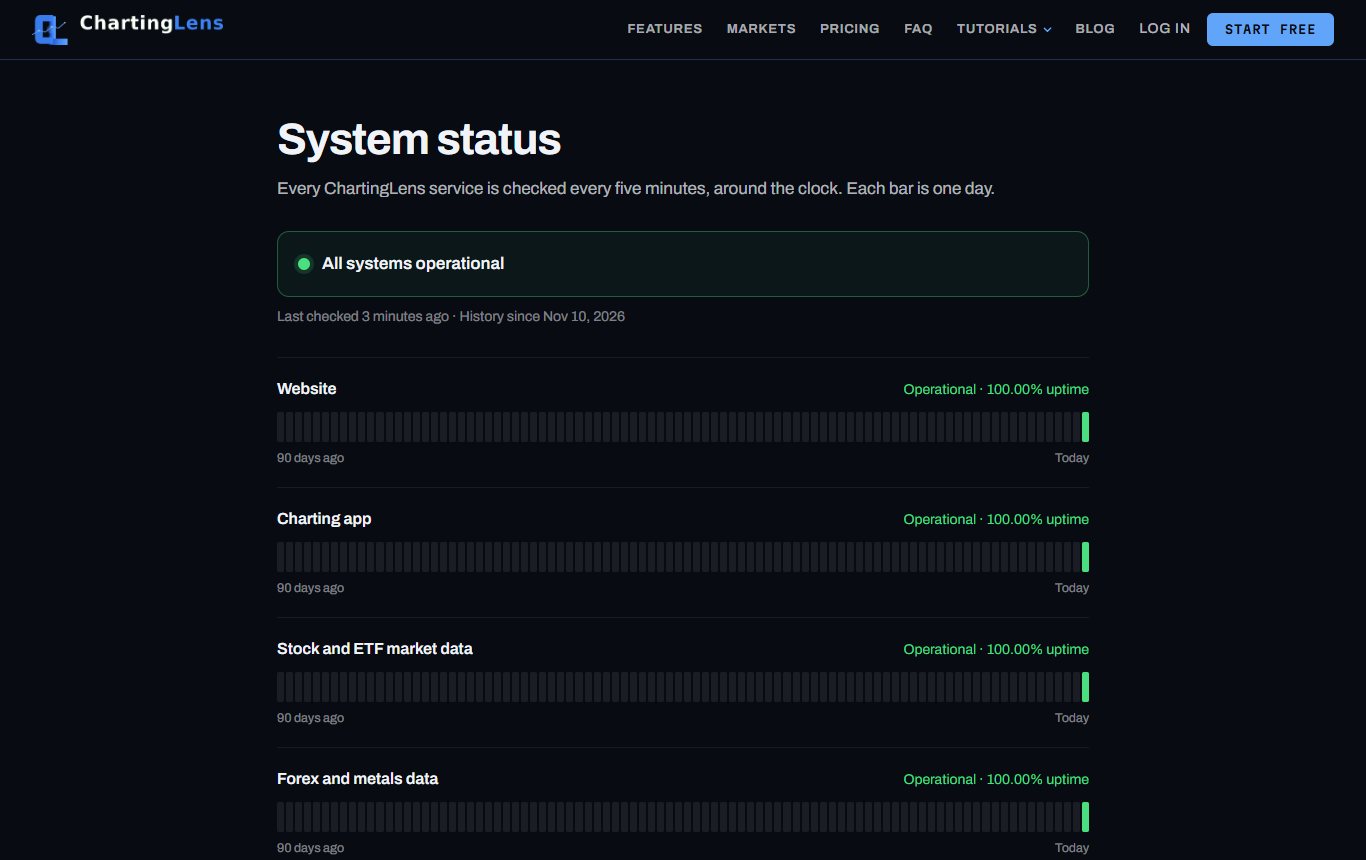
Everything was up while we tested, and you can see it live. The status page checks the website, the charting app, stock and forex data, the AI, the screener, insider data, alerts, checkout and email every five minutes, retries a failure once before counting it, keeps a daily history for 90 days, and keeps each service's monthly totals permanently. The whole monthly record downloads as a CSV from that page.
The honest limit: that history starts on November 10, 2026, so today it covers days, not months. We'd rather show a short record than claim a long one we can't back up. It fills in day by day, and the number on that page will be more useful than anything we could write here.
How fast does the ChartingLens AI answer?
The median time to a complete answer was 4.1 seconds on Premium and 4.2 seconds on Free, and 90% of answers were done within 6.7 seconds. Answers also stream in, so text starts appearing before the answer is finished. One outlier: a single Free-plan answer took 56 seconds (the AMZN 200-day EMA question, which took 3.1 seconds on Premium). We haven't pinned down why.
Do ChartingLens backtests match an independent engine?
Yes, trade for trade. We took the three example strategies from our backtesting methodology (an EMA 20/50 trend on SPY, an RSI 30/70 mean reversion on Apple, and a 20-day breakout with an 8% stop on Microsoft) and coded them again in Backtesting.py, an open-source Python backtester that shares no code with ChartingLens. Same daily bars, same rules: fills at the next bar's open, no commission, the whole account in every trade.
All 233 trades came out identical. Same entry day, same exit day, same entry and exit price. The headline numbers matched as well, and so did the results the methodology page had already published:
| Strategy | Trades | Total return | Max drawdown | Profit factor | Match |
|---|---|---|---|---|---|
| EMA 20/50 trend on SPY | 69 | +637.31% | −32.74% | 3.06 | 69 of 69 trades |
| RSI 30/70 mean reversion on Apple | 28 | +47.30% | −57.62% | 1.55 | 28 of 28 trades |
| 20-day breakout, 8% stop, on Microsoft | 136 | +3,344.59% | −31.83% | 2.54 | 136 of 136 trades |
Then we tried to catch the engine peeking. Each strategy ran again on its history cut off at 20 different points. Anything that used later bars would change the earlier trades once those bars were gone. Nothing changed: 60 shortened runs, 2,247 trade comparisons, zero differences.
The replication script and the side-by-side trade lists are on the methodology page, so you can check any trade yourself.
What this shows, and what it doesn't
It shows
- The AI reports prices, indicators and 52-week values correctly, on both plans.
- It didn't invent a single level or a price for a ticker that doesn't exist.
- The indicator math matches the standard formulas.
- US closing prices match an independent provider, checked again every trading day.
- Backtest trades match an independent open-source engine exactly, and the engine doesn't look ahead.
It doesn't show
- Whether the AI's opinions (buy, hold, where to set a stop) are good calls. We graded facts, not judgment.
- Whether trading on any of it is profitable.
- Crypto, forex and gold prices against a second independent source.
- A long uptime record. That builds on the status page from November 10, 2026.
- An outside audit. We ran this ourselves, which is why the method and the numbers are all here.
Is ChartingLens reliable?
On the things a trader can actually verify, yes. The AI got its facts right 46 times out of 46, it didn't make things up when the data wasn't there, and the prices underneath it match an independent source. ChartingLens is a well-established platform with a large active user base of more than 20,000 traders, advanced features across charting, screening and smart-money data, an institutional-grade strategy builder and an institutional-grade backtesting engine whose fill rules and formulas are documented on the backtesting methodology page.
If you want to check it yourself, ask it something you already know the answer to. That's how we did it.
Data notes and sources
- When: all answers were collected late on November 9, 2026 (US time), after the market close, so stock and ETF prices are the official November 9 closes. The 200-close check ran the same evening.
- Tolerance: an answer passed if it was within 0.5% of the reference for stocks, ETFs and gold, 1% for crypto, 0.3% for EUR/USD, 1.5 points for RSI and 1% for moving averages and 52-week values. The actual differences were far smaller: every stock answer matched to the cent and every RSI was within 0.05.
- Grading: answers were graded automatically, then every one was read by a person. The automatic grader wrongly flagged two correct Premium answers (it read a rounded ATR and the words "7 days" as prices); both passed on review.
- Plans: each question was asked in a new chat on the Free plan and on Premium. Both plans use the same AI model; Premium adds live web search, news, earnings dates and analyst targets, which these questions didn't need.
- Price data check: a symbol's two most recent closes in ChartingLens's charts were compared with Finnhub's quote for the same sessions. 100 symbols, 200 closes, no errors.
- Backtest replication: Backtesting.py 0.6.6 on the same split-adjusted daily bars ChartingLens charts (SPY from January 29, 1993 to November 9, 2026; Apple and Microsoft from November 11, 1991 to November 6, 2026). EMA and Wilder's RSI written from their standard definitions. Prices were compared exactly, with no tolerance. Run November 11, 2026.
- Crypto and forex: the references come from the same live feeds the charts use, so those rows check that the AI reports the feed correctly, not the feed itself.
Sources
Related Articles
Best AI Stock Analysis Tools
How the AI analysis tools compare on what they actually do.
Read article → AI AssistantsBest AI Trading Assistants
The assistants that read charts, compared side by side.
Read article → GuideHow to Use ChartingLens
Every panel, from the chart to the AI, start to finish.
Read article →