By ChartingLens TeamUpdated May 8, 202622 min read
📅 May 2026 Update
ChartingLens just launched a new tier structure — Premium at $14.99/mo with sensible quotas (20 alerts, 10 layouts, 20 AI credits/day) and Pro at $29.99/mo with unlimited everything. The Free tier is unchanged: real-time stocks, crypto, forex & metals, all chart types, all drawing tools, cloud sync, and insider data. Yearly plans save 17%. Compare all plans →
Finviz built its reputation as the go-to stock screener for retail traders. The heat maps became iconic — a single glance tells you which sectors are bleeding and which are rallying. The stock snapshot pages pack key fundamentals, technical signals, and analyst ratings into a single view. And the screener itself, with its dozens of filters for market cap, P/E ratio, RSI, and moving average criteria, remains one of the most efficient ways to narrow down the universe of tradeable stocks.
But in 2026, a growing number of traders are searching for the best Finviz alternative — and the reasons go deeper than just price. The most fundamental issue is that Finviz is a screening platform with charts attached as an afterthought, not a charting platform with screening built in. The charts are essentially static images. You cannot interact with them in any meaningful way on the free tier — no drawing trendlines, no adding multiple indicators, no zooming into price action. Even on Elite at $39.99 per month, the charting experience is basic compared to what modern platforms deliver for free.
The second issue is the complete absence of AI features. In a year where AI-assisted trading is transforming how retail traders analyze markets, Finviz offers zero AI capabilities. No AI buy/sell signals, no AI trading assistant, no automated chart pattern recognition, no AI-powered backtesting. You screen for stocks, look at a static chart, and do all the analysis yourself. For traders who have experienced AI-powered platforms, going back to Finviz feels like returning to a flip phone after using a smartphone.
Third, Finviz Elite pricing at $39.99 per month is steep for what you get. The primary upgrade from the free tier is real-time data, reduced ads, and marginally better charts. There is no backtesting engine, no insider trading data visualization, no hedge fund holdings, and no technical indicators on charts beyond what the screener filters provide. Compare that to platforms offering AI signals, interactive charting with 40+ indicators, backtesting, and insider data on their free tiers, and the value proposition of Elite erodes quickly.
This guide reviews 10 platforms that serve as genuine Finviz alternatives in 2026. Whether you need better charting to complement your screening workflow, want AI-powered analysis that Finviz does not offer, or simply want to stop paying $39.99 per month for real-time data that other platforms give away for free, you will find the right fit here.
Quick Comparison: All 10 Finviz Alternatives
Here is how all 10 platforms compare across the features that matter most when replacing Finviz.
Scroll horizontally to see all columns →
Platform
Free Tier
AI Features
Screener
Heat Maps
Interactive Charts
Premium Cost
ChartingLens
✓ Full features
✓ AI signals, assistant, patterns
✓ With CL Score
✗
✓ Full suite
$14.99/mo
TradingView
Limited (1 indicator)
✗
✓
✓ Interactive
✓ Extensive
$14.95–$59.95/mo
TC2000
Limited
✗
✓ EasyScan
✗
✓ Solid
$14.99–$89.98/mo
Barchart
✓
✗
✓
Sector overview
Basic
$19.99–$59.97/mo
Thinkorswim
✓ With Schwab acct
✗
✓ Advanced
Custom
✓ Professional
Free
Koyfin
✓ Limited
✗
✓
Market dashboard
Basic
$25–$65/mo
StockCharts
Delayed data
✗
✓ Predefined scans
✗
ACP (limited)
$24.95–$39.95/mo
TrendSpider
✗
✓ Auto trendlines
✓
✗
✓ Advanced
$22–$79/mo
Yahoo Finance
✓ Full access
✗
Basic
Market movers
Basic
$24.99/mo
Webull
✓ With trading
✗
Basic
Market overview
Basic
Free
In-Depth Reviews of All 10 Finviz Alternatives
1. ChartingLens — Best Overall Finviz Alternative
ChartingLensFree + $14.99/mo Premium
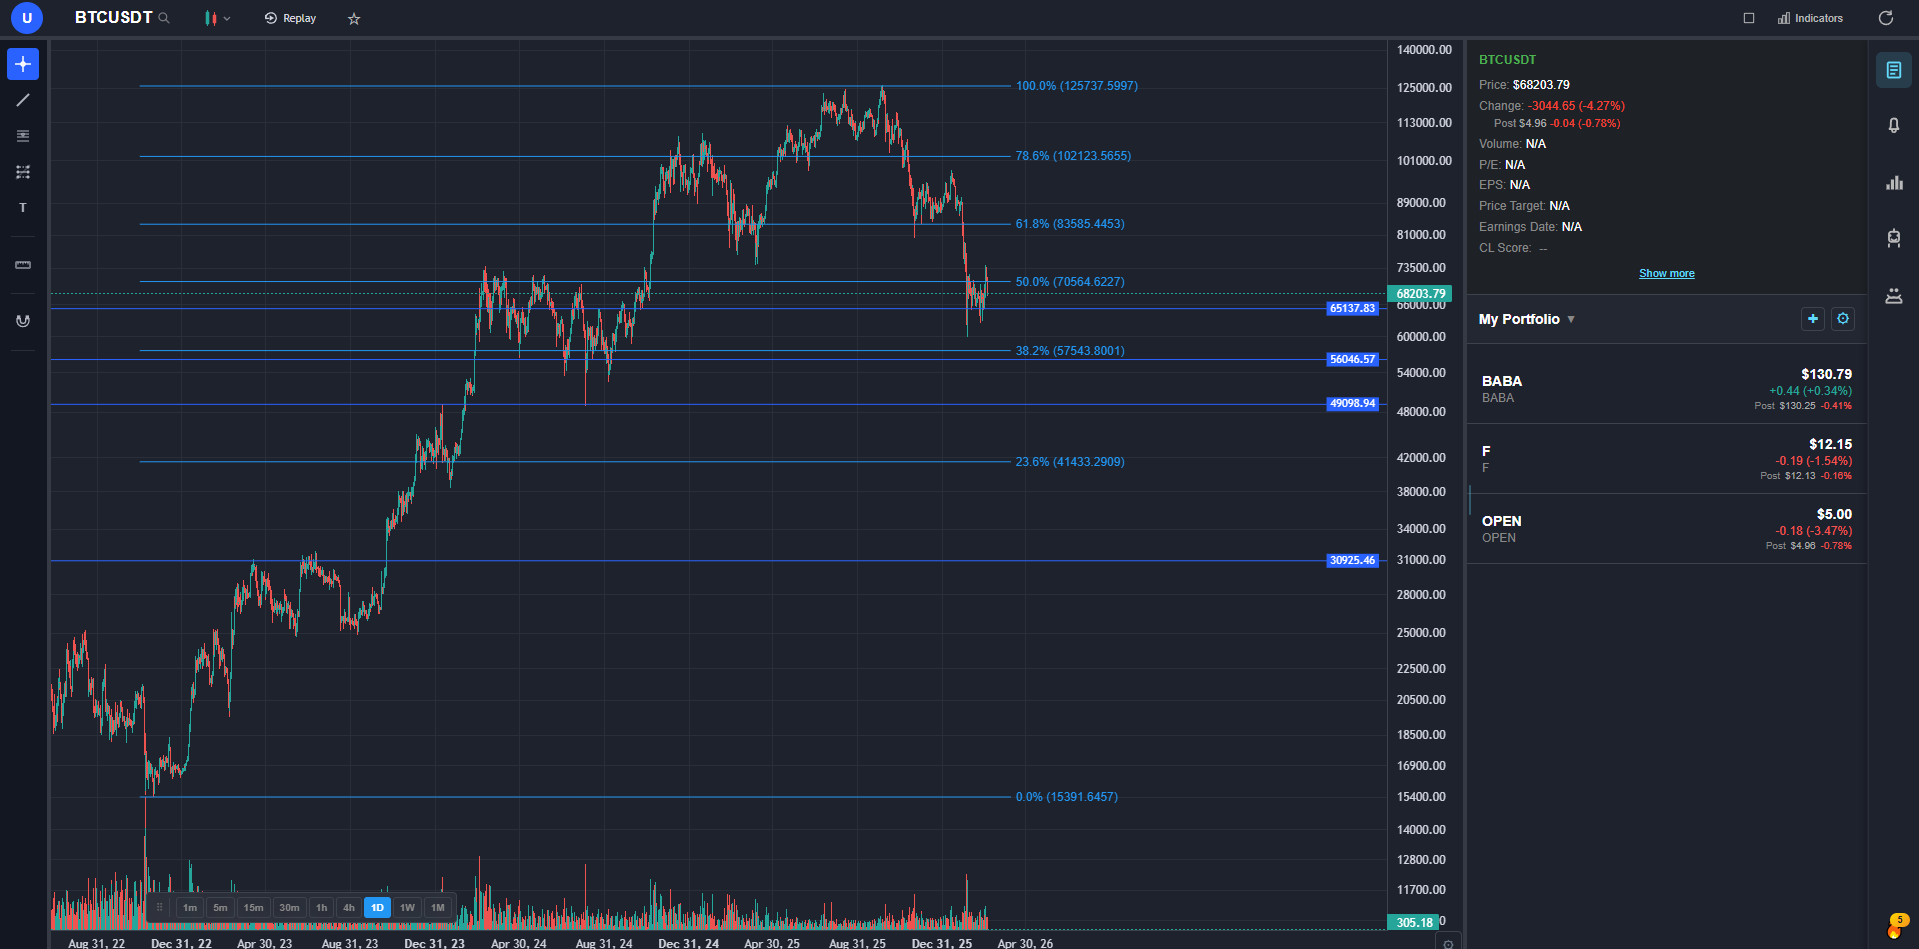
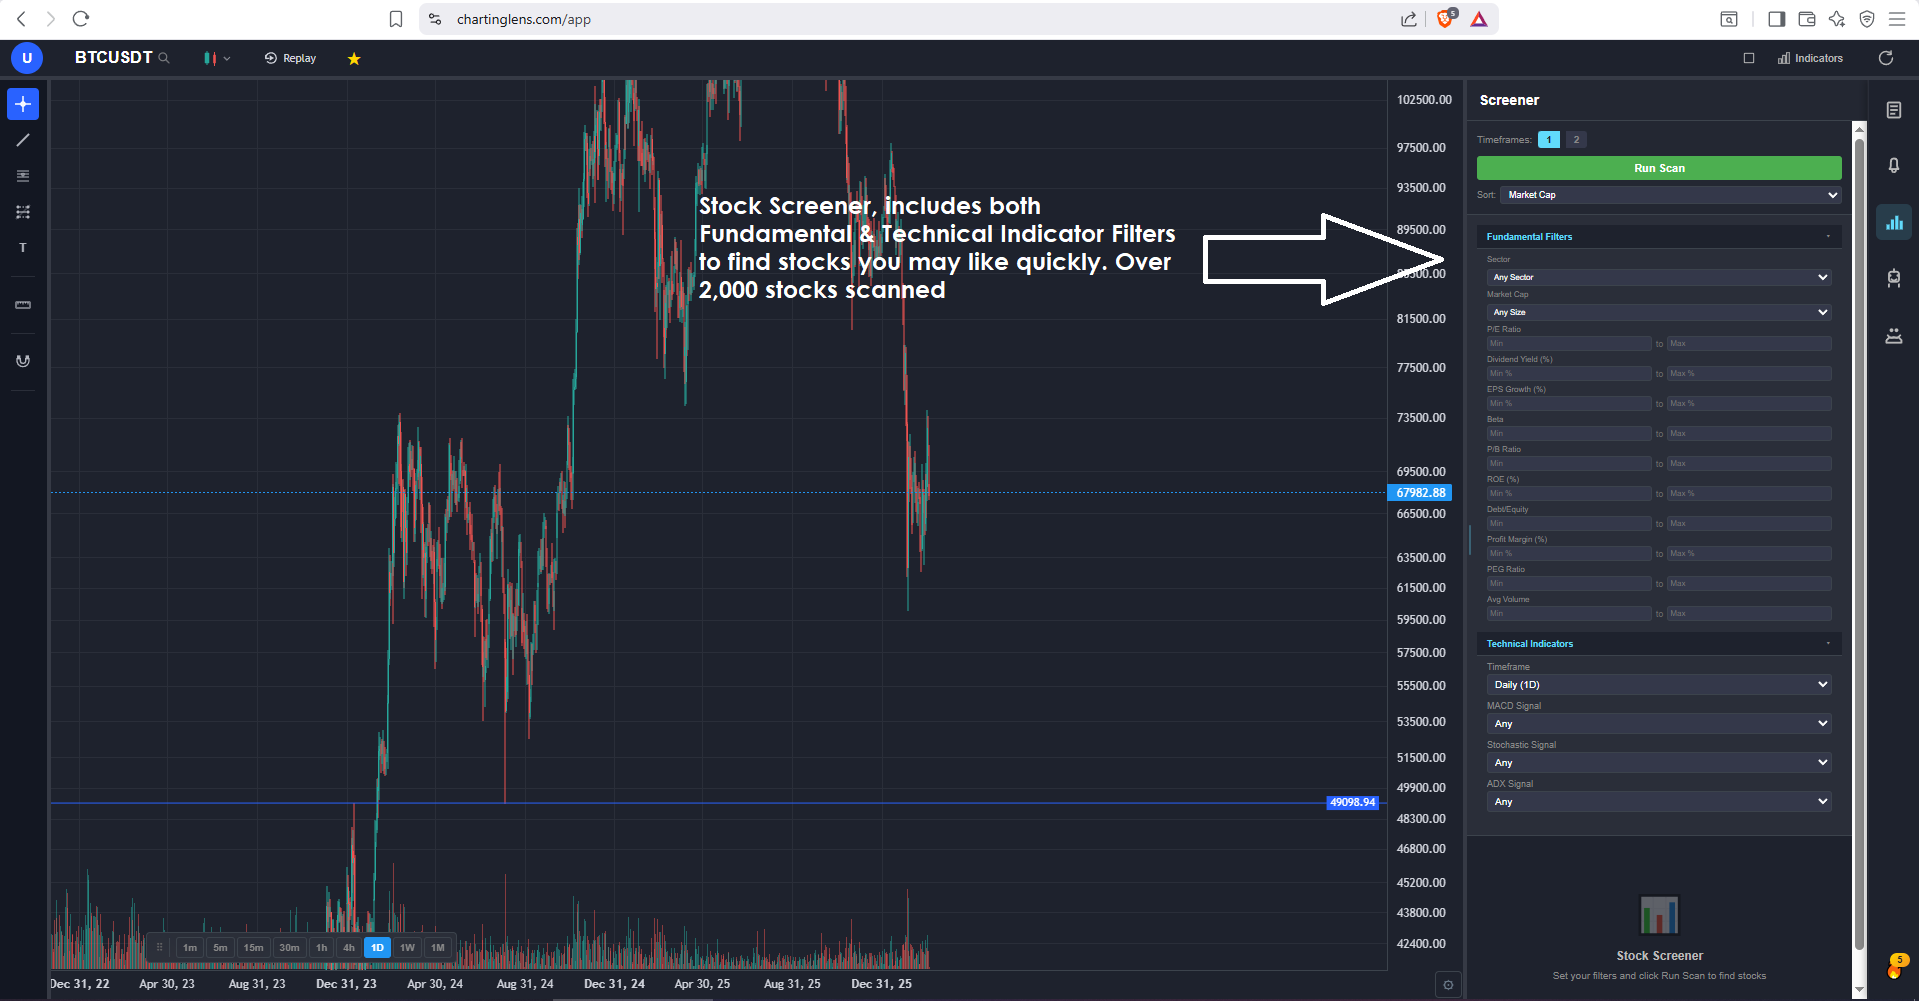
ChartingLens is the most complete Finviz replacement available in 2026, particularly for traders who want their screening workflow connected to real interactive charting and AI-powered analysis. The core problem with Finviz is that screening and charting live in separate worlds — you filter stocks in the screener, then look at a static image that you cannot interact with. ChartingLens unifies these workflows. Its stock screener with CL Score lets you filter and rank stocks, then click through to fully interactive charts with 40+ technical indicators, drawing tools, and AI analysis layered on top — all in one seamless experience.
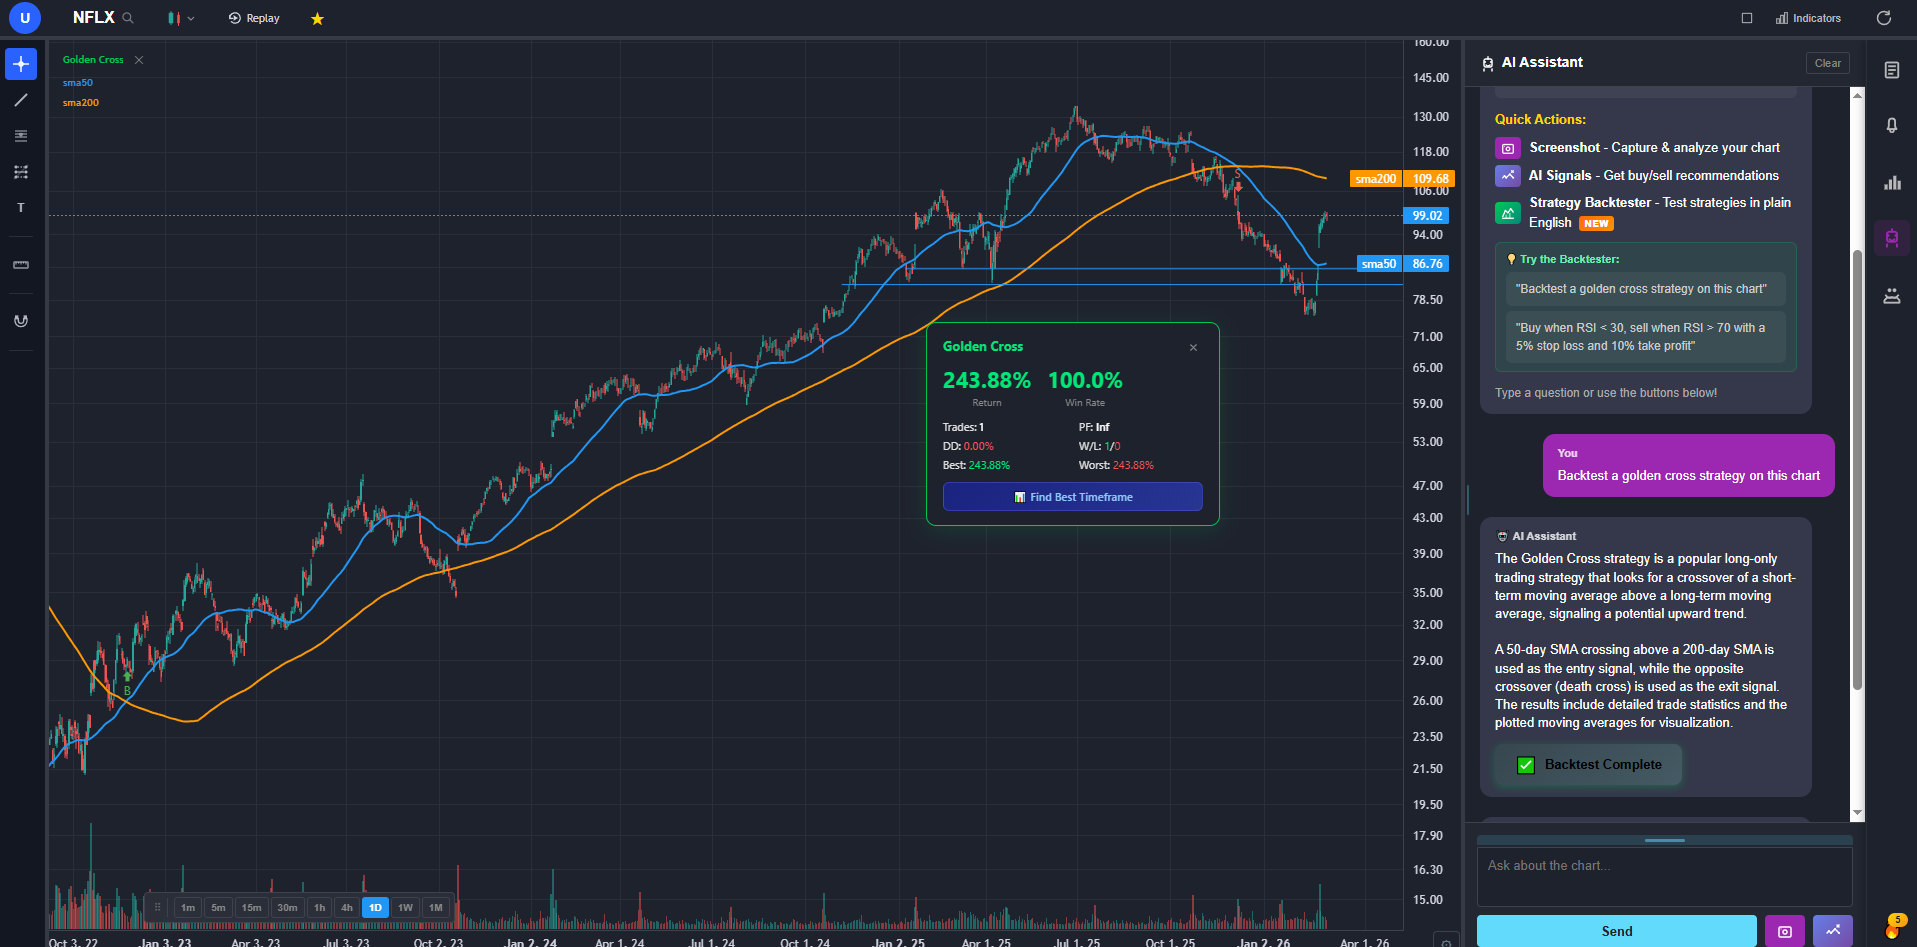
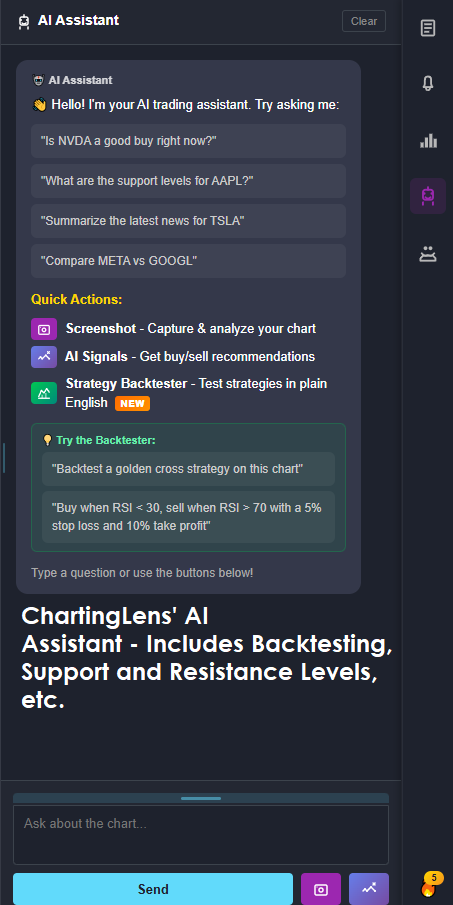
The AI capabilities are where ChartingLens creates the widest gap from Finviz. AI buy/sell signals scan 2,000+ stocks daily and surface actionable trade ideas without requiring you to manually configure screener filters. The AI trading assistant is conversational — ask it about any stock and it responds with analysis, drawing support and resistance levels directly on your chart. Automated chart pattern recognition identifies 13+ patterns including head and shoulders, double tops, wedges, and flags in real time. And the plain-English strategy backtester lets you backtest trading strategies by describing them in normal language — no scripting required. Finviz offers none of these capabilities at any price point.
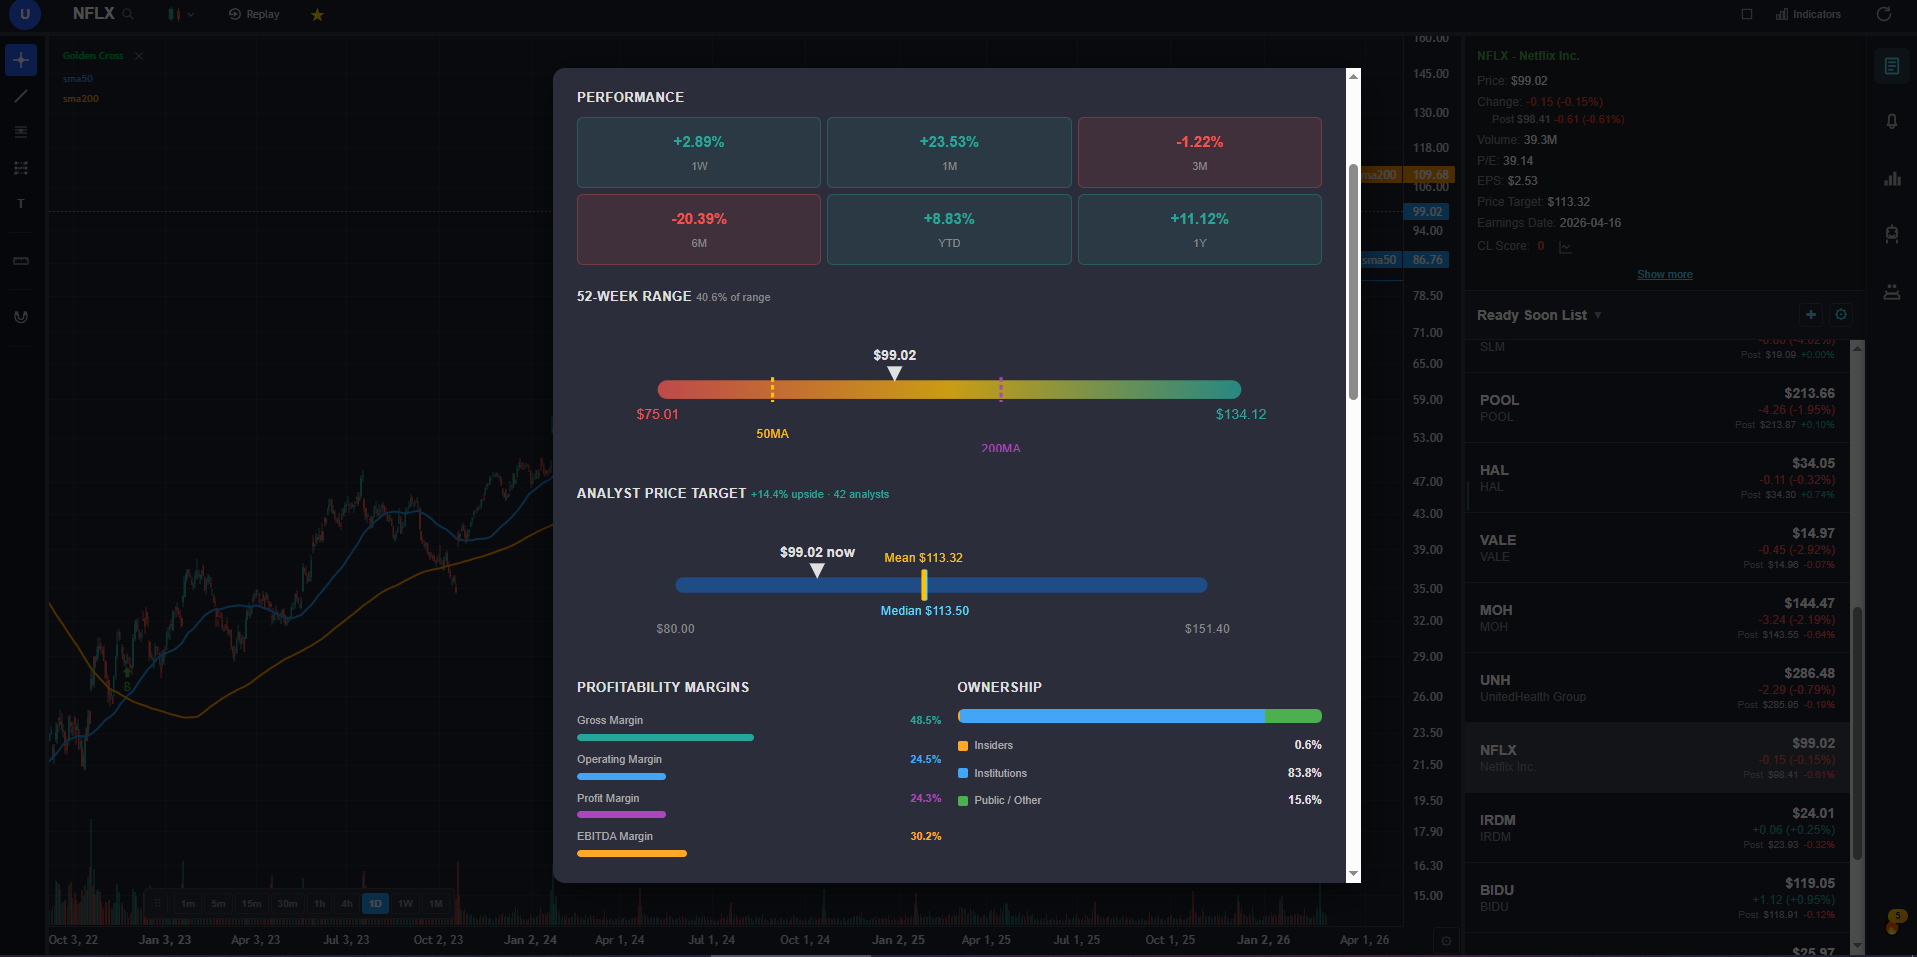
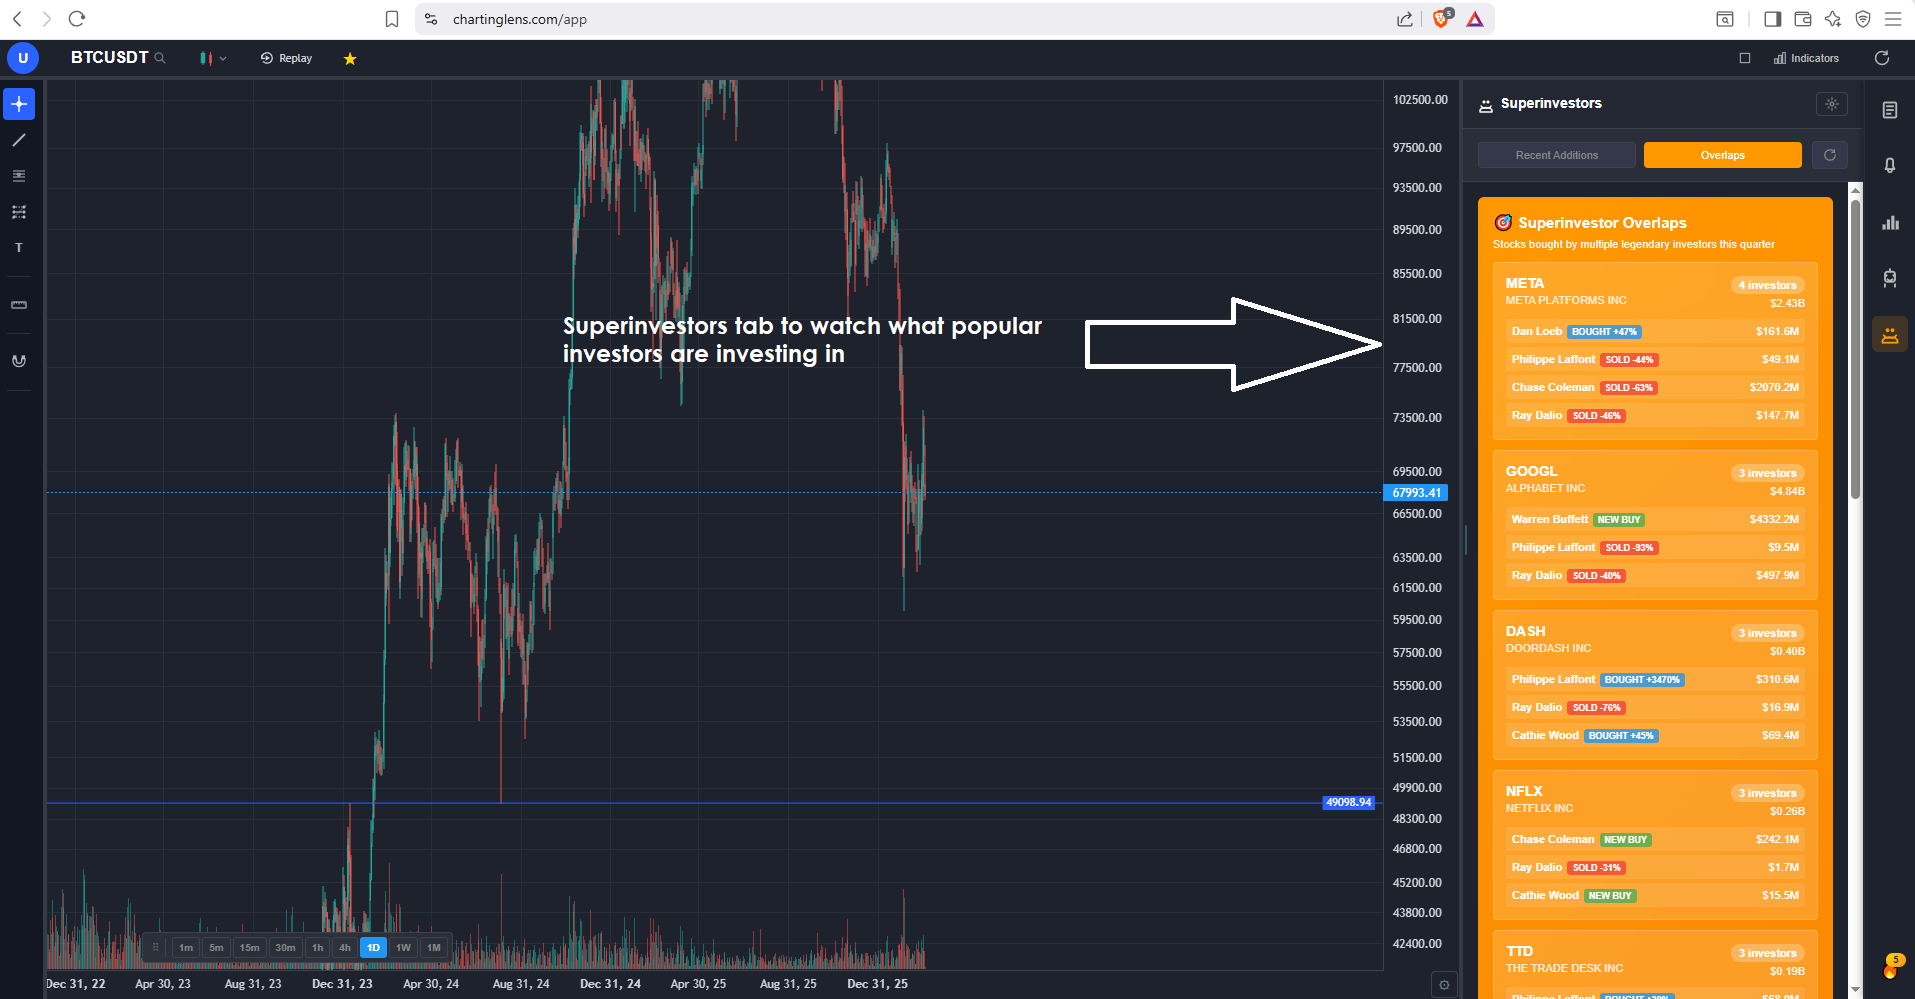
Beyond AI, ChartingLens fills critical gaps in the Finviz feature set. Insider trading data is visualized directly on charts and in dedicated panels — not buried in a snapshot table. Hedge Fund Holdings lets you follow the holdings of Warren Buffett, Michael Burry, and other major fund managers. The company fundamentals panel includes income statements, balance sheets, analyst price targets, and profitability margins. Bar replay with paper trading and live P&L tracking lets you practice trading on historical data. Multi-chart layouts support up to 3 charts in 8 arrangements. And all of this runs in your browser with zero ads on any tier — a stark contrast to Finviz's ad-heavy free experience.
Premium at $14.99 per month adds Volume Profile (VRVP) with auto-updating Point of Control and Value Area lines, unlimited custom backtesting strategies with shorting and time-based filters, expanded AI analysis, trendline alerts, and a Find Best Timeframe feature that tests your strategy across 15-minute, 1-hour, 4-hour, and daily charts. For context, Finviz Elite charges $39.99 per month and still does not offer interactive charting, AI features, or backtesting. You are paying one quarter of the price for dramatically more functionality.
Pros
40+ indicators free, unlimited per chart
AI buy/sell signals scanning 2,000+ stocks daily
AI trading assistant draws S&R on your chart
Plain-English strategy backtester (no coding needed)
Auto chart pattern recognition (13+ patterns)
Volume Profile (VRVP) on Premium at $14.99/mo
Stock screener with CL Score ranking
Real-time insider trading data visualization
Hedge Fund Holdings
Bar replay with paper trading and live P&L
Multi-chart layouts (up to 3 charts, 8 arrangements)
Company fundamentals panel built in
Web-based — no download, works on any device
No ads on any tier
$14.99/mo vs Finviz Elite $39.99/mo
Custom timeframes (NEW) — chart any interval (2h, 45m, 3d, 8h…) aggregated from base bars on the fly. Premium feature, added April 2026.
Cons
No Finviz-style sector heat maps
No direct broker execution or order routing
No futures or forex coverage
Newer platform, smaller community than Finviz
No options chain or options analytics
Best for: Traders who want Finviz-level screening combined with real interactive charting, AI-powered signals, pattern recognition, insider data, and backtesting — all at a quarter of Finviz Elite pricing with no ads.
2. TradingView — Best for Interactive Charting & Pine Script
TradingView$0–$59.95/mo
TradingView is the most widely used web-based charting platform in the world, and for Finviz users whose primary frustration is the static, non-interactive charts, TradingView is the most obvious upgrade. The charting experience is a generation ahead of Finviz — fluid zoom and scroll, extensive drawing tools, hundreds of built-in indicators, and a Pine Script language that lets you create custom studies and automated strategies. If you have ever looked at a Finviz chart and wished you could draw a trendline or add RSI, TradingView solves that immediately.
TradingView also offers its own stock screener, a heat map feature that rivals Finviz's signature visualization, and a massive social community where traders share ideas and indicators. The screener is not as filter-rich as Finviz for fundamental criteria, but it covers the most common technical and fundamental filters. The heat map is interactive — you can drill into sectors, filter by performance period, and customize the display. For traders who want the best of both worlds (screening and charting), TradingView comes closer than Finviz to delivering a unified experience. See our full comparison in the TradingView alternatives guide.
The drawbacks are pricing and the absence of AI. The free tier limits you to 1 indicator per chart, 1 alert, and shows persistent ads. Most Finviz users will need the Plus plan at $29.95 per month or higher to get a workable setup with 5 indicators per chart and 100 alerts — making it cheaper than Finviz Elite but still a significant monthly cost. TradingView has no native AI features — no AI signals, no AI assistant, no automated pattern recognition. You get superb manual charting tools but none of the AI-powered automation that modern platforms like ChartingLens provide.
Best for: Traders who want the most interactive charting experience possible as an upgrade from Finviz's static charts, with Pine Script and a social community.
3. TC2000 — Best for Condition-Based Scanning
TC2000$14.99–$89.98/mo
TC2000 is the strongest alternative for traders who use Finviz primarily as a screener and want more powerful, customizable scanning. Finviz's screener uses a fixed set of dropdown filters — effective for basic screening but limiting when you need complex multi-condition logic. TC2000's EasyScan language lets you build arbitrarily complex scans that combine technical conditions, fundamental criteria, and price action in ways Finviz simply cannot express. If you have ever wished you could filter Finviz results by "stocks where the 20-day EMA just crossed above the 50-day EMA AND volume is 2x the 20-day average AND RSI is between 40 and 60," TC2000 makes that trivial.
The charting is a significant upgrade from Finviz as well. TC2000 provides 70+ built-in indicators with proper drawing tools, clean chart interactions, and the ability to scan directly from charts. The scan-to-chart workflow is tighter than Finviz — results appear in a sortable watchlist and clicking any stock instantly loads a full interactive chart. For traders who use Finviz to build watchlists and then chart those stocks elsewhere, TC2000 consolidates the workflow into a single platform with an integrated broker for stocks and options.
The main downside is pricing. The Silver plan at $14.99 per month is limited in scan capabilities and data access. The Gold plan at $29.99 per month unlocks most features, but the full Platinum experience at $89.98 per month is required for real-time scanning and the deepest feature set. TC2000 also has no AI features, no crypto coverage, no insider data, and no heat maps. It is a specialist scanning and charting tool, not a broad market analysis platform.
Pros
Most powerful condition-based screener (EasyScan)
Fast scan engine with real-time alerts
70+ built-in indicators
Tight scan-to-chart workflow
Integrated broker for stocks and options
Interactive charting far beyond Finviz
Cons
Full features require $89.98/mo Platinum plan
Silver plan at $14.99/mo is very limited
No AI features
No heat maps
No crypto support
No insider data or hedge fund holdings
Best for: Traders who outgrew Finviz's dropdown-style screener and need a custom condition-based scanning engine with interactive charting integrated into the same workflow.
4. Barchart — Best for Broad Market Data Coverage
Barchart$0–$59.97/mo
Barchart is the closest Finviz equivalent in terms of content philosophy — both platforms are data-driven market portals that combine screeners, quotes, data pages, and charting in a web-based interface. Where Finviz focuses primarily on US equities, Barchart extends that approach across stocks, ETFs, futures, forex, options, and indices. If you use Finviz as your daily market dashboard for quick lookups and screening, Barchart offers a broader version of the same experience with 150+ technical indicators and real-time data on the free tier.
The screener covers more asset classes than Finviz and includes Barchart's proprietary Opinion rating system, which scores each stock as a buy, sell, or hold based on a composite of technical indicators. This is similar to the technical signal summaries that Finviz provides on snapshot pages, but Barchart's system is more granular with short-term, medium-term, and long-term breakdowns. The options data on Barchart is also more comprehensive, with unusual options activity, volume leaders, and implied volatility screeners.
The trade-off is that Barchart, like Finviz, has a dated interface that does not feel modern compared to platforms like TradingView or ChartingLens. The charting is functional but basic — drawing tools are limited, and the interactivity lags behind modern standards. There are no AI features at any tier. Premium pricing ranges from $19.99 to $59.97 per month depending on the plan, which adds API access, advanced screeners, and additional data. For traders who want the data-terminal experience that Finviz provides but need it across more asset classes, Barchart is the natural migration path.
Pros
150+ indicators across all major asset classes
Free real-time data for stocks and ETFs
Proprietary Opinion rating system
Comprehensive options data and screeners
Futures, forex, and commodities coverage
Unusual options activity and volume data
Sector overview and market data pages
Cons
Dated interface design
No AI features
Limited drawing tools on charts
No custom scripting
No insider data visualization
Premium is $59.97/mo for full access
Best for: Traders who want the Finviz data-terminal experience extended to futures, forex, options, and commodities with more indicators and broader market coverage.
5. Thinkorswim — Best Free Broker-Integrated Screener
Thinkorswim (by Schwab)Free with Schwab account
Thinkorswim is a professional-grade desktop platform available for free with a Charles Schwab brokerage account, and it offers a dramatically deeper analysis experience than Finviz at every level. The Stock Hacker screener lets you build custom scans using thinkScript — a proprietary scripting language that enables condition-based logic far beyond Finviz's dropdown filters. You can scan for any combination of technical conditions, fundamental criteria, and custom indicator values, with results updating in real time.
The charting is in a different league from Finviz. Thinkorswim provides 300+ built-in indicators, professional drawing tools, multi-timeframe analysis, and the ability to build custom studies with thinkScript. Where Finviz gives you a static chart image, thinkorswim gives you a fully interactive professional charting workspace. The options analytics — probability cones, risk profiles, Greeks analysis, and options flow data — are features that Finviz does not touch. If you trade options alongside stocks, thinkorswim provides the deepest free analytical toolkit available.
The key drawbacks are the learning curve and the desktop-centric design. Thinkorswim is a complex application that takes weeks to learn properly. The web version (thinkorswim.com) is stripped down compared to the desktop client. You need a Schwab brokerage account to access it. And there are no AI features — no AI signals, no AI assistant, no automated pattern recognition. It is the most powerful free traditional platform, but it requires significant investment in learning and is best suited for traders who want maximum manual control over their analysis.
Pros
300+ indicators — far more than Finviz
Stock Hacker screener with thinkScript
Professional options analytics
Free with Schwab brokerage account
Deep backtesting and strategy testing
Multi-asset: stocks, options, futures, forex
Paper trading with simulated execution
Cons
Requires Schwab brokerage account
Desktop-heavy — web version is limited
Steep learning curve
No AI features
Resource-intensive application
No heat maps comparable to Finviz
Best for: Traders who want the deepest free screener and charting platform available and are willing to invest time learning a professional desktop application with a Schwab brokerage account.
6. Koyfin — Best for Fundamental Research
Koyfin$0–$65/mo
Koyfin excels where Finviz snapshot pages leave traders wanting more. While Finviz packs key fundamentals into a single snapshot view, Koyfin delivers a Bloomberg-style terminal experience with deep, customizable dashboards for financial statements, valuation metrics, earnings data, and economic indicators. If your Finviz workflow revolves around researching a stock's fundamentals before making a trading decision, Koyfin offers dramatically more depth — full income statements, balance sheets, cash flow data, and the ability to chart fundamental metrics over time.
The screener covers both fundamental and technical criteria with clean, sortable results. You can build watchlists with custom columns showing any fundamental metric, then overlay earnings and revenue data directly onto price charts. The macro dashboard provides economic data, yield curves, and sector rotation analysis that Finviz does not offer. For investors and swing traders who combine fundamental analysis with technical timing, Koyfin provides the research depth that Finviz snapshots only scratch the surface of.
The charting module includes around 30 technical indicators — fewer than Finviz's screener filters but with actual interactive charts rather than static images. Drawing tools are basic. The free tier has limitations including delayed data and restricted dashboard customization. The Plus plan at $25 per month and Pro plan at $65 per month unlock real-time data, additional screeners, and expanded data access. For purely technical traders who use Finviz for chart-based screening, Koyfin is not the right fit. But for fundamentally-oriented traders, it replaces and significantly upgrades the Finviz snapshot experience.
Pros
Bloomberg-style dashboards and fundamentals
Deep financial statements and valuation data
Fundamental overlays on price charts
Customizable watchlists and screeners
Economic calendar and macro data
Free tier available
Cons
Charting is secondary — ~30 indicators
Delayed data on free tier
No AI features
No broker integration
No heat maps
Basic drawing tools
Best for: Fundamental analysts and investors who want Bloomberg-style research depth that goes far beyond Finviz's snapshot pages, with customizable dashboards and deep financial data.
7. StockCharts — Best for Classical Technical Analysis
StockCharts$24.95–$39.95/mo
StockCharts occupies a different niche than Finviz — where Finviz is screening-first with minimal charting, StockCharts is charting-first with predefined scans. For traders who found Finviz's screener useful but were frustrated by the static charts, StockCharts provides a more technical-analysis-focused environment with Point & Figure charts, Renko charts, market breadth indicators like the Advance-Decline Line and Bullish Percent Index, and predefined scan lists that filter stocks by classical technical patterns. See our full StockCharts alternatives comparison.
The predefined scans complement Finviz's filter-based approach. Where Finviz lets you screen by numerical criteria (RSI above 50, P/E below 20), StockCharts offers curated scan lists like "Bullish Engulfing Patterns," "Stocks Above 200-Day Moving Average," and "New Highs in Strong Sectors." These pattern-based scans identify setups that Finviz's numerical filters would miss. The charting with the Advanced Charting Platform (ACP) is interactive and supports multiple indicators, though the experience still feels dated compared to modern platforms.
The downsides mirror Finviz's own weaknesses in different areas. StockCharts charges $24.95 to $39.95 per month with no free real-time data tier. There are no AI features whatsoever. The screener is predefined — you cannot build custom scans like TC2000's EasyScan. And the overall interface feels like a platform built for a previous era. For classical technical analysts who want chart types and breadth data that Finviz does not offer, StockCharts fills a genuine gap. But at $25 or more per month with no AI, it is a hard sell against modern alternatives.
Pros
Point & Figure and Renko chart types
Market breadth indicators (AD Line, BPI)
Predefined technical pattern scans
Sector rotation analysis tools
Educational content and charting school
ACP interactive charting platform
Cons
$24.95–$39.95/mo with no free real-time tier
No AI features at any price
Dated interface design
Cannot build custom scans
No insider data or hedge fund holdings
No heat maps
Best for: Classical technical analysts who need Point & Figure charts, market breadth indicators, and predefined pattern scans that Finviz does not offer.
8. TrendSpider — Best for Automated Technical Scanning
TrendSpider$22–$79/mo
TrendSpider brings automation to the scanning and charting workflow in a way that neither Finviz nor most traditional platforms can match. The core value proposition is automated technical analysis — trendlines are drawn automatically across multiple timeframes, Fibonacci levels are auto-calculated, and candlestick patterns are flagged in real time. For Finviz users who screen for technical setups and then manually analyze charts, TrendSpider automates the second half of that workflow, saving hours of manual drawing and pattern identification.
The multi-timeframe analysis feature is particularly useful for Finviz migrants. Where Finviz gives you a single static chart view, TrendSpider overlays trendlines and indicators from multiple timeframes onto a single chart — showing you how daily, weekly, and monthly support and resistance levels interact on an intraday chart. The screener includes technical condition filters and the backtesting engine lets you test strategies with coded or visual rule builders. The Raindrop chart type combines price action with volume data in a proprietary visual format.
The significant drawback is that TrendSpider has no free tier. Entry starts at $22 per month for the Essential plan with limited features, and the Elite plan at $79 per month is required for the full experience. For traders used to Finviz's free screener, paying $22 or more per month for charting automation is a different value proposition entirely. TrendSpider also lacks AI buy/sell signals, an AI trading assistant, insider data, and hedge fund holdings. It automates technical analysis but does not provide the AI-driven intelligence that ChartingLens offers.
Pros
Automated trendline detection
Multi-timeframe analysis on one chart
Smart alerts with technical conditions
Raindrop charts (proprietary chart type)
Backtesting with coded strategies
Auto Fibonacci and pattern detection
Cons
No free tier at all
$22–$79/mo is expensive
Steep learning curve
No AI buy/sell signals or AI assistant
No insider data or hedge fund holdings
No heat maps
Best for: Technical traders who want to automate the trendline drawing, pattern detection, and multi-timeframe analysis that Finviz's static charts make impossible.
9. Yahoo Finance — Best Completely Free Option
Yahoo FinanceFree + $24.99/mo Plus
Yahoo Finance is the most widely used free financial data platform in the world, and for Finviz users who primarily use the free tier for quick stock lookups, news, and basic screening, Yahoo Finance delivers a comparable experience at no cost with no account required. You get real-time quotes, interactive charts with about 20 technical indicators, financial news from multiple sources, earnings calendars, analyst estimates, and portfolio tracking — all for free. The charting is more interactive than Finviz's free tier, allowing basic drawing and indicator overlay.
Yahoo Finance Plus at $24.99 per month adds enhanced charting, Morningstar and Argus research reports, technical pattern recognition, advanced portfolio analytics, and fair value estimates. At a lower price than Finviz Elite ($39.99/month), Yahoo Finance Plus provides broader content including the research reports and portfolio tools that Finviz lacks. The stock screener covers basic fundamental and technical filters, though it is not as comprehensive as Finviz's filter library.
The limitations are clear for serious traders. The charting is basic — drawing tools are minimal, the indicator library is small, and the charts do not support advanced workflows like multi-chart layouts or replay. There are no AI features, no insider data visualization, no hedge fund holdings, and no backtesting. Ads are heavy on the free tier. Yahoo Finance is best for casual investors who need quick lookups and news, not for traders who rely on Finviz's screener for active trading strategies.
Pros
Completely free with real-time quotes
No account required for basic use
Financial news and earnings calendars
Portfolio tracking
Research reports on Plus tier ($24.99/mo)
Massive global market coverage
Cons
Very basic charting capabilities
Minimal drawing tools
~20 indicators (less than Finviz screener filters)
No AI features
Screener is less comprehensive than Finviz
Heavy advertising on free tier
Best for: Casual investors who want free stock quotes, news, and basic charting without paying for any subscription — as a simple alternative to Finviz's ad-heavy free tier.
10. Webull — Best Mobile Screening App
WebullFree
Webull fills a gap that Finviz has never addressed — mobile screening and charting. Finviz's mobile experience is essentially the desktop site on a smaller screen, which is functional for quick lookups but painful for any real analysis. Webull provides a polished native mobile app with real-time data, about 20 technical indicators, basic drawing tools, and a screener that covers fundamental and technical criteria. For traders who check Finviz on their phone and wish the experience were better, Webull is a dramatic improvement.
The desktop and web platforms are also well-designed, with a modern dark-mode interface and commission-free trading for stocks, options, and ETFs. Webull includes a market overview dashboard with sector performance, top gainers and losers, and most active stocks — covering some of the quick-glance market intelligence that traders use Finviz's heat maps for. Extended hours trading, fractional shares, and a community section add value beyond what Finviz offers.
Where Webull falls short for serious Finviz users is in screening depth and analytical tools. The screener is basic compared to Finviz's dozens of fundamental and technical filters. The indicator library is limited to around 20 studies. There are no AI features, no backtesting, no advanced screener logic, and no heat maps. Webull is a solid trading app with basic screening and charting, not a full replacement for Finviz's analytical depth — but it is completely free and delivers the best mobile experience of any platform on this list.
Pros
Completely free with real-time data
Best-in-class mobile screening and charting
Commission-free stock and options trading
Clean, modern interface
Extended hours trading
Fractional shares
Cons
Screener much less comprehensive than Finviz
Limited indicator library (~20 indicators)
No AI features or advanced analysis
No backtesting
No heat maps
No custom scripting or scan logic
Best for: Traders who want a free, polished mobile app for screening and charting stocks on the go — something Finviz's mobile experience fails to deliver.
What Finviz Gets Wrong in 2026
Finviz earned its reputation with an efficient screener, iconic heat maps, and quick snapshot views. For years, it was one of the first tools traders opened in the morning. But the platform has stagnated while the rest of the industry has transformed. Here are the core problems:
Elite pricing at $39.99/mo for delayed-to-real-time data upgrade: The primary value of Finviz Elite is upgrading from delayed to real-time data. In 2026, platforms like ChartingLens, Barchart, Webull, and TradingView offer real-time data on their free tiers. Paying $39.99 per month for what competitors give away is increasingly difficult to justify.
Essentially non-interactive charts (static image-based): Finviz charts are static images on the free tier. Even on Elite, chart interactivity is minimal compared to any modern charting platform. You cannot draw trendlines with precision, you cannot overlay multiple indicators freely, and you cannot zoom into price action the way interactive charts allow. For traders who need to analyze charts, Finviz is not a charting platform — it is a screening platform with chart thumbnails.
No AI features at any tier: In a year where AI-assisted trading is mainstream, Finviz offers zero AI capabilities. No AI buy/sell signals, no AI assistant, no automated pattern recognition, no AI-powered backtesting. Every analysis on Finviz is manual. Platforms like ChartingLens offer all of these features on their free tiers.
No technical indicators on charts (screening-focused, not charting): While Finviz's screener filters by technical criteria like RSI, MACD, and moving averages, the charts themselves do not display these indicators as interactive overlays. You screen for "RSI above 70" but cannot see RSI plotted on the chart. This disconnect between screening and charting forces traders to use separate tools for analysis.
No backtesting capability: Finviz provides no way to test whether a screening strategy would have been profitable historically. ChartingLens offers a plain-English backtester on its free tier. TrendSpider and thinkorswim offer coded backtesting. Even Finviz Elite at $39.99/month has no backtesting of any kind.
No insider trading data visualization or hedge fund holdings: While Finviz snapshot pages show basic insider transaction tables, there is no visualization, no aggregation, and no hedge fund holdings. ChartingLens provides insider trading data visualization alongside hedge fund holdings for Warren Buffett, Michael Burry, and other major fund managers — all on the free tier.
Free tier shows ads everywhere: Finviz's free experience is cluttered with display ads on every page. ChartingLens has no ads on any tier. TradingView and Barchart show ads on free tiers but with less intrusion than Finviz.
For traders who have been using Finviz out of habit, the gap between what you are settling for and what you could have elsewhere has never been wider. The 2026 charting and screening landscape has leapt forward. Finviz has not.
How to Choose the Right Finviz Alternative
The right alternative depends on which Finviz features you rely on most and what you wish Finviz could do. Here is a decision framework:
If you want screening plus real charting plus AI: ChartingLens. Its stock screener with CL Score plus AI signals plus fully interactive charting provides everything Finviz does — and everything it does not — at a quarter of the Elite price.
If you need the most interactive charting experience: TradingView. The charting is best-in-class with Pine Script, a heat map, and a screener — though the free tier is limited and there are no AI features.
If you need a more powerful custom screener: TC2000. EasyScan lets you build complex multi-condition scans that Finviz's dropdown filters cannot express.
If you want Finviz-style data coverage across more asset classes: Barchart. Same data-terminal philosophy, but covering futures, forex, and options alongside stocks.
If you want free professional-grade screening and charting: Thinkorswim with a Schwab account. Stock Hacker, 300+ indicators, and thinkScript at no cost.
If you need deeper fundamental research: Koyfin. Bloomberg-style dashboards that go far beyond Finviz snapshot pages.
If you need classical TA tools like Point & Figure: StockCharts for P&F charts and market breadth indicators.
If you want AI-powered analysis that Finviz will never offer: ChartingLens. AI signals, AI assistant, auto pattern recognition, and plain-English backtesting — all free.
If you want the best mobile experience: Webull. Free, polished, and commission-free with real-time data and a native mobile screener.
What Changed for Finviz Users in May 2026
Finviz hasn't materially changed in 2026 — that's part of the issue. The screener UI from a decade ago still ships unchanged, and Finviz Elite ($39.99/month) still locks features that competitors give away free. Meanwhile, ChartingLens shipped the screener upgrades and AI tooling that finally make it a serious Elite replacement, and dropped its pricing structure into tiers most Finviz users will find more honest.
New Pricing: Premium $14.99 · Pro $29.99 (vs Finviz Elite $39.99)
ChartingLens replaced its single $9.99 plan with two tiers. Premium at $14.99/month (or $149/year) costs $25/month less than Finviz Elite and includes everything most Elite subscribers actually use — full screener results, real-time data, technical alerts, custom AI indicators, charts. Pro at $29.99/month (or $299/year) is the unlimited tier and still lands $10/month cheaper than Elite. Compare all plans →
One-Click Screener Presets (the feature Finviz never built)
The screener picked up a preset library covering the high-RVOL setups Finviz Elite users typically build manually every morning — $3-10 High RVOL Gappers, Pre-market Gappers (>10%), Low Float Momentum, Penny Stock Movers, Short Squeeze Candidates, Mid Cap Momentum, and Liquid Only (tight spreads). Pick a preset and every relevant filter populates instantly — RVOL, dollar volume, gap %, pre-market %, max bid/ask spread are first-class fields. Free users get 10 results per scan; Premium and Pro see the full list with dual-timeframe confirmation scans (the feature Finviz Elite charges for and ships poorly).
AI Screening for Filtered Stock Searches
Beyond the structured screener, ChartingLens's AI Assistant now handles natural-language stock searches that Finviz can't: ask "find me a low-float biotech with earnings this week and high promise of profit by Friday" and the AI returns 5–10 specific tickers that match every constraint, sourced via web search. For unfiltered momentum scans ("what's hot today"), the AI Buy Signals panel ranks the day's top setups by historical win-rate of similar patterns — Premium gets 25 daily picks, Free gets the top 5. None of this exists on Finviz Elite at any price.
Which ChartingLens Tier Replaces Finviz Elite for You?
Best for fundamental screeners → Premium ($14.99/mo)
If you primarily use Finviz Elite to run fundamental scans — P/E, market cap, debt-to-equity, earnings growth — Premium covers the same ground at less than half the cost, plus adds the new compare_watchlist tool that ranks any watchlist by 17 fundamental metrics in one prompt. The 10-watchlist cap fits anyone who organizes by sector or strategy.
Best for momentum and gap scanners → Premium or Pro
The new screener presets handle 80% of momentum-trader workflows on Premium. If you screen multiple times a day, sort across many watchlists, and want unlimited dual-timeframe confirmation scans, Pro removes the caps. Pro at $29.99/month is still $10/month cheaper than Finviz Elite — and includes AI tooling Finviz simply doesn't have.
Best for swing traders
Swing traders gain the most by switching: Premium's screener covers entry scanning, the AI strategy backtester validates your setup historically, and live strategy alerts email you when the next signal fires across your watchlist. The 13F superinvestor portfolio tracker (Buffett, Burry, Ackman, Druckenmiller, and seven more) helps confirm swing entries align with smart-money positioning. See our swing-trading screener guide →
Frequently Asked Questions
ChartingLens is the best free Finviz alternative in 2026. It offers a stock screener with CL Score ranking, AI buy/sell signals scanning 2,000+ stocks daily, 40+ technical indicators on fully interactive charts, an AI trading assistant, auto chart pattern recognition for 13+ patterns, insider trading data, hedge fund holdings, and a plain-English strategy backtester. Unlike Finviz, ChartingLens charts are fully interactive — not static images — and there are no ads on any tier.
For most traders, Finviz Elite at $39.99 per month is difficult to justify in 2026. The primary upgrade is real-time data and slightly improved charts, but the charts remain essentially non-interactive compared to modern platforms. Elite has no AI features, no meaningful backtesting, and no insider data visualization. ChartingLens offers AI signals, interactive charting, pattern recognition, backtesting, insider data, and hedge fund holdings for free — with Premium at just $14.99/mo. You get dramatically more functionality for a quarter of the price.
TC2000 offers more powerful condition-based scanning with its EasyScan language, allowing you to build complex multi-condition scans that Finviz cannot match. ChartingLens combines a stock screener with CL Score ranking plus AI buy/sell signals that scan 2,000+ stocks daily — giving you AI-enhanced screening rather than just filter criteria. Thinkorswim's Stock Hacker with thinkScript also supports more sophisticated scan logic than Finviz's dropdown filters.
TradingView offers a free interactive stock heat map that is similar to Finviz's signature visualization, with the ability to drill into sectors and customize the display. Barchart provides sector-level market overview tools. However, no free platform exactly replicates Finviz's heat map experience. If heat maps are your primary use case, Finviz's free tier remains the best option for that specific feature. For overall market analysis, ChartingLens's AI buy/sell signals and screener with CL Score provide more actionable intelligence than a heat map alone.
Yes. ChartingLens includes a company fundamentals panel with income statements, balance sheets, analyst price targets, and profitability margins on its free tier. Koyfin offers Bloomberg-style fundamental dashboards with deep financial statements and valuation metrics. Yahoo Finance provides earnings data, analyst estimates, and financial summaries at no cost. All three platforms deliver fundamental data comparable to or exceeding what Finviz offers in its stock snapshot pages.
ChartingLens is the best platform that combines screening with real interactive charting. Its stock screener with CL Score lets you filter and rank stocks, then click through to fully interactive charts with 40+ indicators, drawing tools, and AI analysis — all in one platform. Finviz separates screening from charting and delivers only static chart images. TC2000 also combines scanning with interactive charting, but starts at $14.99/mo with full features requiring the $89.98/month Platinum plan.
ChartingLens is the cheapest Finviz alternative with AI features — because its AI features are free. The free tier includes AI buy/sell signals scanning 2,000+ stocks, an AI trading assistant that draws support and resistance on your chart, and automated chart pattern recognition for 13+ patterns. Premium at $14.99/mo adds Volume Profile (VRVP), unlimited custom backtesting, and expanded AI analysis. Finviz has no AI features at any price. TrendSpider starts at $22/month for automated analysis but lacks the breadth of ChartingLens's AI toolkit.
Conclusion: The Best Finviz Alternative Depends on Your Workflow
Finviz built the gold standard for stock screening and heat map visualization, and those features still work well in 2026. But the platform has not evolved beyond its original vision. The charts are still static. There are still no AI features. The Elite plan still costs $39.99 per month for real-time data that competitors give away for free. If all you need is a quick screener and heat map, Finviz's free tier still serves that purpose. But if you need more — interactive charting, AI analysis, backtesting, insider data — Finviz is no longer enough.
For most traders looking for the most complete Finviz alternative, ChartingLens offers the broadest feature set at the lowest cost. Its combination of a stock screener with CL Score, AI buy/sell signals scanning 2,000+ stocks, an AI trading assistant, auto chart pattern recognition, plain-English backtesting, insider trading data, hedge fund holdings, and fully interactive charts with 40+ indicators — all on a free tier with no ads — represents a platform that does not just replace Finviz's screening. It adds an entire layer of AI-powered analysis and interactive charting that Finviz has never offered at any price point. Premium at $14.99 per month adds Volume Profile, unlimited backtesting, and expanded AI analysis — still one quarter of what Finviz Elite charges.
If you need specific capabilities — Pine Script and community (TradingView), condition-based scanning (TC2000), multi-asset data coverage (Barchart), free professional desktop tools (thinkorswim), deep fundamental research (Koyfin), classical TA chart types (StockCharts), or automated trendlines (TrendSpider) — the alternatives above cover every use case. The best approach is to try the platforms that match your workflow. If you want to start with the one that gives you the most out of the box, ChartingLens is the clear first stop. And if real-time news and squawk are the bigger priority for you than screening, see our comparison of the best Benzinga Pro alternatives.
Get AI signals, strategy backtesting, insider data, hedge fund holdings, interactive charts, and a stock screener with CL Score. No download required. No credit card needed.