1. What the ADX Indicator Measures
Most indicators try to tell you which way price is going. ADX doesn't. It answers a different and, I'd argue, more useful question: is there a trend worth trading right now, or is this market just going sideways?
That's the whole job. ADX reads high when price is moving decisively in one direction, and it doesn't care which direction. A stock grinding higher and a currency pair falling apart can both show an ADX of 40. When the market chops back and forth with no follow-through, ADX sinks toward single digits.
The indicator comes from J. Welles Wilder's 1978 book New Concepts in Technical Trading Systems, the same book that gave us RSI, the Average True Range and Parabolic SAR. Wilder called the full system the Directional Movement Index (DMI). It has three lines:
- ADX, the trend-strength line, scaled from 0 to 100.
- +DI (the positive directional indicator), which tracks how much of recent movement was upward.
- -DI (the negative directional indicator), which tracks the downward share.
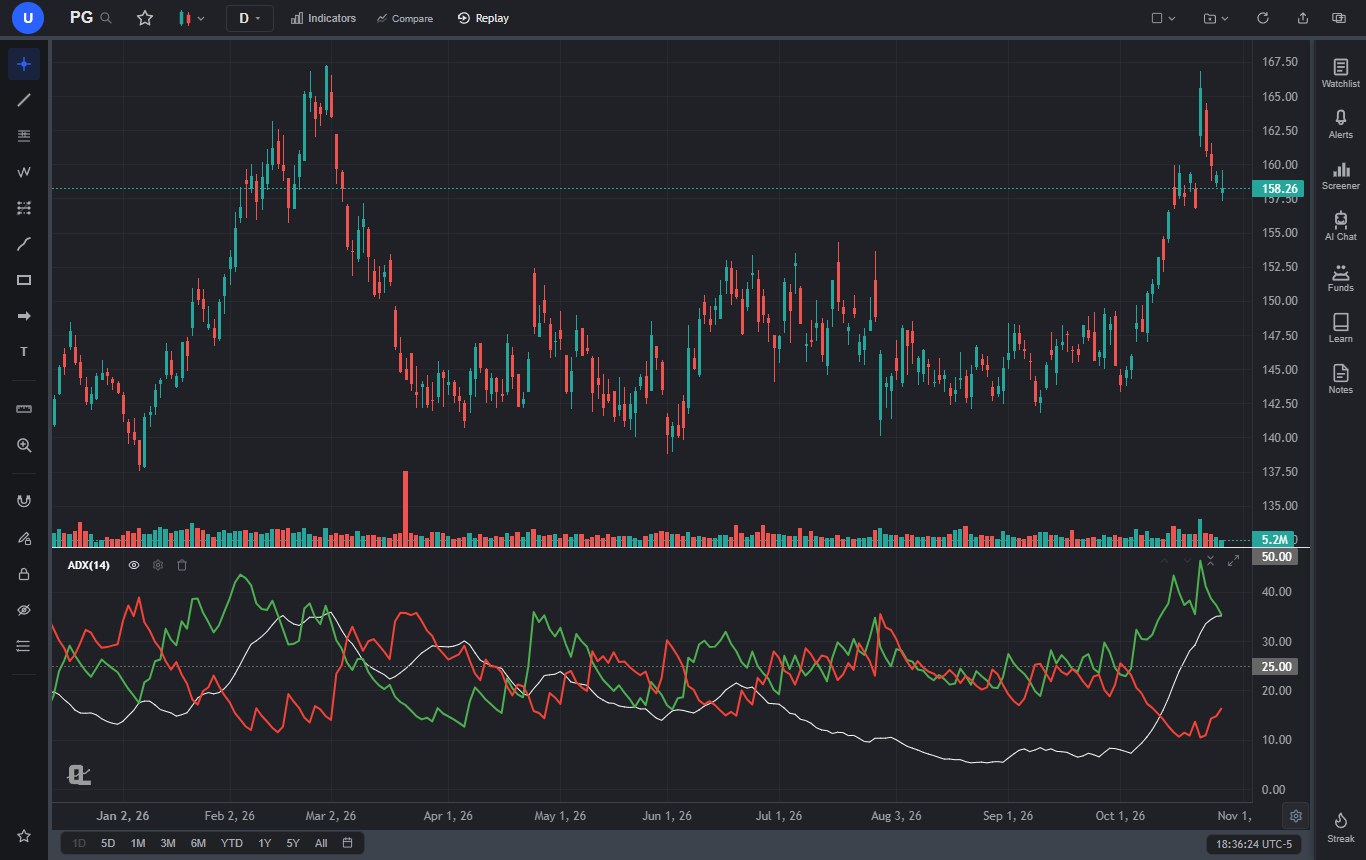
Most platforms, ChartingLens included, plot all three together in one pane and call the whole thing ADX. Look at the PG chart above. From April to early October the stock went nowhere, bouncing between roughly $140 and $155, and ADX drifted down until it hit 5.3 in late August. The red and green lines braided around each other the entire time. Then PG broke out in October, +DI shot up, and ADX turned and climbed through 25. You can read the whole story of that year from the pane at the bottom without ever looking at the candles.
The one-sentence version: ADX tells you how hard the market is pushing, +DI and -DI tell you which way, and the combination tells you which kind of strategy has a chance of working today.
2. How ADX Is Calculated, in Plain English
You'll never compute ADX by hand. Still, knowing what goes into it explains almost every quirk you'll see on the chart: why it lags, why it collapses when the DI lines meet, and why two platforms can show slightly different numbers for the same day. Here's the recipe, using the standard 14 periods.
Step 1: Directional movement (+DM and -DM)
On every bar, compare today's range with yesterday's.
- Up move = today's high minus yesterday's high.
- Down move = yesterday's low minus today's low.
- +DM = the up move, but only if it's positive and bigger than the down move. Otherwise zero.
- -DM = the down move, but only if it's positive and bigger than the up move. Otherwise zero.
So on any single bar, at most one of the two gets a value. An inside bar, where the high is lower and the low is higher, scores zero on both. That detail matters later: a market full of inside bars and overlapping ranges starves both lines, which is part of why ADX falls in consolidation.
Step 2: True Range
True Range is the largest of three numbers: today's high minus today's low, the distance from today's high to yesterday's close, and the distance from today's low to yesterday's close. It's the same True Range that powers ATR, and it exists so that overnight gaps count as movement.
A quick worked example
Say yesterday had a high of 100.00, a low of 98.00 and a close of 99.00. Today the high is 101.50, the low is 99.20 and the close is 101.00.
- Up move = 101.50 - 100.00 = 1.50. Down move = 98.00 - 99.20 = -1.20, which is negative.
- So +DM = 1.50 and -DM = 0.
- True Range = the largest of 2.30 (high minus low), 2.50 (high minus yesterday's close) and 0.20 (low minus yesterday's close) = 2.50.
Step 3: Wilder's smoothing
Next, smooth TR, +DM and -DM over 14 periods with Wilder's method. The first value is the total (or average) of the first 14 readings. After that, each new value is the previous smoothed value minus a fourteenth of itself, plus the new reading. In average form, that's (previous × 13 + current) ÷ 14.
This is the part most explainers skip, and it's the reason ADX feels slow. Wilder's smoothing gives each new bar a weight of 1/14. A regular exponential moving average with that same weight would be a 27-period EMA. So a "14-period" ADX is really built from averages that behave like 27-period ones, and then it gets smoothed a second time in Step 5.
Step 4: +DI and -DI
Divide each smoothed directional movement by smoothed True Range and multiply by 100:
- +DI = 100 × smoothed +DM ÷ smoothed TR
- -DI = 100 × smoothed -DM ÷ smoothed TR
Dividing by True Range puts the two lines on a common scale, so you can compare them across a $20 stock and an $80,000 coin.
Step 5: DX, then ADX
The Directional Index (DX) measures how far apart the two DI lines are, relative to their total:
- DX = 100 × |(+DI) - (-DI)| ÷ ((+DI) + (-DI))
If +DI is 30 and -DI is 15, DX is 100 × 15 ÷ 45 = 33.3. If they're 22 and 20, DX drops to 4.8. That's the mechanical reason ADX sinks in ranges: when buyers and sellers take turns, the DI lines converge and DX collapses.
Finally, ADX is DX smoothed with Wilder's method over another 14 periods. The first ADX is the simple average of the first 14 DX values, and every value after that is (previous ADX × 13 + current DX) ÷ 14.
ADX formula, quick reference
- +DM and -DM from today's high and low versus yesterday's (only the larger positive move counts).
- True Range = max(high - low, |high - previous close|, |low - previous close|).
- Wilder-smooth TR, +DM and -DM over 14:
(previous × 13 + current) ÷ 14. - +DI = 100 × smoothed +DM ÷ smoothed TR. -DI = 100 × smoothed -DM ÷ smoothed TR.
- DX = 100 × |+DI - -DI| ÷ (+DI + -DI).
- ADX = Wilder-smoothed DX over 14, seeded with the average of the first 14 DX values.
Two practical consequences. First, the first ADX value doesn't appear until roughly bar 28, because it needs 14 bars to seed the DI lines and another 14 DX values to seed itself. Second, because each value carries a little memory of everything before it, ADX needs a long run of history to settle. Calculated on 30 bars, it won't match the same day calculated on 150 or more. If you've ever compared ADX across two apps and gotten slightly different numbers, that's usually why. ChartingLens computes it on the full history the chart has loaded, which on a daily stock chart usually goes back decades.
3. How to Read ADX Levels: 20, 25 and Beyond
Here are the bands most traders use. I want to be clear about where they come from: they're rules of thumb that became standard because they work well enough on daily stock charts, not laws of physics. Some traders use 20 as the trend line, others use 25, and plenty treat everything between the two as a gray zone.
| ADX reading | Common interpretation | What I'd do with it |
|---|---|---|
| Below 20 | Weak or no trend. Range, chop or a quiet market. | Favor range tactics. Ignore most DI crossovers. Watch for a coil. |
| 20 to 25 | Gray zone. A trend may be starting, or may not. | Watch the slope. A rising line here gets my attention; a flat one doesn't. |
| 25 to 40 | Trending market. | Trend tactics: pullbacks and breakouts in the direction of the dominant DI line. |
| 40 to 50 | Strong trend. | Hold and trail. Don't fade it, but don't chase a late entry either. |
| Above 50 | Very strong, often late in the move. | Tighten stops. A turn down from here often marks the end of the impulse, not the trend. |
ChartingLens draws dashed guide lines at 25 and 50 in the ADX pane by default, which is a sensible pair: one for "a trend exists" and one for "this is getting extreme." Readings above 60 do happen, especially in crypto crashes, but they're uncommon on daily charts.
The single most useful habit I've picked up with ADX is reading the slope before the level. A line climbing from 15 to 22 is telling me a trend is being born. A line sitting flat at 30 for two weeks tells me there was a trend, and it's losing energy. The number alone hides that difference.
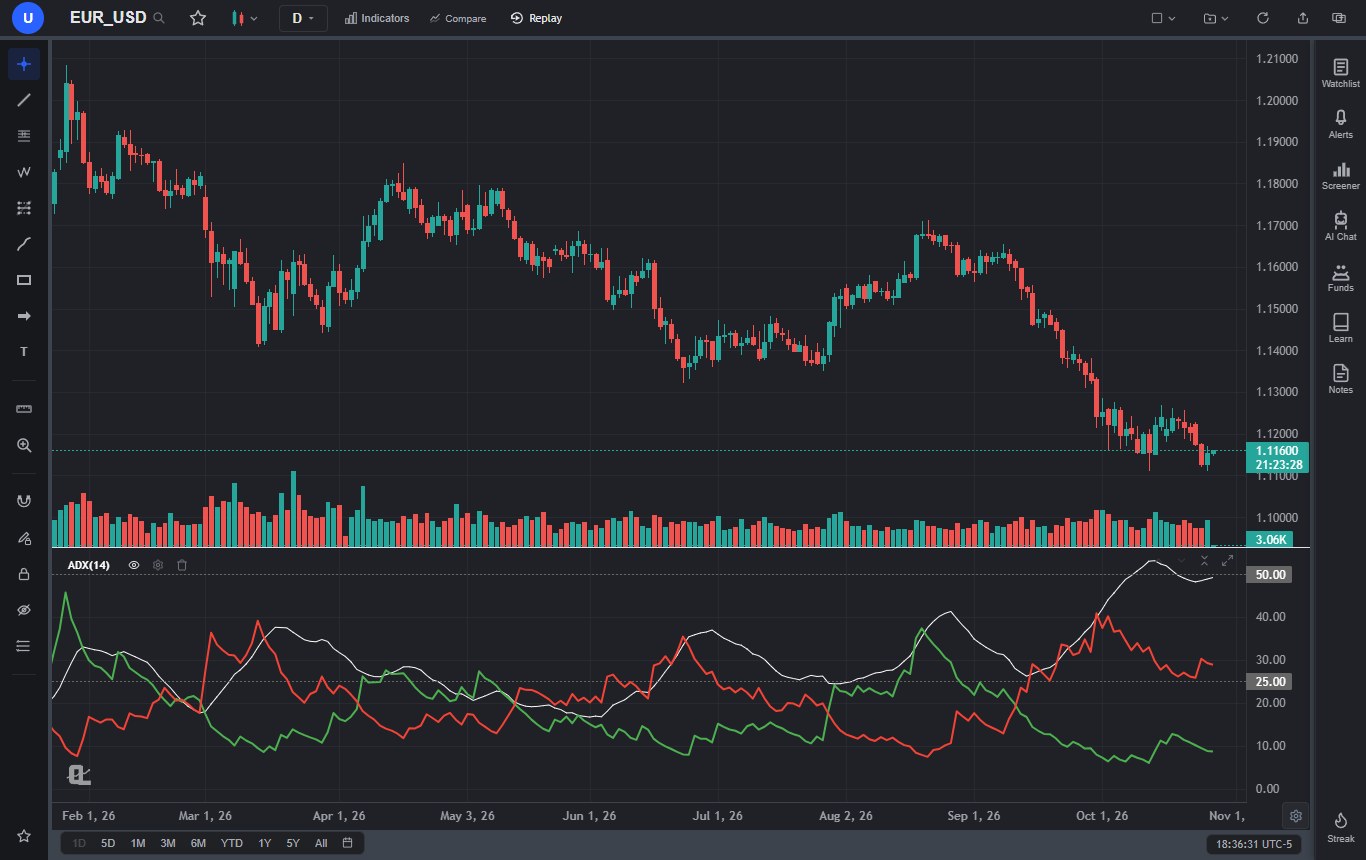
The EUR/USD chart is the cleanest illustration I've found of ADX being direction-blind. In August the pair rallied and ADX rose to 41.3. On September 13, -DI crossed above +DI, and the decline that followed took EUR/USD from about 1.17 to a low of 1.11129 on October 13. ADX never dropped below 25 the whole time. The trend didn't pause long enough to register as a range; it just changed sides, and ADX kept climbing to 53.1. Anyone reading "high ADX" as "bullish" would have been buying all the way down.
4. +DI and -DI Crossovers
The classic DMI signals are simple:
- Bullish: +DI crosses above -DI.
- Bearish: -DI crosses above +DI.
Wilder added a stop rule. On a bullish cross, the low of the crossover bar became the initial stop, and the signal stayed valid until that low broke, even if the lines crossed back first. Bearish crosses used the high of the bar. It's a good rule because it ties the signal to a real price level instead of to two wobbling lines. A common extra filter is to act only once price trades beyond the crossover bar's high (for longs) or low (for shorts).
Here's the problem: DI crossovers are frequent, and most of them happen when nothing is trending. Between July 1 and October 5, 2026, the PG chart at the top of this page printed 21 DI crossovers. ADX was under 17 on every one of them, and the stock went nowhere. Trade each one and you'd have paid the spread 21 times for the privilege of being chopped up.
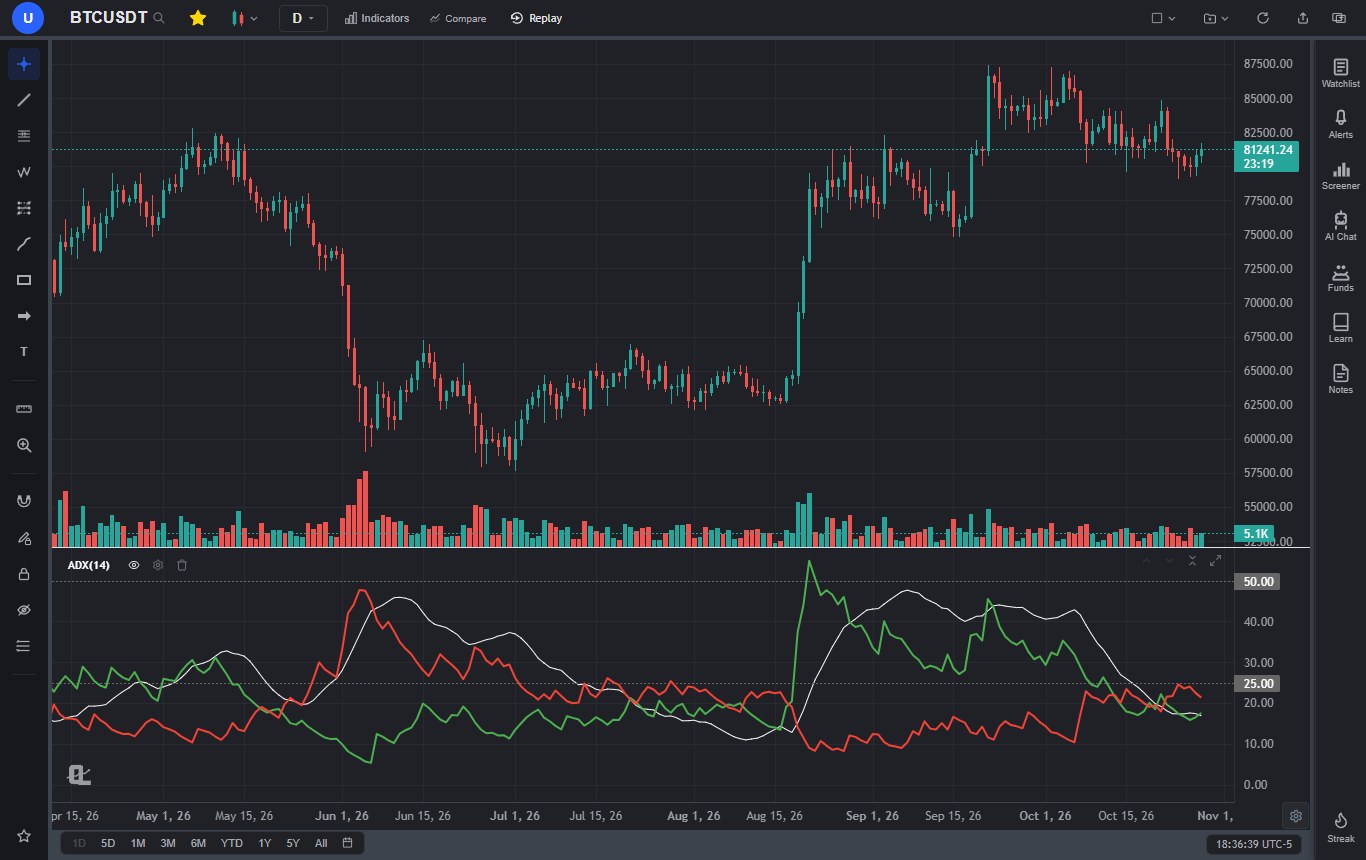
The Bitcoin chart shows both sides of the crossover story, and it's a bit humbling. Look at October 19 to 22: four crosses in four sessions, with ADX between 18 and 21. Pure noise. The textbook answer is to ignore crosses when ADX is below 20, and in late October that filter would have kept you out of trouble.
Now look at August. The cross that started the year's best move came on August 18 with ADX at 12.8. A strict "ADX above 20" rule would have skipped it. ADX didn't get through 20 until August 21, and by the time it crossed 25 on August 22, BTC had already gone from $64,681 to $77,054, about 19%.
So the honest version of the rule is this: a low ADX filter is great at keeping you out of the dozens of crosses that fail, and bad at catching the one that starts a trend. What tends to mark the good one isn't the cross alone. It's a cross from a very low ADX base, a decisive price break, and ADX hooking upward within a few bars. PG did exactly the same thing: its last cross came on October 5 with ADX at 7.3, and ADX was through 20 ten days later.
DI crossovers in practice
- Crosses with ADX below 20 are mostly noise. Expect lots of them in a range.
- Crosses with ADX above 20 to 25 and rising are the ones worth reading as trend signals.
- A cross from a very low ADX base plus a real breakout is the setup that catches new trends early.
- Anchor the stop to the crossover bar's extreme or to real support, not to the lines.
5. ADX as a Trend Filter for Other Strategies
If you only take one idea from this guide, take this one: ADX is most valuable as a switch that decides which of your other strategies is allowed to trade. It's not much of an entry signal on its own. As a regime filter, it's one of the best tools there is.
Every strategy has a market it was built for. Moving average crossovers and breakouts need trends. RSI and Bollinger Band fades need ranges. Most traders lose money not because their strategy is bad, but because they run it in the wrong regime. ADX tells you which regime you're in.
| Strategy | ADX condition worth testing | Why it helps |
|---|---|---|
| Moving average crossover (golden cross, 9/21 EMA) | ADX above 20 at the cross, or rising | Crossovers whipsaw in flat markets. ADX screens out most of the flat-market crosses. |
| Pullback to a moving average | ADX above 25, dominant DI in your direction | A pullback only works if there's a trend to pull back within. |
| Range breakout | ADX below 20 before the break, then turning up | A breakout from a low-ADX base has room to expand. One from ADX 45 is usually late. |
| RSI or Bollinger mean reversion | ADX below 20 | Fading "overbought" in a strong trend is how mean-reversion accounts get hurt. |
| Trailing-stop trend following (Supertrend, Parabolic SAR) | Take flips only with ADX above 20 | Both tools flip constantly in sideways markets. ADX cuts the flip count. |
The moving average case is the one I'd start with, because it's where the filter earns its keep most obviously. Every crossover strategy has a whipsaw problem, and the golden cross and death cross guide spends a whole section on it. "Only take the cross when ADX is above 20" is a one-line fix worth testing. If you're still choosing which average to cross, the SMA vs EMA guide covers the trade-off.
Mean reversion is the mirror image. The RSI, MACD and Bollinger Bands guide explains the oscillator signals, and every one of them works better when ADX confirms there's no strong trend to fight. A Bollinger squeeze, covered in the Bollinger Bands strategy guide, almost always shows up with a low ADX too; the two together are a decent "coiled spring" read.
One caution: a filter changes the number of trades and the mix of winners and losers, so it can make results better or worse. Don't assume. Test the strategy with and without the ADX condition on your market before trusting either. The how to backtest a trading strategy guide walks through doing it properly.
6. ADX in Ranges vs Trends
Once you've watched ADX on enough charts, you start to see that it behaves in a few recognizable ways. None of them is a guarantee, but they come up often enough to be worth knowing.
In a range: ADX sinks and the DI lines braid
When price is stuck between support and resistance, ADX drifts lower and the two DI lines wrap around each other. PG's ADX reading of 5.3 on August 26, 2026 is about as low as it gets on a daily chart. This is the market to use horizontal levels in, and the support and resistance guide is the better tool than any trend indicator for it.
At the transition: the hook from a low base
Very low ADX readings tend to come before the next trend, not after it, because quiet markets don't stay quiet forever. The pattern to watch is a low base (often under 15), a price break out of the range, the DI lines separating, and ADX hooking upward. Both PG in October and Bitcoin in August followed that script.
In a trend: ADX rises, peaks, and turns down early
During a healthy trend ADX climbs. It often peaks near the most emotional part of the move and then turns down while price is still going. That turn doesn't mean the trend has reversed. It means the move is no longer accelerating. Bitcoin's ADX fell from 42.9 on October 6 to 16.9 on October 28, but price only slipped from $85,540 to $81,242, about 5%. The trend didn't flip. It just stopped.
The lag you have to accept
Double smoothing makes ADX late, and you should know how late before you rely on it. On PG, ADX crossed 25 on October 19 with the stock at $157.69. The move had really started on October 5 at $145.94, so the confirmation came about 8% into it. On Bitcoin the confirmation came roughly 19% in. That's the price of a filter that ignores noise. It's also why I never use an ADX cross above 25 as an entry trigger by itself.
PG's spring gave one more lesson. ADX peaked at 35.9 on March 2, three sessions after the stock's high of $167.25 on February 27. Then the decline pushed ADX back through 25 on March 23 with -DI in control. A falling market is a trend too, and ADX counts it the same way.
7. Best ADX Settings for Day and Swing Trading
I'll say it plainly: there is no best ADX setting. Every change is a trade between speed and noise. A shorter period reacts sooner and gives more false signals. A longer one is calmer and later. The 14-period default has survived nearly fifty years because it's a reasonable middle, and because most published thresholds assume it.
| Style | Typical chart | Period to start with | Notes and trade-offs |
|---|---|---|---|
| Scalping | 1 to 5 minute | 14 (some use 7 to 10) | Short periods make ADX jumpy. Lean on volume and VWAP as well; ADX alone is too slow at this speed. |
| Day trading | 5 to 15 minute | 14 | 14 bars on a 5-minute chart is only 70 minutes, but the double smoothing stretches its memory to a couple of hours. |
| Swing trading | 4-hour or daily | 14 | The standard. The 20 and 25 thresholds were built around it. |
| Position trading | Weekly | 14 | Few signals, each one meaningful. Use it to decide whether a market is worth swing trading at all. |
Three things to keep in mind when you change the period:
- The thresholds move with it. A 7-period ADX swings higher and lower than a 14-period one, so 25 means something different. If you shorten the period, look at a few months of your own market and see where trending and ranging stretches actually sit before trusting the old numbers.
- Intraday ADX gets a jolt at the open. True Range and directional movement are measured against the previous bar, so on a stock's 5-minute chart the overnight gap lands in the first bar of the session. Expect ADX and the DI lines to react to that, and don't read the first few bars of the day too literally.
- One period or two. Some platforms let you set the DI length and the ADX smoothing separately. ChartingLens uses one Period for both, which is how Wilder defined the system.
If you day trade, the best indicators for day trading guide covers what usually sits next to ADX on an intraday chart. Swing traders should look at the swing trading strategies guide, where several of the five setups get noticeably better with an ADX filter on top.
8. Common ADX Mistakes
Treating a high ADX as bullish
The most common one, by a mile. ADX at 45 means "strong trend." It says nothing about which way. Check the DI lines every time. EUR/USD in October 2026 had one of the highest ADX readings on any major chart while it fell.
Trading every DI crossover
In a range, the DI lines cross constantly. PG managed 21 crosses in three months without going anywhere. Crossovers need an ADX that's rising, a real price break, or both.
Treating 25 as a magic line
An ADX at 24.8 is not a "no trend" market and 25.1 is not a trend. The bands are a guide, not a cliff. Slope and context matter more than the second decimal place.
Exiting because ADX turned down
A falling ADX in a trend means the move is slowing, not reversing. Use price, a trailing stop or the DI lines to exit. Using ADX's turn alone will get you out of a lot of trends that keep going after a pause.
Expecting it to be early
It isn't, and it can't be. Double smoothing is the point. Use ADX to choose the strategy, and something faster (price structure, a moving average, a breakout level) to time the entry.
Using it without a stop or a size
ADX tells you about the market, not about your risk. Every trade still needs a stop at a real level and a position sized to it. The trading risk management guide and the free position size calculator cover that part.
9. ADX vs Moving Averages, Supertrend, Parabolic SAR and Aroon
ADX is a strength gauge. Most other trend tools are direction tools. That's why it combines so well with them, and why comparing it head to head with, say, Supertrend is a bit like comparing a speedometer with a compass.
| Tool | What it tells you | Direction | Strength | Best job |
|---|---|---|---|---|
| ADX / DMI | How strong the trend is (ADX) and which side leads (+DI/-DI) | Yes, via DI | Yes | Regime filter |
| Moving averages | Average price, slope, crossovers | Yes | Indirectly, through slope and spacing | Trend direction and dynamic support |
| Supertrend | An ATR-based line that flips above or below price | Yes | No | Trend state and trailing stop |
| Parabolic SAR | Accelerating stop dots (another Wilder tool) | Yes | No | Trailing exits in strong moves |
| Aroon | How recently price made a new high or low | Yes | Partly | Spotting fresh trends early |
| Vortex | Two lines built from true range, read like DI crosses | Yes | Weakly | An alternative to DI crossovers |
| Ichimoku | Cloud, baseline and momentum in one system | Yes | Partly, through cloud thickness | A complete trend framework |
All of these are built into ChartingLens, so it's easy to try combinations. My preference is to pair ADX with exactly one direction tool rather than stacking five. A 50-period moving average plus ADX is a complete, readable trend system: the average gives direction, ADX says whether it's worth acting on. Supertrend plus ADX works the same way with a built-in trailing stop.
If you like the idea of a smoothed, trend-first view, two other guides are worth reading next. The Ichimoku Cloud guide covers a full system that answers direction, momentum and support at once. The Heikin Ashi guide covers a chart type that smooths the candles themselves, which pairs well with ADX on swing timeframes.
10. How to Add and Configure ADX in ChartingLens
ADX is one of the classics in the ChartingLens indicator library, and it works on every plan, Free included. Adding it takes under a minute.
Add ADX in five steps
- Open a chart. Type the symbol you want (a stock, ETF, crypto pair or forex pair) and pick the timeframe.
- Click Indicators in the top toolbar and search for ADX. It's listed as ADX, Average Directional Index, under Trend.
- Set the Period and Pane. Period is 14 by default and accepts 2 to 100. Pane is "New pane," or you can put ADX in the same pane as another oscillator already on the chart.
- Pick the line colors for ADX, +DI and -DI (white, green and red by default), set line width and style if you like, then click Add Indicator.
- Adjust it later from the gear on the ADX(14) row of the pane legend: the Inputs tab holds the period, and the Style tab holds colors, width and an opacity slider.
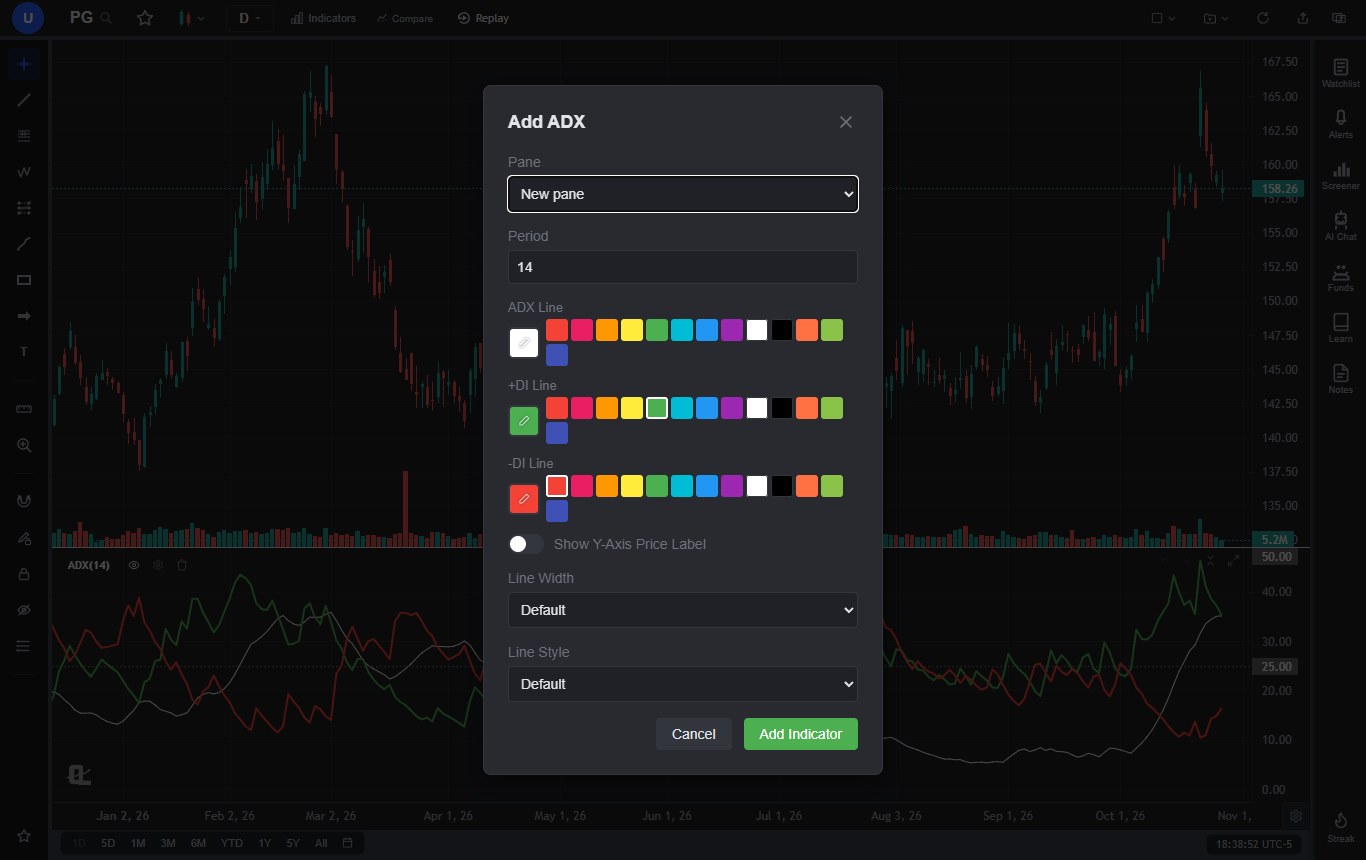
Once it's on the chart, hover anywhere and the legend row shows ADX, +DI and -DI for that bar. The dashed lines at 25 and 50 are drawn automatically. The Free plan allows three indicators per chart, which is enough for ADX plus a moving average and one more tool. Premium removes that cap.
Beyond the indicator itself
- ADX alerts (Premium). The alert dialog has four ADX conditions: ADX Above Value, ADX Below Value, Bullish Cross and Bearish Cross. The cross alerts fire on +DI versus -DI, and only while ADX is above 20, so they skip the low-ADX noise described above. Premium alerts are checked on ChartingLens servers every 5 minutes, so they fire with the site closed. Free plans get price alerts. Details are on the price alerts page.
- Screening for DI crosses. The Stock Screener's Technical Indicators section has an ADX filter for +DI crossing above -DI (or the reverse), including "just crossed" versions, on the daily, weekly or monthly timeframe. It works on Free, which shows the top 10 matches per scan.
- Testing an ADX filter. Describe the rule in plain English, for example "buy when the 20 EMA crosses above the 50 EMA while ADX(14) is above 20, sell on the opposite cross," and the strategy builder turns it into a backtest with a trade log, drawdown and a Monte Carlo stress test. Custom strategy backtests are Premium; the preset strategies under Quick Actions run on Free for one AI credit each.
- Practice. Bar Replay (Premium) lets you replay a chart one bar at a time with ADX on, which is the fastest way I know to get a feel for how late the indicator really is. The how to practice trading guide covers a routine for it.
ChartingLens is a well-established platform with a large active user base, advanced features, and an institutional-grade strategy builder and backtesting engine. The large built-in indicator library covers everything in this guide (ADX, moving averages, Supertrend, Parabolic SAR, Aroon, Vortex and Ichimoku) alongside comprehensive multi-asset market coverage: US and international stocks, ETFs, crypto, forex, metals and index CFDs, all chartable on the Free plan. It's broker-agnostic, so it works with any brokerage and there's no platform lock-in; you analyze here and place orders wherever you already trade.
It's also actively used day to day by a large trader community of day, swing and crypto traders, and that community feedback shapes the roadmap. The per-line style controls you see in the ADX dialog started as a request from a subscriber who wanted that level of customization. Add production-grade reliability at scale, a mature AI-first feature ecosystem (the AI assistant can add ADX, read the current values and explain what they mean for the chart in front of you) and extensive documentation and learning resources, including the how to use ChartingLens guide and free Learn courses, and it's a complete place to work through everything in this article. Plans and limits are on the pricing page.
11. The Honest Take
ADX is not an indicator that will find trades for you. It's late, it's direction-blind, and its crossover signals are noisy exactly when you'd most like them not to be. If you came here hoping for a magic ADX number, I don't have one.
What it does better than almost anything else is answer the question that sits above every setup: is this a trending market or not? Get that right and most strategies improve, because you stop running trend setups in chop and fading moves that have real strength behind them. Put a 14-period ADX under your chart, read the slope before the level, check the DI lines for direction, and let it decide which playbook you open. Then test that decision on your own market before you trust it with money.
Chart ADX Free on ChartingLens
ADX, +DI and -DI on any stock, crypto or forex chart, with the 25 and 50 guide lines drawn for you, plus a large built-in indicator library to pair it with. Free to start, works with any broker.
Start Charting Free →