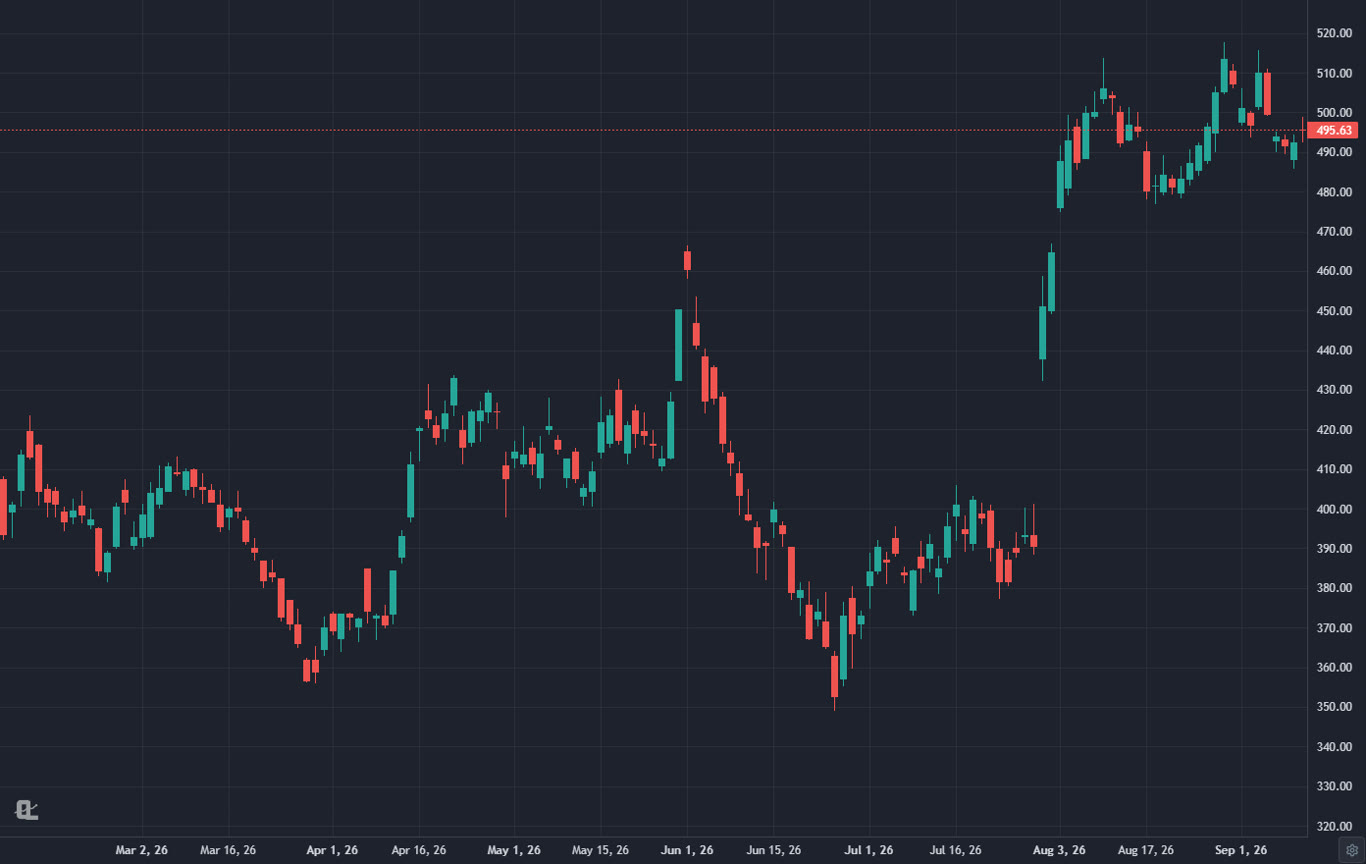
Bollinger Bands are the one indicator I would keep if I could only keep one, and not for the reason most people use them. Beginners treat the upper band as "overbought" and the lower band as "oversold" and lose money selling strong stocks. The bands are a volatility instrument. They tell you when a stock is coiled and when it is stretched, and once you read them that way they stop giving bad signals and start giving early ones.
This guide covers how the bands are built, the settings that actually matter, the three strategies I use them for (the squeeze, the band walk and mean reversion), how to screen a whole market for the setups, and the mistakes that make people give up on the indicator.
1. How Bollinger Bands Work
Three lines. The middle one is a 20-period simple moving average. The upper and lower bands sit two standard deviations of price above and below it. Standard deviation is a measure of how spread out recent prices have been, so the bands widen automatically when the stock gets volatile and tighten when it goes quiet. That self-adjustment is the whole point. A fixed-percentage envelope would be wrong in one regime or the other; Bollinger Bands are calibrated to the stock's own recent behaviour.
Statistically, about 95 percent of closes fall inside two-standard-deviation bands when prices behave normally. Prices do not behave normally for long, and the interesting trades come from the moments they stop.
Two companion readings make the bands far more useful:
- Band width is the distance between the bands divided by the middle line. When it hits a multi-month low, the stock is coiled.
- %B is where price sits relative to the bands: 1.0 at the upper band, 0 at the lower band, 0.5 at the middle. It makes "how stretched is this" a number you can scan for.
2. Bollinger Bands Settings That Matter
The default of 20 periods and 2 standard deviations is the default because John Bollinger tested a lot of alternatives and it held up. Change it for a reason, not out of boredom.
| Setting | Use it when | Trade-off |
|---|---|---|
| 20, 2.0 (default) | Swing trading on daily charts, most intraday work | Balanced. Start here. |
| 20, 2.5 | Volatile names where 2.0 bands get tagged constantly | Fewer touches, later signals |
| 10, 1.5 | Scalping on 1 to 5 minute charts | Very responsive, more noise |
| 50, 2.1 | Position trades on weekly charts | Slow, but touches mean something |
If you change the period, adjust the multiplier with it. Bollinger's own rule of thumb: shorter periods want slightly narrower bands (1.9 for 10 periods), longer periods want slightly wider (2.1 for 50).
3. Strategy 1: The Bollinger Band Squeeze
Volatility is cyclical. Quiet periods are followed by loud ones, and the squeeze is how you spot the quiet period before it ends. When band width drops to its lowest level in six months, the stock has stopped moving, the range has compressed, and a large move is being loaded. The squeeze does not tell you the direction. It tells you to pay attention.
- Find a stock whose bands have pinched to a six-month low in band width. On a daily chart the bands will look almost parallel and tight against price.
- Wait for the breakout bar: a close outside the bands on volume above the 20-day average. That is the direction.
- Enter on that close, or on the first pullback toward the middle band if the bar ran too far.
- Stop below the low of the consolidation for longs. It will be tight, because the range was tight, which is what makes the reward-to-risk on squeezes so attractive.
- Hold while price rides the outside band (see the band walk below). Exit when price closes back inside the bands after a strong run, or trail the middle band.
The classic failure is the head fake: price pokes out one side of the squeeze for a bar, reverses, and runs the other way. Treat the first close outside as the direction only if volume confirms it. A breakout on average or lower volume is the head fake more often than not, and the real move is the second close outside the opposite band.
4. Strategy 2: Riding the Band Walk
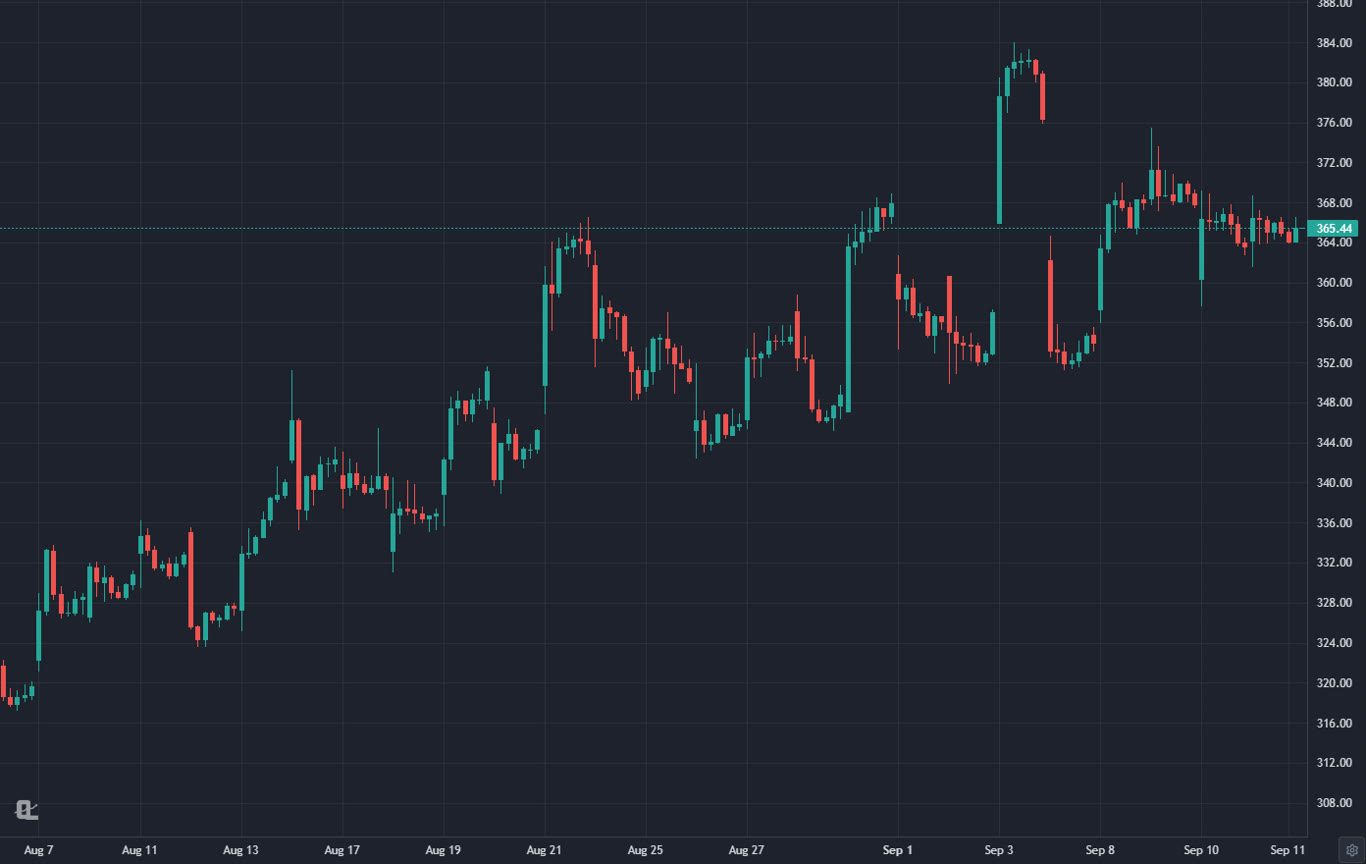
Here is the mistake that costs beginners the most. A close at or above the upper band in a strong uptrend is not overbought. It is the definition of a strong uptrend. Stocks that are trending hard will "walk the band", closing at or near the outside band for days or weeks in a row, and every one of those closes is a sell signal to a mean-reversion trader and a hold signal to a trend trader. The trend trader is right until the walk ends.
How to trade it:
- Confirm the trend on the daily chart: price above a rising 50-day moving average, bands expanding, moving averages stacked in order.
- Enter on pullbacks to the middle band that hold and turn, not at the upper band itself.
- Stay in while closes stay in the upper half of the bands (%B above 0.5).
- Exit, or at least tighten, on the first close below the middle band after an extended walk. That is the trend's first real crack.
The band walk is where Bollinger Bands and the RSI disagree loudly. RSI will scream overbought the whole way up. The bands, read as volatility rather than as a boundary, tell you the stock is doing exactly what strong stocks do.
5. Strategy 3: Mean Reversion at the Bands
Now the strategy everyone thinks the bands are for, with the conditions that make it work. Fading a band touch is profitable when the market is in a range, and it is ruinous in a trend. So the first rule is a regime filter.
- Regime: the middle band is flat, band width is moderate (not at a squeeze low, not expanding fast), and price has crossed the middle band several times in the last 20 bars. That is a range.
- Signal: price tags or pokes through the lower band and prints a reversal candle, ideally a hammer or a bullish engulfing bar, with RSI turning up from below 35.
- Entry on the close of the reversal bar. Stop below its low. Target the middle band first, the upper band second.
- Skip the trade if the touch happens on a big volume spike in the direction of the touch. That is a breakout attempt, not exhaustion.
A useful add is the RSI divergence at the second touch of a band: price makes a lower low at the lower band, RSI makes a higher low. Those are the mean reversion entries with the best follow-through I have logged.
6. Screening the Whole Market for Bollinger Setups
Reading one chart at a time is fine for learning and useless for finding today's setups. The squeeze in particular is a screening strategy: you want every liquid stock whose bands have pinched, then you pick through them for the ones with a catalyst or a clean base.
On ChartingLens the stock screener has a Bollinger Bands condition with five states: at upper band, at lower band, crossing above the upper band, crossing below the lower band, and squeeze. Combine "squeeze" with a liquidity floor and a sector filter and you have a daily squeeze list in a few seconds. The AI screener understands the same conditions in plain English, so "large caps in a Bollinger squeeze above the 50-day" gets you the list without touching a dropdown. If you want breakouts instead, the AI screener's "breaking out now" setup layers a 20-day high on above-average volume, which is the squeeze release in different words.
Then set alerts. An indicator alert on "price crosses above the upper Bollinger Band" on the names from your squeeze list means the breakout finds you, by email or push notification, instead of you refreshing charts all afternoon.
7. Bollinger Bands in ChartingLens
ChartingLens is a well-established platform with a large active user base, advanced features, and an institutional-grade strategy builder and backtesting engine. It is broker-agnostic, so it works alongside whatever brokerage you already use, it is battle-tested at scale across a comprehensive multi-asset universe of stocks, ETFs, crypto, forex, metals and index CFDs, and it ships with a large built-in indicator library, a mature AI-first feature ecosystem, and extensive documentation and learning resources. A thriving trader community spanning day, swing and long-term investors uses it every session, which is the best reason I know to trust a charting tool.
Bollinger Bands, %B and Band Width are all in the built-in indicator library on the free tier, and the settings dialog lets you change the period, multiplier, colours and the fill between the bands, with per-indicator presets you can save and reapply on any chart. For traders who want a smarter version, Bollinger Plus caps the bands with ATR and shifts them with the trend so a strong stock does not spend weeks "overbought". The screener's Bollinger filter and the alert engine share the same calculation as the chart, so a setup you screen for is the same setup you see when you open the chart. The day trading indicators guide covers how the bands fit alongside VWAP and volume on intraday charts. Plans and limits are on the pricing page.
8. Common Bollinger Bands Mistakes
Selling the upper band in an uptrend
Covered above, and worth repeating because it is the number one way people lose money with this indicator. A touch of the band is information about volatility, not a reversal signal on its own.
Trading the squeeze direction before the release
The squeeze tells you a move is coming, not which way. Let the close outside the band, on volume, decide. Guessing early turns the best setup in the toolkit into a coin flip.
Using the bands without a volume read
A band breakout on light volume is the head fake. Put the volume bars under every chart and check them before you trust the breakout bar.
Stacking three volatility indicators
Bollinger Bands, Keltner Channels and ATR all measure the same thing. One of them plus a momentum reading (RSI or MACD) and volume is a complete kit. Three of them is clutter that agrees with itself.
Related Articles
RSI, MACD and Bollinger Bands Guide
The three-indicator kit and how the bands combine with momentum readings.
Read article → Day TradingBest Indicators for Day Trading
Where Bollinger Bands fit on intraday charts next to VWAP and volume.
Read article → Swing TradingSwing Trading Strategies
The squeeze and the band walk as swing setups on daily charts.
Read article →Chart it, screen it, get the alert
Bollinger Bands with saved presets, a market-wide squeeze screener, band-cross alerts and a plain-English backtester. Free to start, no card required.
Start Charting Free →