1. What Is a Triangle Chart Pattern?
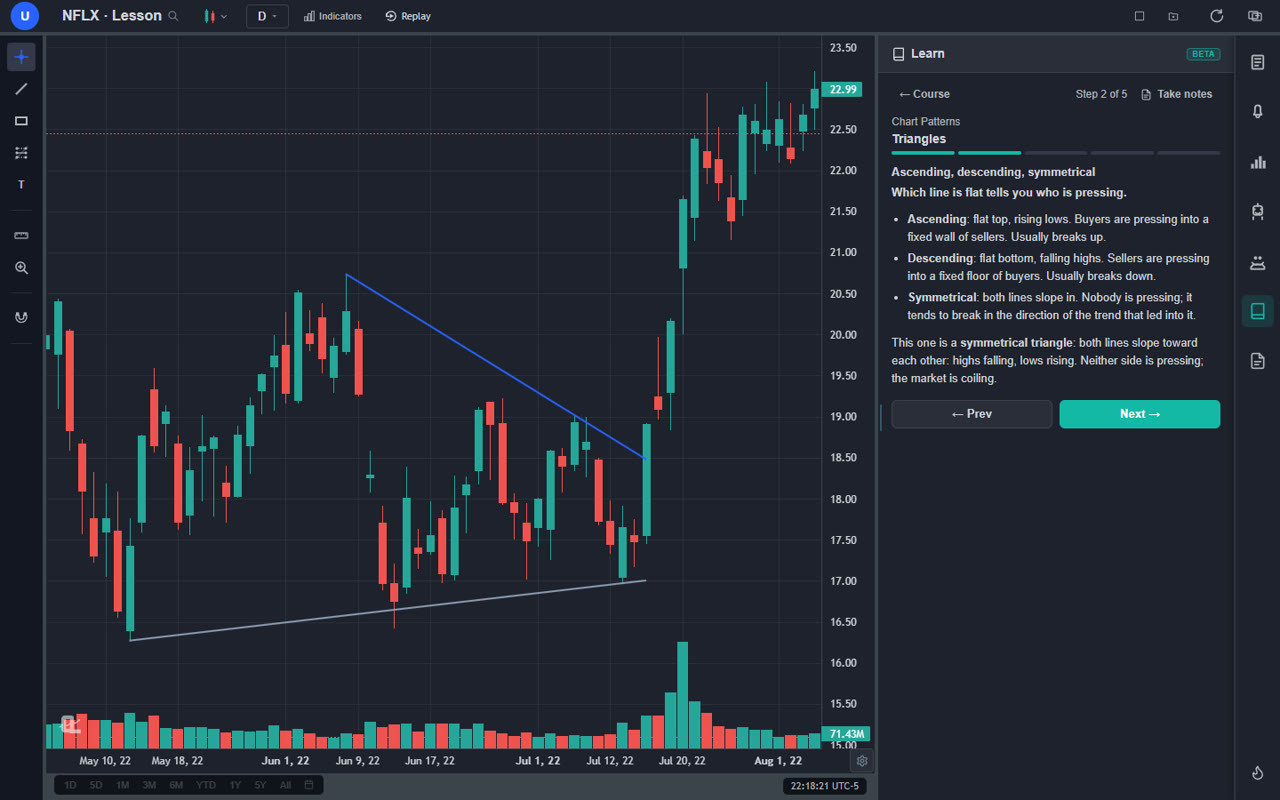
A triangle is a run of swings whose highs can be joined by one straight line and whose lows can be joined by another, and those two lines converge. Every swing travels a little less than the one before. The range is shrinking. Price is being squeezed toward a point, the apex, and it has to pick a direction before it gets there.
That is the whole idea, and it is why triangles are worth waiting for. A market that is coiling is a market storing energy. When it finally resolves, the move tends to be fast because everyone who was waiting on the lines acts at once. And because the pattern is narrow at the breakout, the stop can be tight while the target, based on the widest part of the triangle, is large. That asymmetry is the trade.
Triangles show up on every timeframe and in every liquid market, and they come in three kinds depending on which of the two lines is flat. That single detail tells you who is pressing, which is the most useful thing a chart pattern can tell you before it breaks.
The one-sentence version: a triangle is converging swing structure, it triggers on a close through one of its lines before the apex, and the target is the widest part of the triangle projected from the breakout.
2. The Three Kinds: Which Line Is Flat
Look at the two lines and ask which one is horizontal. The answer tells you the story.
Ascending Triangle
Flat top, rising lows. Sellers are defending one price and holding it every time. Buyers keep stepping in higher on each pullback, so the lows climb toward the ceiling. Buyers are pressing into a fixed wall. Ascending triangles usually break upward, because the side that is pressing is usually the side that wins, but "usually" is not "always" and the trigger rule below applies regardless.
Descending Triangle
Flat bottom, falling highs. Buyers are defending one price, and sellers press lower each time, so the highs step down toward the floor. Sellers are pressing. Descending triangles usually break down. When one forms after a long uptrend it is worth extra attention, because a descending triangle at the top of a trend is often the shape a distribution phase takes.
Symmetrical Triangle
Both lines slope inward: falling highs and rising lows. Neither side is pressing. The market is simply coiling, and the pattern has no directional bias of its own. The usual rule is that a symmetrical triangle breaks in the direction of the trend that led into it, which is why it is often classified as a continuation pattern, but the honest answer is that you do not know until the close.
3. Drawing the Lines: Two Touches Is a Guess, Three Is a Fact
Draw each line through swing points with the trendline tool. Two points make a line, and any two points will. A line that price has returned to and turned at three times is different: each touch means another group of traders acted at that line, and the line gained weight. The more touches on both lines, the more traders are watching the same structure, and the sharper the move when it finally breaks.
A few practical rules that took me longer to learn than they should have:
- Use the swing points, not the wicks in between. A swing high is a bar whose high is higher than the bars on either side of it. Join those. Do not run the line through random intrabar spikes.
- Do not force a line. If you need to bend it to catch a point, it is not a line, and what you are looking at is probably not a triangle.
- Both lines need at least two touches before you call it a triangle, and the pattern gets much better with a third on either side.
- Redraw as new swings print. A line drawn early is a hypothesis. When the next swing lands a little off the line, adjust it. The final lines are the ones that hold on the breakout bar.
This is exactly the skill the trendline and support and resistance basics build, and if drawing lines through swing points still feels arbitrary, that is the place to start.
4. The Apex and Why the Breakout Has to Come Before It
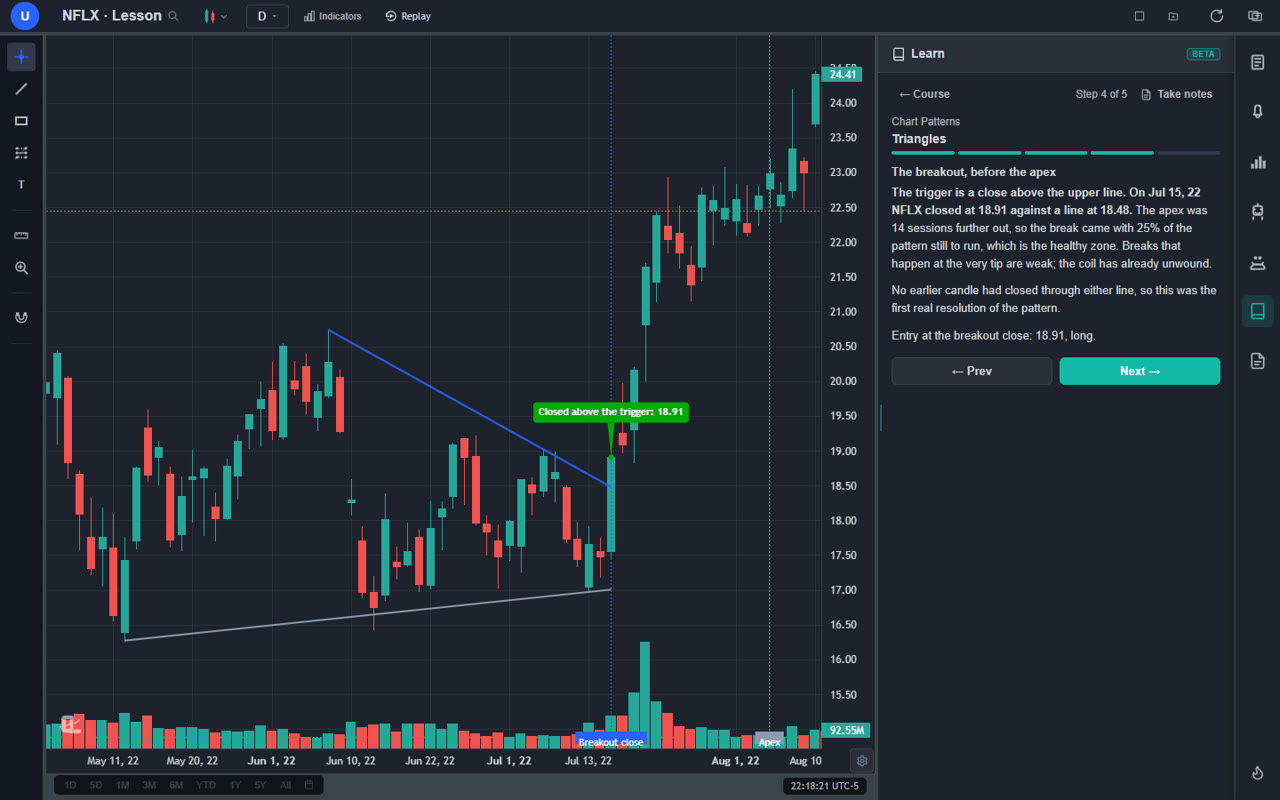
The apex is where the two lines would meet. The pattern has to resolve before price gets there, and in practice the good breakouts come somewhere between halfway and three quarters of the way from the start of the triangle to the apex.
Why. As price approaches the apex the range shrinks to almost nothing, and the lines lose their meaning. A "breakout" from a range of a few ticks is not a breakout. The stored energy has leaked out through dozens of tiny swings. If a triangle drifts all the way into its apex without a decisive close through either line, the right move is to drop it and wait for the next structure. There will be one.
5. How to Trade a Triangle Breakout
The trade uses the same four rules as every pattern in this family. Only the trigger line and the measurement change.
The four rules
- Wait for the close. The trigger is a candle that closes through one of the two lines, before the apex.
- Enter at that close. Long on a close through the upper line, short on a close through the lower line.
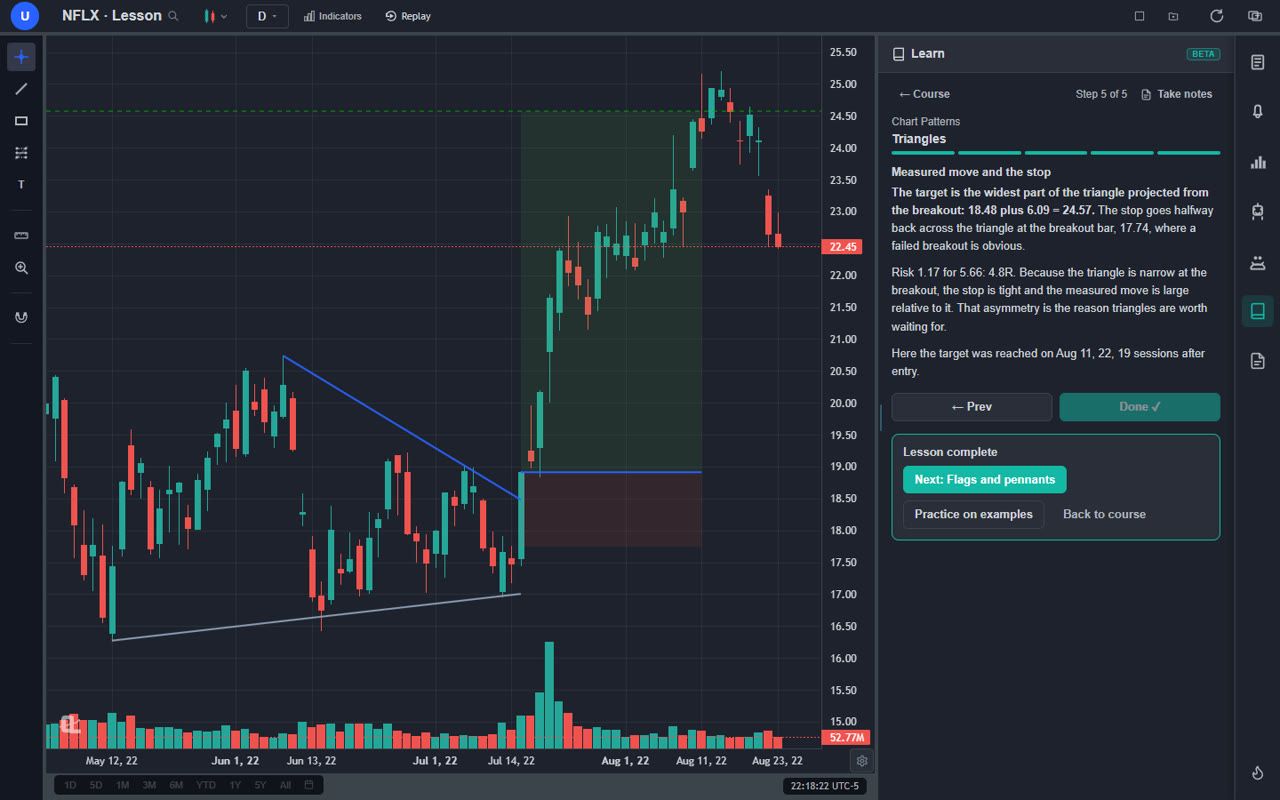
- Stop halfway across the triangle at the breakout bar, where a failed breakout is obvious.
- Target the widest part of the triangle projected from the breakout price. Set it before entry.
Step 1: Wait for a Close Through a Line
Triangles are full of wicks that poke through a line and close back inside. Those are not breakouts; they are the market testing the line and finding it real. The trigger is a close through the line on the timeframe you are trading. If an earlier candle had closed through a line and reversed, that was a fakeout, and the first clean close after it is the real resolution.
Step 2: Enter at the Breakout Close
Entering at the close of the breakout bar means you are in as soon as the pattern is confirmed and still close to the line, which keeps the stop small. Chasing the next morning's gap up is how a four-to-one trade becomes a two-to-one trade.
Step 3: Stop Halfway Across the Triangle
Measure the height of the triangle at the breakout bar (the vertical distance between the two lines on that bar) and put the stop halfway across it. Because the triangle is narrow near the breakout, this is a tight stop in absolute terms. It is also the level at which the breakout has plainly failed: price has not just retested the line, it has gone back into the middle of the pattern.
Step 4: Target the Widest Part of the Triangle
Measure the height of the triangle at its widest point, usually the first swing. Add that distance to the breakout price for an upside break, or subtract it for a downside break. That is the measured move. The pattern was that tall at the start, and the logic is that the energy compressed into the coil is about that size.
Step 5: Manage the Trade
Good triangle breakouts move quickly, because the coil releases all at once. If price closes back inside the triangle within a few bars, the breakout has failed and the halfway stop will handle it. If price runs, let it. Moving the stop to breakeven after the first strong bar is fine; taking partial profit at an obvious prior swing is fine; widening the stop because the retest is uncomfortable is not.
6. Triangle vs Wedge vs Pennant vs Rectangle
Several consolidation shapes are built from converging or parallel lines, and they are easy to confuse. The differences change the target and sometimes the expected direction.
| Pattern | Lines | Comes after | Target |
|---|---|---|---|
| Triangle | Converging; one line may be flat | Any move; forms over weeks on a daily chart | Widest part of the triangle from the breakout |
| Pennant | Converging, small, both sloped | A sharp pole; forms in days | The pole, added to the breakout |
| Wedge | Converging, both lines slope the same way | A trend; usually reverses it | Start of the wedge, or wedge height |
| Rectangle | Parallel and horizontal | Any move; the range does not shrink | Height of the rectangle from the breakout |
The one people mix up most is the pennant. A pennant is a small symmetrical triangle that forms right after a sharp, near-vertical move, and it is measured from the pole rather than from the triangle itself. If there is no pole, it is a triangle. If both lines slope the same direction (both up or both down) you are looking at a wedge, and wedges tend to break against their slope rather than continue.
7. Volume, Fakeouts and Failed Triangles
Volume inside a healthy triangle tends to contract as the range does. Nobody is committing size because nobody knows the direction yet. The breakout bar is where volume should expand, and a close through the line on one of the biggest bars of the month is the best version of the pattern. A breakout on a quiet bar that barely clears the line is the one most likely to be a fakeout. Reading this properly is a skill of its own, and the volume analysis guide covers it in depth.
Fakeouts come in a recognisable form: a candle closes just through a line, the next bar or two close back inside, and then the real move goes the other way. It happens most often in symmetrical triangles, where neither side has an edge, and near the apex, where the lines have lost their meaning. The halfway stop is your protection. It puts you out for a small loss while the failure is still small, and a failed breakout in one direction is frequently the start of the real breakout in the other.
What raises the failure rate: breakouts too close to the apex, breakouts on low volume, ascending triangles that form against a strong higher-timeframe downtrend (and the reverse for descending), and lines that were forced through points they did not fit. What lowers it: three or more touches on each line, a breakout in the first two thirds of the pattern, expanding volume on the breakout bar, and a direction that agrees with the trend above.
8. Common Mistakes
Trading the Wick, Not the Close
Triangles are made of wicks through lines. If you buy every poke above the upper line you will be stopped out repeatedly before the real break. Wait for the close.
Guessing the Direction of a Symmetrical Triangle
A symmetrical triangle has no bias. The prior trend is a hint, not a rule. Positioning before the break because "it should go up" is trading a guess with a wide stop. The close through a line is the only confirmation there is.
Measuring the Target From the Wrong Place
The target is the widest part of the triangle projected from the breakout price, not from the apex and not from the middle of the pattern. Measure the first swing's height, add it to the breakout close. Draw it before you enter.
Holding a Triangle Into the Apex
If price is a few ticks from the apex and still has not broken, the pattern has expired. Trying to trade the last tiny swing as a breakout is trading noise. Let it go.
Stops on the Line
Retests happen. A stop on the line you just broke is a stop at the most predictable place price will visit next. Halfway across the triangle at the breakout bar is where a failure is obvious, and it is usually still a small distance because the triangle is narrow there.
Never Practising
Drawing converging lines on a completed chart is easy. Drawing them while the third swing is still forming is the actual skill, and the only way to build it is repetition on real charts with the outcome hidden. Bar replay and graded practice exist for exactly this.
9. Trading Triangles in ChartingLens
ChartingLens is a well-established charting platform with a large, active user base, and triangles are one of the patterns it is built to handle from the first line to the alert.
Learn It on a Real Chart
The Chart Patterns course in the Learn panel has a five-step Triangles lesson: the converging lines, the three kinds, the touches, the breakout close, the measured move and the stop. Each step draws its example on a real historical chart, and the course's graded practice then hides a triangle on another chart and scores how you draw it and trade it. Free with an account, and the whole course takes around thirty minutes.
Draw With the Trendline Tool, Alert on the Lines
Two trendlines through the swing points and the triangle is on the chart. Because the lines are sloped, a price alert on the line itself is more useful than a fixed-price alert: ChartingLens notifies you when price reaches the line, so you can watch for the close without babysitting the coil.
Let Pattern Recognition Find the Candidates
The AI pattern recognition engine detects ascending, descending and symmetrical triangles across your charts and draws the boundaries. The AI assistant reads the live chart and answers the questions that decide the trade: how many touches on each line, how far to the apex, what the measured move would be. Both are free to use.
Backtest the Rules, Rehearse With Bar Replay
Describe the rules in plain English (enter on a close through the upper line, stop halfway across, target the widest part) and the institutional-grade backtesting engine shows how they performed over years of history, trade by trade. Then use the bar replay simulator to practise drawing the lines as the swings form, without the unfair advantage of seeing the completed pattern.
Putting It All Together
A triangle is a market coiling, and the trade is waiting for it to spring. Draw the lines through the swing points, note which one is flat, count the touches, and wait for a close through a line before the apex. Enter there, stop halfway across the pattern, target the widest part. The pattern is narrow where you enter and wide where you measure, and that is the whole reason triangles are worth the patience.