1. What Is a Pennant Pattern?
A pennant is a continuation pattern with two parts. First a pole: a fast, almost one-directional move where one side of the market is in a hurry. Then a pause: a small, tightening consolidation whose highs and lows converge, like a little symmetrical triangle hanging off the end of the pole. The pattern resolves when price breaks out of the pause in the same direction as the pole, and the expectation is that the pole repeats.
The name comes from the picture. A tall pole, a small triangular flag at the top of it. If the pause were a small parallel channel instead of a triangle you would call it a flag, and it is worth saying up front that flags and pennants trade exactly the same way. The difference is descriptive. What matters is the pole and how shallow the pause is.
Pennants form in every liquid market and on every timeframe. A momentum stock can print one on a 5-minute chart in the first hour of the session; an index can carve one out over a week or two on the daily chart; crypto pennants on the 4-hour chart are constant during trending phases. It is one of the core continuation structures in chart pattern literacy.
The one-sentence version: a pennant is a sharp move followed by a brief, shallow, tightening pause, and it becomes a trade when a candle closes out of the pause in the direction of the move.
2. Anatomy: The Pole, the Pennant, the Breakout
The Pole
The pole is the message. Something brought in buyers (or sellers) faster than the other side could absorb, and price moved several times its normal daily range in a handful of bars with little hesitation. A good pole is easy to see: few or no bars closing against the direction, expanding volume, and a move that stands out from everything around it. Measure its height from the start of the burst to the end, because that number is the target later.
The pole is also what separates a pennant from a plain triangle. No pole, no pennant. A small symmetrical triangle in the middle of a drifting range is just a small triangle, measured from its own height, and it does not carry the pole's promise of continuation.
The Pennant
After the pole, price pauses. In a pennant the pause tightens: the first swing inside it is the biggest, and each swing after that travels less, so the highs and lows converge. Two numbers decide whether the pause qualifies.
- How much of the pole it gives back. A pause that retraces more than half the pole is not a pause; it is a reversal in progress. The best pennants give back a fraction of the move, often a quarter or less.
- How tall the pause is relative to the pole. A pause wider than half the pole is not a pause either. Shallow and narrow is the signature: the winners from the pole are holding and the losers cannot push.
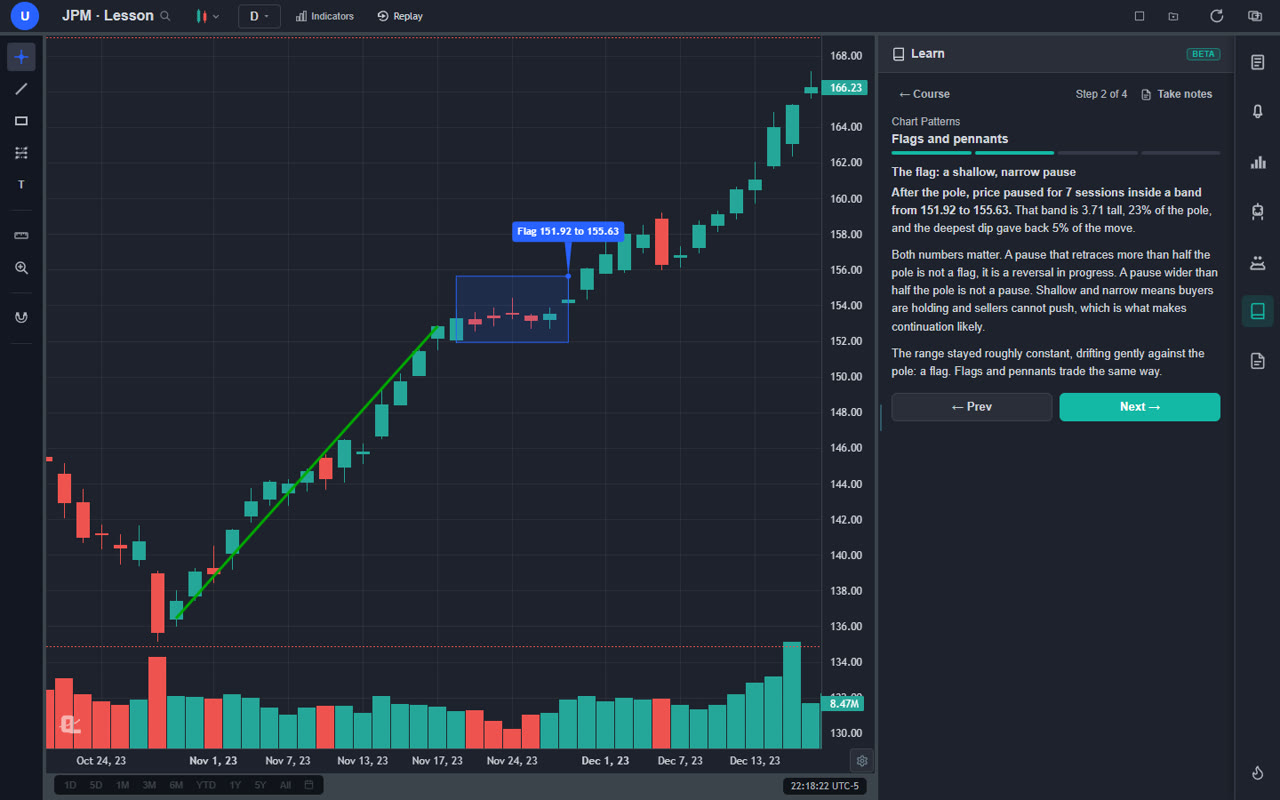
Volume inside the pennant should contract. Falling volume while the range tightens says the selling (in a bullish pennant) is passive profit-taking, not distribution. Rising volume inside the pause is the single most reliable warning that the pattern is not what it looks like.
The Breakout
The pause resolves when a candle closes out of it in the direction of the pole. For a bullish pennant that is a close above the upper converging line; for a bearish pennant, a close below the lower one. Volume should expand on that bar. The move that follows tends to be fast, because the dip buyers who were waiting have to pay up and the traders who faded the pole have to cover.
3. Bullish Pennant vs Bearish Pennant
The two are mirror images and the rules are identical with the directions swapped.
A bullish pennant follows a sharp rally. The pause drifts sideways or slightly down on shrinking volume, and the trigger is a close above the pennant's upper line. Entry long at that close, stop beyond the bottom of the pennant, target the pole added to the breakout.
A bearish pennant follows a sharp decline. The pause drifts sideways or slightly up on shrinking volume, and the trigger is a close below the pennant's lower line. Entry short at that close, stop beyond the top of the pennant, target the pole subtracted from the breakout.
One rule applies to both and it is easy to forget in the moment: a pennant only counts when it breaks the same way the pole went. If a bullish pennant closes out of the bottom, that is not a pennant failing to work. That is the pause turning into a reversal, and the whole idea is off. Do not trade the downside break as a "failed pennant short" unless you have a separate reason for the trade.
4. Pennant vs Flag vs Symmetrical Triangle vs Wedge
| Pattern | Shape of the pause | Needs a pole? | Target |
|---|---|---|---|
| Pennant | Small converging triangle, both lines sloped | Yes | Pole height from the breakout |
| Flag | Small parallel channel, usually drifting against the pole | Yes | Pole height from the breakout |
| Symmetrical triangle | Larger converging structure, forms over weeks | No | Widest part of the triangle from the breakout |
| Wedge | Converging, both lines slope the same way | No | Usually reverses; start of the wedge |
The pennant and the flag are siblings: same pole, same rules, same target. The pennant and the symmetrical triangle are often confused because both have converging lines, but the triangle is a bigger, slower structure with no pole and is measured from its own height. The wedge is the one to be careful with: both of its lines slope the same direction, and a rising wedge after a rally tends to break down, which is the opposite of what a pennant promises.
5. How to Trade a Pennant Step by Step
The four rules
- Wait for the close out of the pennant in the direction of the pole.
- Enter at that close. Not inside the pause, and not on a wick.
- Stop beyond the far edge of the pennant. If price trades back through the whole pause, the continuation has failed.
- Target the pole, again. Pole height added to (or subtracted from) the breakout. Set it before you enter.
Step 1: Confirm the Pole
Before you look at the pause, make sure there is a real pole. A move that is several times the average true range in a few bars, with little hesitation and expanding volume. Mark its start and end and note its height. If you cannot point to a clear pole, stop; whatever you are looking at is not a pennant.
Step 2: Check the Pause
Is the pause shallow (a fraction of the pole given back) and narrow (much less than half the pole tall)? Is volume contracting? Are the highs and lows converging? If yes to all three, draw the two lines through the swing highs and swing lows of the pause.
Step 3: Wait for the Breakout Close
The trigger is a close through the pennant's line in the direction of the pole. Wicks do not count. On a daily chart it is the daily close; on a 5-minute chart, the 5-minute close. Pennants are short, so the wait is usually days, not weeks.
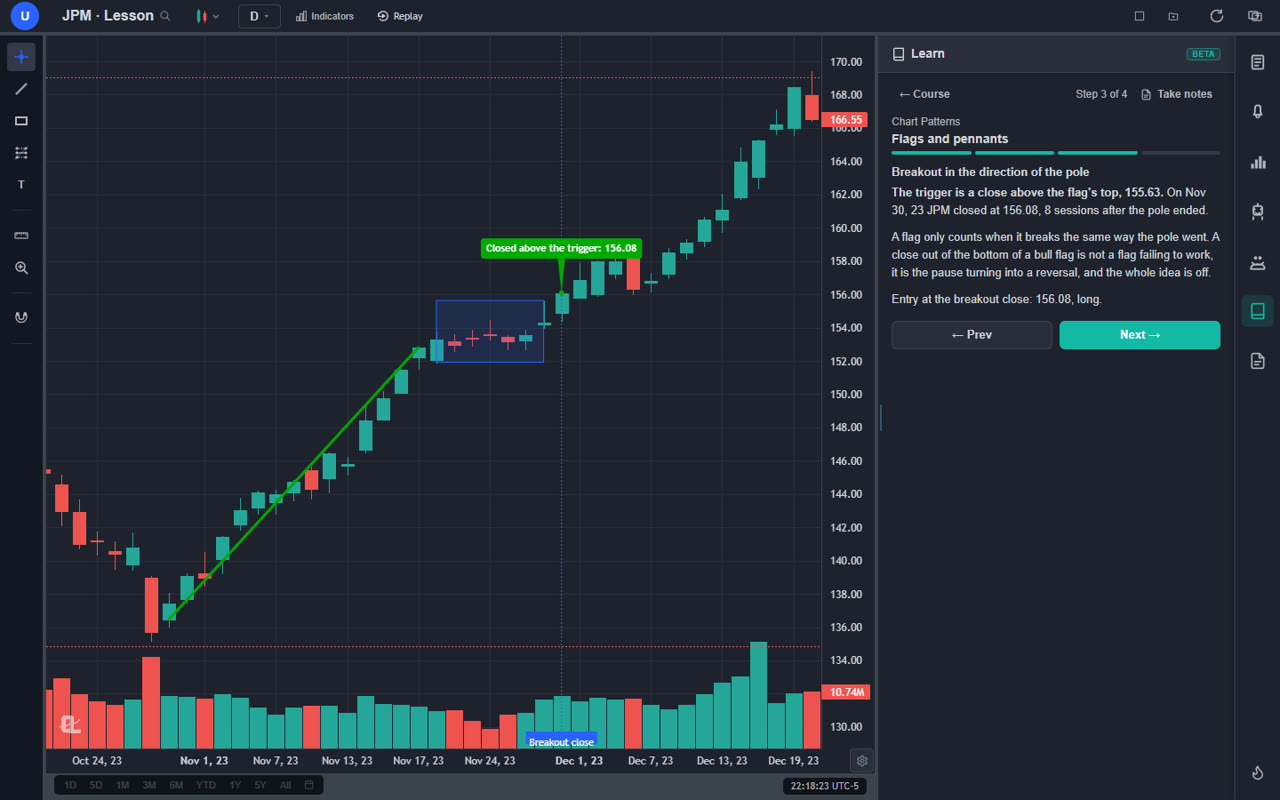
Step 4: Enter at the Close, Stop Beyond the Far Edge
Enter at the breakout close. The stop goes just beyond the far edge of the pennant: below its lowest low for a bullish pennant, above its highest high for a bearish one. The reasoning is simple. If price trades back through the whole pause, the continuation has failed, and there is no point holding to find out how badly. Because the pause is small, this is a tight stop.
Step 5: Target the Pole
Add the height of the pole to the breakout price. That is the measured move, and the logic is that the pole is expected to repeat. A pole of 16 points and a breakout at 156 gives a target of 172. Draw it on the chart before you enter. Many traders take part of the position off at half the measured move and trail the rest; the full pole is a tendency, not a promise.
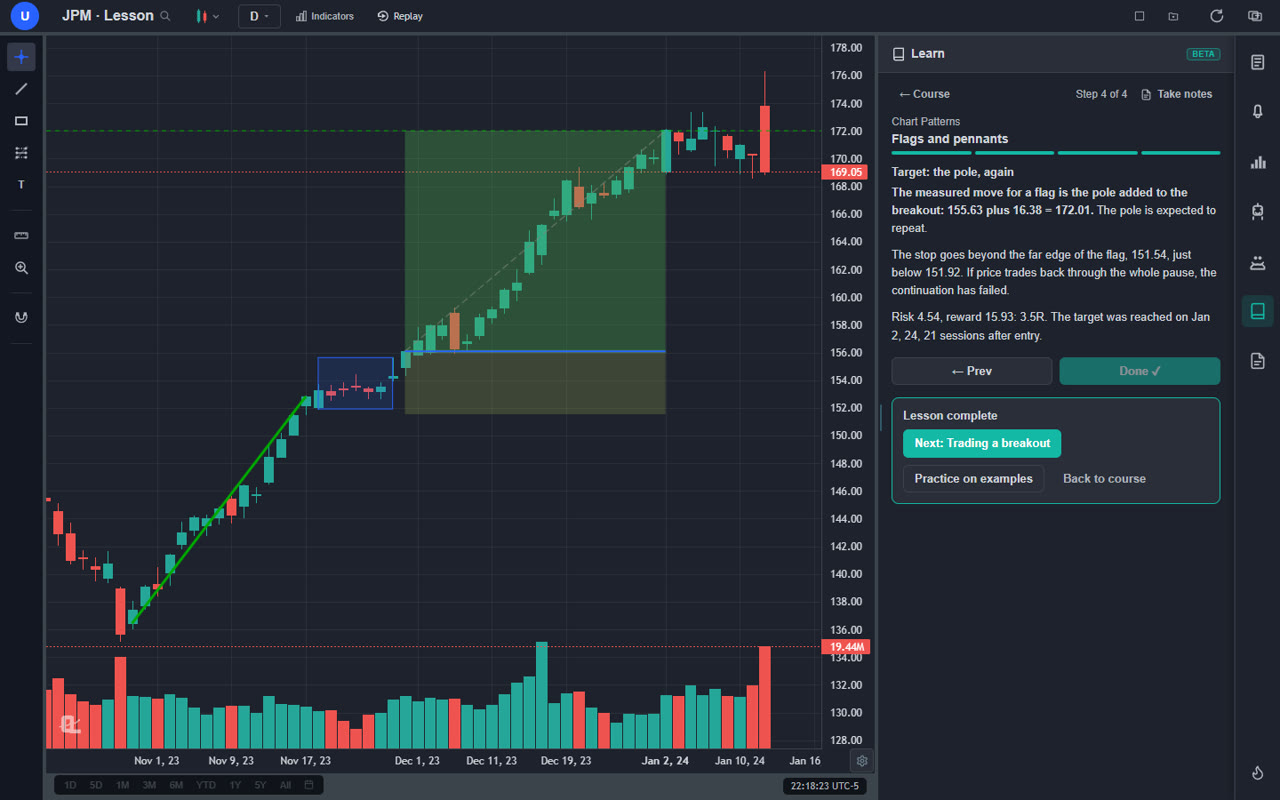
Step 6: Manage It
Pennants are momentum patterns and should work quickly. If price breaks out and then drifts back into the pause for many bars, the momentum has failed to show up and cutting early is usually right, even before the stop is hit. Once price has travelled about half the pole beyond the breakout, moving the stop to breakeven turns it into a free trade. Strong trends print pennant after pennant, and the exit from one is often the setup for the next, which is the rhythm behind a lot of swing trading strategies.
6. Best Timeframes for Pennants
Pennants are fractal, but how you trade them changes with the clock.
Intraday (1 to 15 minutes). The day trader's version. A stock gaps up or breaks out of its opening range on heavy volume (the pole), tightens for five to fifteen minutes on shrinking volume (the pennant), then breaks to new session highs. Frequent, fast, and full of fakeouts. Pennants pair naturally with the opening range breakout, because the opening drive is often the pole.
Hourly and 4-hour. The natural habitat for crypto and forex pennants since those markets trade around the clock. More participation per bar than a 5-minute chart, and they usually resolve in one to three days.
Daily. The most reliable version. A daily pennant contains weeks of participation and is hard to fake. It typically resolves within one to three weeks; a pause that drags on much longer has lost its pennant character and is turning into a triangle or a base.
7. Failed Pennants and Fakeouts
A pennant fails in one of three ways. The pause gets too deep, retracing more than half the pole, and what looked like a pennant becomes a reversal. The pause gets too long, drifting for weeks until the pole's energy has dissipated. Or the breakout is a fakeout: a close through the line, a bar or two of follow-through, then a close back inside the pause and a run the other way.
The tells are usually visible before the failure. Volume rising inside the pause instead of falling. A pause that keeps making lower lows in a bullish pennant. A breakout bar with no volume expansion. A pole that was really a one-bar news spike with nothing behind it. When you see two of those together, skip the trade. There will be another pennant.
When you are in a trade and it fails, the stop beyond the far edge handles it. Do not move it. Do not "give it room." A pennant that has traded back through its whole pause has told you the continuation is off, and the right response is to be flat.
8. Common Mistakes
Buying Inside the Pause
The pause is where the pattern is cheapest and least confirmed. Buying inside it because the breakout "looks imminent" means you are long before the market has agreed, with a stop that every other early buyer shares. Wait for the close.
Calling Any Triangle a Pennant
No pole, no pennant. A small converging triangle in a choppy range is a small triangle. It is measured from its own height, it has no directional promise, and it fails far more often than a real pennant. Find the pole first.
Ignoring Volume
Shape alone is not a pennant. Contracting volume in the pause and expanding volume on the breakout is the pattern; the converging lines are just where you look for it. If the volume signature is backwards, the shape does not matter.
Trading Against the Higher Timeframe
A bullish pennant on a 5-minute chart of a stock making lower lows on the daily is a countertrend scalp with a nice name. Zoom out once before you click.
Measuring the Target From the Wrong Place
The target is the pole added to the breakout price, not to the top of the pole and not to the bottom of the pause. Measure the pole, add it to the breakout close, draw the line before you enter.
9. Trading Pennants in ChartingLens
ChartingLens is a well-established charting platform with a large, active user base, and it is built for exactly this kind of pattern-driven workflow.
Learn It on a Real Chart
The Chart Patterns course in the Learn panel has a four-step Flags and pennants lesson: the pole, the pause, the breakout close and the pole-sized target, each drawn on a real historical chart. Finish the course and graded practice hides a setup on another real chart, replays it bar by bar and scores your entry, stop and outcome against the model answer. Free with an account.
Find Candidates Where Momentum Is
Pennants start with poles, so start where the poles are. The stock screener surfaces stocks that just made a strong move on elevated volume; park the best on a watchlist and wait for the pause. Because ChartingLens covers US and international stocks, crypto, forex and metals, the same playbook runs on whatever you trade.
Let Pattern Recognition Do the First Pass
The AI pattern recognition engine detects pennants, flags, triangles and wedges and draws the boundaries for you. The AI assistant reads the live chart and answers the questions that decide the trade: is volume contracting in the pause, how much of the pole has been given back, where is the nearest resistance above the measured move.
Backtest, Rehearse, Alert
Describe the rules in plain English and the institutional-grade backtesting engine shows how they would have performed over years of history. Rehearse in the bar replay simulator so you are spotting pennants while they form, not after. Then set a price alert on the pennant's upper line so you are told the moment the breakout happens.
Putting It All Together
The pennant compresses momentum trading into one small shape: proof of demand in the pole, proof the demand is being digested in the shallow tightening pause, a trigger in the breakout close, an invalidation beyond the far edge, and a target the size of the pole. Find the pole first, insist on a shallow pause with shrinking volume, wait for the close, and size from the stop. The picture is easy. The discipline is the trade.