1. What Is a Double Top Pattern?
A double top is a bearish reversal pattern. Price rallies into a high, pulls back, rallies again to about the same high, and fails there a second time. Two peaks at roughly one price, a trough between them, and then a break below that trough. The shape looks like the letter M, which is why you will sometimes hear it called an M top.
The double bottom is the same thing flipped: two troughs at about the same price with a bounce in between, then a break above the bounce. A W bottom. Everything in this guide applies to both, with the directions reversed, so I will mostly talk about the top and point out the mirror where it matters.
Double tops are among the most common reversal patterns in any liquid market. They show up on 5-minute charts of a momentum stock, on daily charts of an index, and on weekly charts of Bitcoin. The rules for reading them do not change with the clock, which is why they sit near the front of any serious chart patterns education.
The one-sentence version: a double top is two failed attempts at the same price, and it only becomes a trade when a candle closes below the pullback low between those attempts.
2. Why the Second Attempt Fails
Patterns are worth studying because they encode crowd behaviour that repeats, and the double top encodes a specific kind of failure.
The first peak is normal. A trend runs into sellers at some price and pulls back. Nothing unusual there; every uptrend pulls back. What matters is what happens on the return trip. Buyers who bought the dip push price back up to the same area, and this time the buying has every chance to punch through. It cannot. The people who sold the first peak sell it again, and new sellers join them because the level is now visible to everyone.
That second failure is the message. The buyers who drove the first high had a second chance to take it out and could not. When the pullback low then gives way, the dip buyers from the middle of the pattern are underwater. They become sellers themselves, which is what turns a stalled rally into a reversal.
A double bottom runs the same script with the roles swapped. Sellers drive a low, get a bounce, try again and fail to make a lower low. The buyers who defended the price twice are now in charge of it.
3. Anatomy: Two Peaks, a Pullback, a Neckline
A textbook double top has three parts, and each one carries a rule.
The Two Peaks
The peaks should sit at about the same price. They do not need to match to the cent. A difference of a percent or two on a daily chart is fine; the second peak can even poke slightly above the first before failing, which traps breakout buyers and often makes the eventual break sharper. What you do not want is a second peak that is clearly lower. That is a lower high, and a lower high is trend structure rolling over on its own, not a double top.
Time between the peaks matters too. If the second peak arrives two bars after the first, you are looking at noise. On a daily chart, a few weeks between peaks is typical; on an hourly chart, a few sessions. The second attempt has to be a separate decision by the market, not a wobble.
The Pullback
Between the peaks price pulls back. How deep it goes tells you how much energy the pattern holds. A pullback that gives back a meaningful chunk of the rally into the first peak (roughly 10 to 20 percent of the price on a daily chart of a stock, a lot less on intraday charts) creates a pattern tall enough to be worth trading. A pullback of a few ticks makes a pattern with almost no height, and the measured move will not be worth the risk.
The Neckline
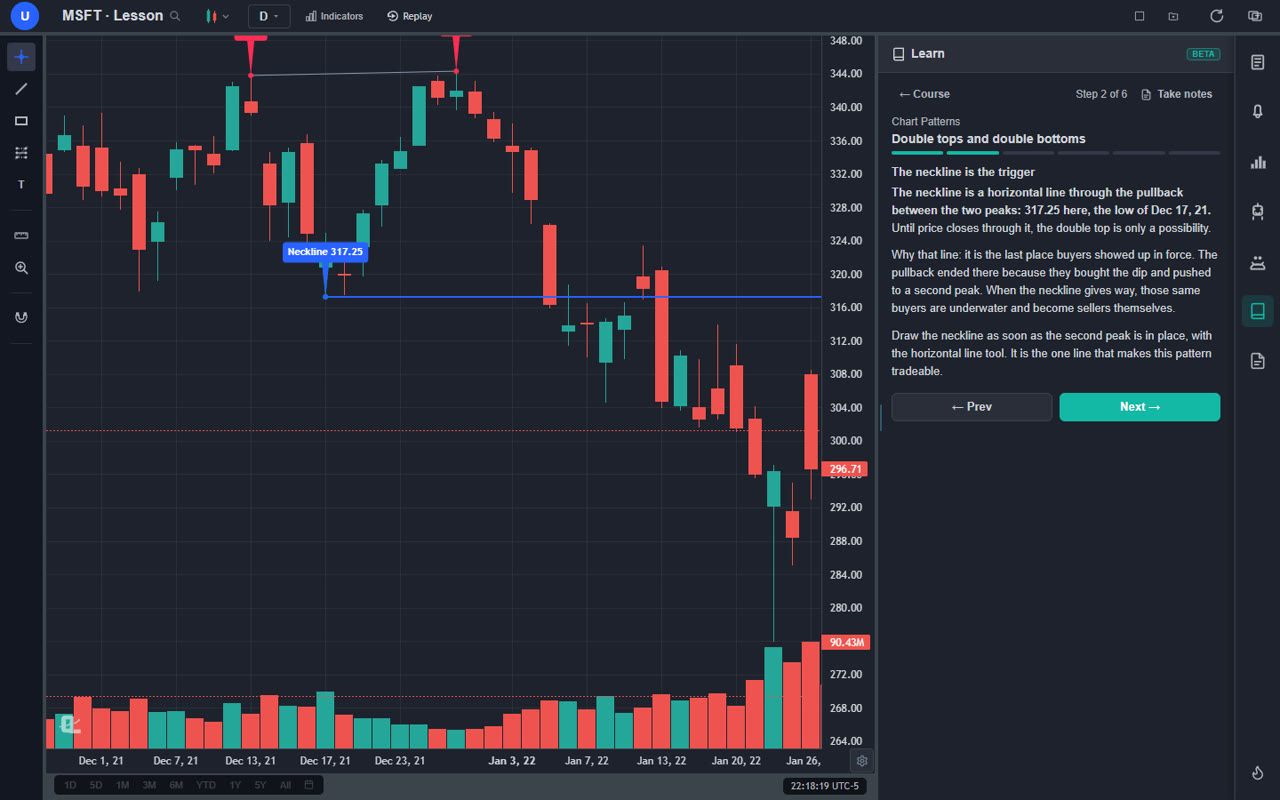
The neckline is a horizontal line through the low of the pullback. It is the one line that makes the pattern tradeable, and it is worth understanding why. That pullback low is the last place buyers showed up in force: they bought the dip there and pushed to a second peak. If price closes below it, those same buyers are losing money on the trade they were most confident about. Draw the neckline the moment the second peak is in place, before the break, so you are not deciding under pressure.
4. The Double Bottom: Same Structure, Upside Down
A double bottom is two troughs at about the same price, a bounce between them, and a neckline through the high of that bounce. The trigger is a close above the neckline. The stop goes back inside the pattern, and the target is the pattern's height projected upward from the neckline.
Double bottoms tend to form after a decline has already worn out the sellers, and they can be quieter than tops. Volume is often light on the second trough because nobody wants to sell down there any more. The breakout above the neckline is where volume should return. If the breakout bar is one of the biggest of the month, that is what you want to see.
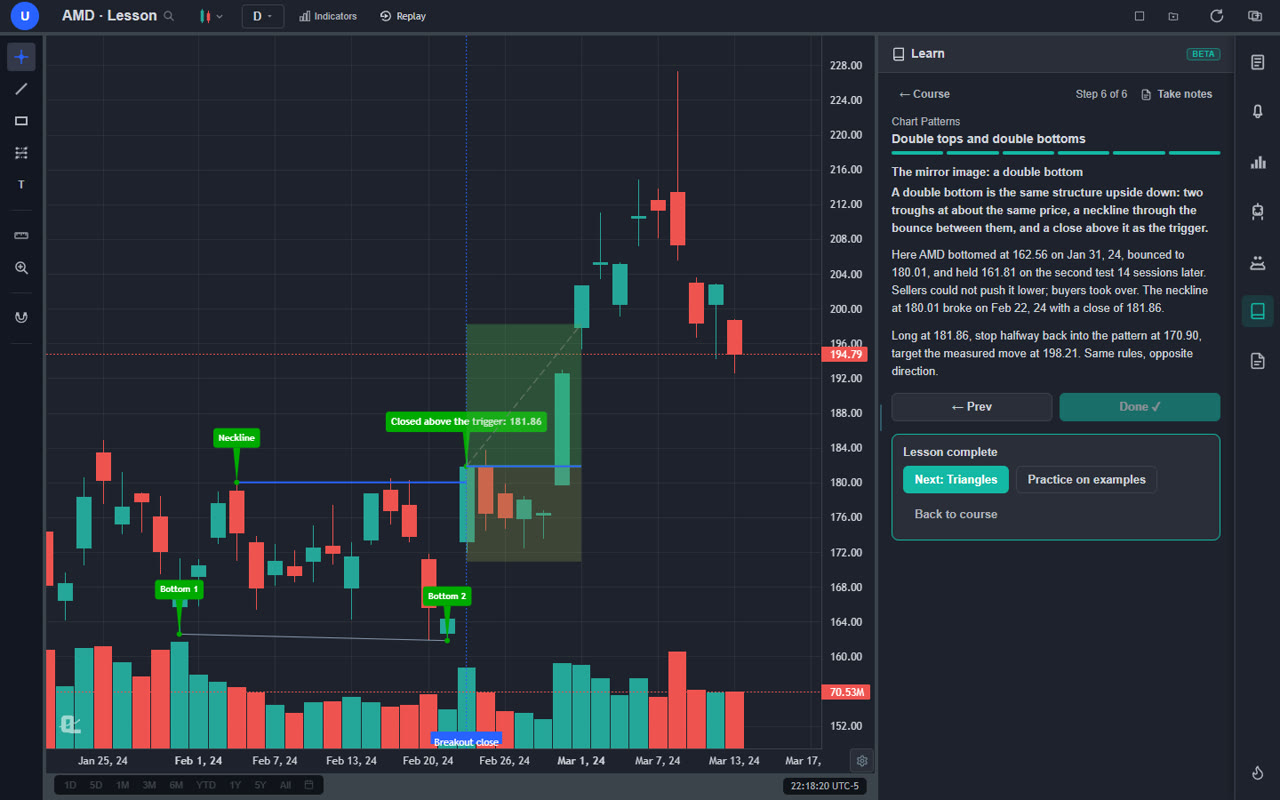
One detail beginners miss: the second bottom is allowed to undercut the first. A slightly lower second low that immediately reverses is a classic trap for breakdown sellers, and those trapped shorts fuel the move through the neckline. What invalidates the pattern is a second low that keeps going, not one that dips a little further and snaps back.
5. How to Trade a Double Top or Double Bottom
The whole trade fits in four rules. The same four rules apply to every pattern in this family, which is the point: once you can trade a double top, a head and shoulders or a triangle is mostly a matter of finding the right trigger line.
The four rules
- Wait for the close. The trigger is a candle that closes through the neckline. A wick through it is not a trigger.
- Enter at that close. Not earlier (that is guessing the second peak holds) and not much later (that is chasing).
- Stop halfway back into the pattern. Not just past the neckline, and not at the peaks.
- Target the measured move. Pattern height projected from the neckline. Set it before you enter.
Step 1: Wait for the Breakout Close
Until a bar closes through the neckline, a double top is only a possibility. Plenty of M shapes never break and simply become a range. Trading the second peak because it "looks like" it is failing is how you end up short into a breakout to new highs. Let the close do the work. On a daily chart that means the daily close; on an hourly chart, the hourly close.
Step 2: Enter at the Close
The breakout close is the entry. It is the first moment the market has confirmed the pattern, and it is usually within a small distance of the neckline, which keeps the stop tight. If you miss it, the retest of the neckline from below is the second chance, but it does not always come.
Step 3: Put the Stop Halfway Back Into the Pattern
This is the rule that separates traders who make money on double tops from traders who get chopped by them. After a break, price often comes back to touch the neckline before leaving for good. A stop placed right on the line gets hit by that ordinary behaviour. A stop at the peaks is so far away that a clean two-to-one trade turns into a coin flip. Halfway between the neckline and the peaks is the point where the breakout has clearly failed, and it is where the stop belongs.
Step 4: Project the Measured Move
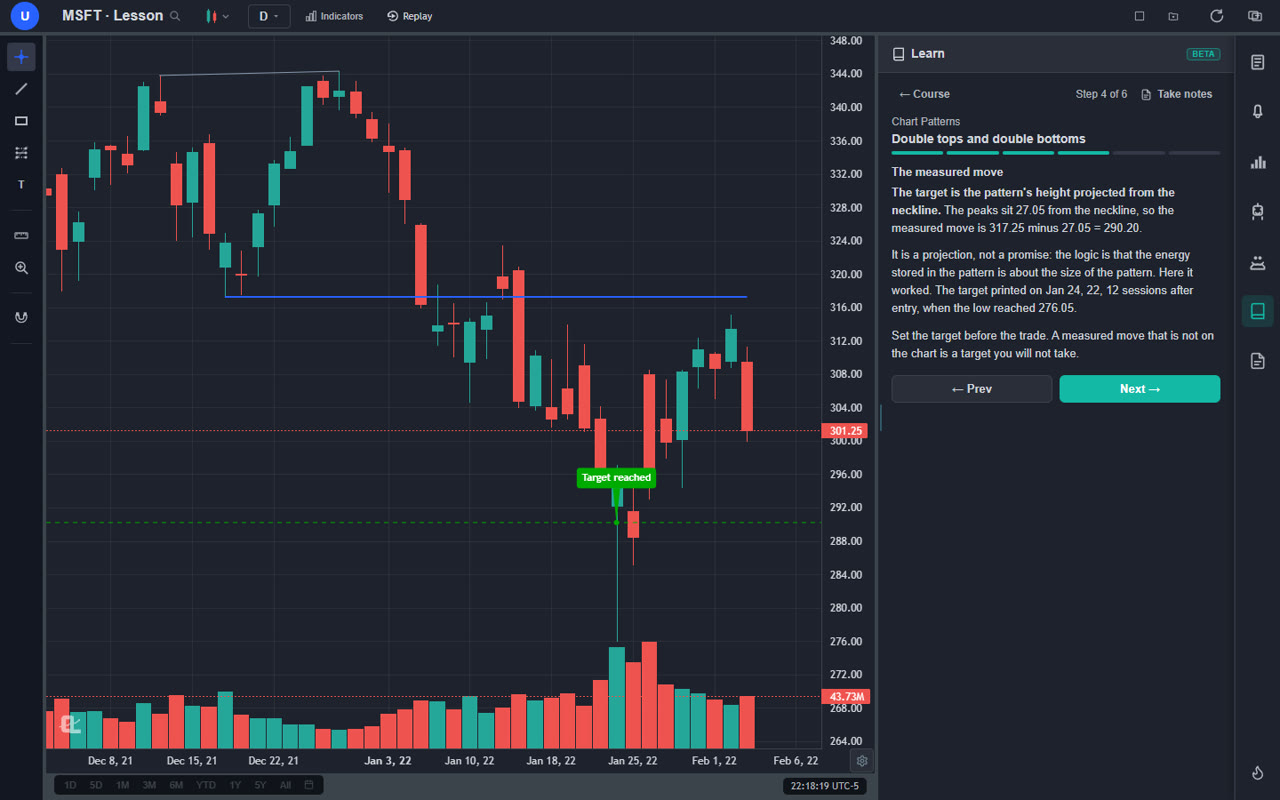
Measure from the peaks down to the neckline. Project that distance below the neckline. That is the target. The logic is that the energy stored in the pattern is about the size of the pattern, and in practice it works often enough to be the default. Set the target on the chart before the trade, because a target that is not drawn is a target you will not take.
Step 5: Manage the Trade
Reversal patterns can take a while to pay. Unlike a bull flag, which should move almost immediately, a double top breakdown often chops around the neckline for a few bars before it goes. That is why the stop sits halfway back rather than on the line. Once price has travelled about half the measured move, moving the stop to breakeven is reasonable. Taking partial profit at the first support level on the way to the target is also reasonable. What is not reasonable is moving the stop wider because the retest is uncomfortable.
6. Double Top vs Head and Shoulders vs Triple Top vs Range
Several reversal shapes look alike from a distance. The differences matter for where you draw the trigger line and how much you can expect from the move.
| Pattern | Shape | Trigger line | What it says |
|---|---|---|---|
| Double top | Two peaks at one price, one pullback | Horizontal neckline through the pullback low | Buyers failed twice at one price |
| Head and shoulders | Three peaks, the middle one highest | Neckline through the two pullback lows, often sloped | The trend made one last higher high and could not hold it |
| Triple top | Three peaks at one price, two pullbacks | Horizontal line through the lower of the two pullback lows | A double top that got one more test; usually a bigger break |
| Trading range | Many touches of the same high and the same low | Range low (or range high) | Nobody is winning; trade the edges, not the middle |
A useful way to think about it: the double top is the simplest member of the family. The head and shoulders adds a higher high in the middle, which makes the failure more dramatic. The triple top is a double top that tested once more. A range is what a double top turns into when the neckline never breaks, and by the fourth touch you should stop calling it a reversal pattern and start trading it as support and resistance.
7. When a Double Top Fails
Every pattern fails sometimes, and the double top fails in two recognisable ways.
The neckline never breaks. Price makes two peaks, pulls back toward the neckline, and bounces. Then it makes a third peak. This is not a failed trade because there was never a trigger; it is a reason to stop treating the chart as a reversal. Two peaks and a hold is a range until proven otherwise.
The break reverses. Price closes below the neckline, you enter, and within a few bars it closes back above the neckline and runs. This is the genuine failed double top, and it is often a strong bullish signal because everyone who sold the break is now trapped. The halfway stop handles it: you are out with a defined loss while the move is still small. Some traders flip long on a close back above the neckline. I would not do that without a second reason, but it is a real setup.
What raises the odds of failure: a breakout close on tiny volume, a neckline break that happens on a news spike and immediately fades, a double top forming against a strong higher-timeframe uptrend, and a second peak that is clearly higher than the first (which is not really a double top at all). What lowers them: a breakout bar with expanding volume, a pullback that is deep enough to give the pattern real height, and a higher-timeframe trend that is already tired.
8. Common Mistakes
Shorting the Second Peak
The second peak is where the pattern is most tempting and least confirmed. Selling there means you are betting the peak holds, with a stop just above it that every breakout buyer is aiming at. Wait for the neckline close. You will miss a few that never come back to the line, and you will avoid a lot of shorts into new highs.
Drawing the Neckline Through the Wrong Low
The neckline goes through the low of the pullback between the two peaks. Not through some earlier swing low, not through the low of the first rally. If there are two small lows inside the pullback, use the lower one. When the line is drawn in the wrong place the stop and the target are both wrong, and the whole trade is built on a mistake.
Stops on the Line
Covered above, but it deserves repeating because it is the most common way to lose on a pattern that then works perfectly. Price retests necklines. Put the stop halfway back, size the position for that distance, and let the retest happen.
Ignoring the Trend Above
A double top on a 15-minute chart of a stock making higher highs on the daily is a countertrend scalp with a reversal pattern's name. It can work, but the odds are worse. Check one timeframe up before you trust the pattern. The basics of reading the higher timeframe take five minutes and save a lot of losses.
Never Practising the Setup
Most people's experience with double tops is a few remembered wins and a lot of forgotten losses. Replaying real charts bar by bar and trading every double top you find, with a stop and a target written down before each one, teaches the pattern faster than a year of live trading and costs nothing. There is a practice guide on this blog that covers how to do it properly.
9. Trading Double Tops and Bottoms in ChartingLens
ChartingLens is a well-established charting platform with a large, active user base, and the double top workflow runs end to end inside it: find the candidate, draw the neckline, test the rules, rehearse the trade, set the alert.
Learn It on a Real Chart First
The Chart Patterns course in the Learn panel has a full lesson on double tops and double bottoms. Every step draws its example on a real historical chart: the peaks, the neckline, the breakout close, the measured move and the stop. When you finish, graded practice hides the pattern on another real chart and scores how you mark it and how you trade it. It is free with an account and takes about half an hour for the whole course.
Draw the Neckline With the Horizontal Line Tool
The neckline is a horizontal line through one price, so the horizontal line tool is the right tool. Draw it as soon as the second peak is in place. Add a horizontal line at the halfway point for the stop and one at the measured-move target, and the whole trade is on the chart before it triggers.
Let Pattern Recognition Do the First Pass
The AI pattern recognition engine scans the chart for double tops, double bottoms, head and shoulders and other classical structures and draws the boundaries for you. Instead of scrolling through fifty charts hunting for M shapes, you review a short list and apply the rules in this guide to the ones that matter. The AI assistant can then read the live chart and answer the specific questions: is the second peak lower than the first, how far is the neckline, what is the measured move.
Backtest the Rules, Then Rehearse With Bar Replay
The plain-English strategy builder and its institutional-grade backtesting engine let you describe the rules (enter on a close below the neckline, stop halfway back, target the pattern height) and see the statistics over years of history. Then the bar replay simulator replays sessions candle by candle so you can practise spotting the second peak while it is still forming, without seeing the completed chart. When you are ready to trade it live, a price alert at the neckline tells you the moment the break happens.
Putting It All Together
The double top is a simple pattern with a precise trade inside it: two failed attempts at one price, a neckline through the pullback, a close through that line as the trigger, a stop halfway back into the pattern and a target the height of the pattern away. Learn to draw the neckline early, respect the close, and size from the halfway stop. Do that on a few dozen real charts and the shape stops being a picture and becomes a plan.