1. What the Pattern Is Actually Telling You
Strip the anatomy language away and the head and shoulders is one thing: a story about an uptrend failing to make a new high, told in three acts.
An uptrend is a sequence of higher highs and higher lows. In the first act, buyers push to a high and take profits. Normal. In the second act they push again, harder, to a higher high, and that high gets sold aggressively enough to drag price back to where the last pullback ended. Also normal, so far. The third act is the tell. Buyers try again and cannot get past the previous high. That failure is the whole pattern. Everything else is just the shape it leaves behind.
This is why the head and shoulders shows up in every textbook and why it keeps working decades after everyone learned it. It is not a magic shape. It is the visual record of demand exhausting itself while supply builds, and no amount of pattern-recognition arbitrage makes that stop happening.
It is also why the pattern is so easy to misuse. Traders learn the shape, then start seeing it in random three-bump sequences inside a range, where nothing is exhausting because nothing was trending in the first place. Context first, shape second. Always in that order.
2. Anatomy: Shoulders, Head, Neckline
The standard topping pattern has four components:
- Left shoulder: a high made inside an established uptrend, followed by a pullback. At this point nothing looks unusual.
- Head: a higher high, followed by a deeper pullback that returns to roughly the same area as the previous low. The rejection here is the first real evidence that sellers are getting organized.
- Right shoulder: a rally that stalls below the head. Lower high. The sequence is broken.
- Neckline: the line connecting the two pullback lows. This is the pattern's trigger, and its most misunderstood component.
Necklines are rarely flat. A downward-sloping neckline usually means sellers are getting more aggressive with each pullback, though the break happens at a lower price and eats into your reward. An upward-sloping neckline gives a higher break level but produces more false breaks. Perfectly horizontal necklines are the cleanest and the rarest.
A common question is how symmetrical the shoulders need to be. Honest answer: less than most people think. Real charts produce lopsided patterns constantly, with a right shoulder half the width of the left, or a shoulder that amounts to a single spiky candle. What matters is the structural relationship (high, higher high, lower high, with the pullbacks between them landing near a shared level), not cosmetic symmetry. If you are rejecting valid setups because the shape is not pretty, you are grading art, not analyzing supply and demand.
The pattern is not complete until the neckline breaks. A left shoulder, head, and right shoulder with no break is a potential pattern, and potential patterns fail all the time. Price can rally from the right shoulder straight through the head and continue the uptrend, and it does that often enough that entering early is a losing habit.
3. The Volume Signature That Separates Real From Fake
If you only add one filter to your pattern trading, make it this one. Volume tells you whether the shape describes genuine distribution or just three random wiggles.
In a textbook topping pattern, volume is heaviest on the left shoulder, lighter on the rally into the head, and noticeably lighter still on the right shoulder rally. The message is simple: each successive push higher draws fewer buyers. Then, on the neckline break, volume expands. That expansion is participation confirming the shift, and its absence is the most useful warning sign available.
What should you do when volume does not cooperate? Downgrade the trade, do not automatically skip it. A neckline break on flat volume is a lower-conviction setup that deserves a smaller position and a shorter leash. A break on volume well above the recent average, with a wide-range candle closing near its low, deserves a full position. Our volume analysis guide covers how to judge relative volume properly instead of eyeballing the bars.
4. The Inverse Head and Shoulders
Flip everything. The inverse pattern forms at the end of a downtrend: a low, a lower low, then a higher low, completing on a close above the neckline. It says sellers could not produce a third leg down.
Two practical differences are worth knowing.
First, bottoms take longer than tops. Tops often form on fear and resolve quickly. Bottoms get built through slow accumulation, so inverse patterns tend to be wider, messier, and more likely to include a few failed pokes above the neckline before the real one. Patience pays more on the bottoming version.
Second, the volume relationship matters more on the upside break. Price can fall under its own weight, but it cannot rise without buyers. An inverse head and shoulders that clears its neckline on unimpressive volume usually stalls right back into the pattern. You want demand expansion on the breakout, ideally with the breakout candle closing in its upper third.
Quick Reference
- Topping pattern: high, higher high, lower high. Break below the neckline. Volume contracts into the right shoulder, expands on the break.
- Inverse pattern: low, lower low, higher low. Break above the neckline. Same volume logic, and the breakout expansion matters more.
- Trigger: the neckline close, not the shape.
- Invalidation: a move back through the right shoulder extreme.
5. Three Ways to Enter the Neckline Break
Every entry method trades fill quality against confirmation. Pick the one that matches your temperament, then stop switching mid-trade.
The Break Entry
Enter on the close of the candle that breaks the neckline. Best average fill, most exposure to false breaks. Use it when volume expands convincingly and the candle closes well beyond the line rather than poking through by a few cents.
The Retest Entry
Wait for price to break, then return and test the neckline from the other side before continuing. This is the highest-quality entry the pattern offers: old support becomes resistance, the stop sits tight above the retest high, and the risk-to-reward improves a lot. The catch is that plenty of patterns never retest. You will miss the fastest, most violent moves, which are also the ones that run furthest. Traders who use this method exclusively should make peace with that.
The Split Entry
Half on the break, half on the retest if it comes. No retest? You are still in with a partial position and can add on the first pullback in the new trend. This is what I would suggest to most swing traders, because it removes the psychological cost of watching a clean setup leave without you.
Whichever entry you use, define it before the break happens. The most expensive version of this trade is deciding to "wait for the retest" only after you have already watched price run 4% without you, then chasing anyway two candles later.
6. Measuring the Target and Placing the Stop
The Measured Move
Measure from the top of the head straight down to the neckline. Project that distance down from the break point. That is the classic target, and it comes from a simple idea: the height of the pattern reflects the size of the disagreement, and the resolution tends to travel a comparable distance.
Use it as a reference, not a promise. A large share of patterns stall well short of the full projection, often at the first significant prior support or a rising moving average. A smaller share blow through it entirely when the pattern marks a genuine trend change. Both outcomes argue for the same tactic: take partial profit at the first structural level, move the stop to break even, and let the rest work toward the measured move behind a trailing stop.
The Stop
Above the right shoulder, with a buffer. That is where the pattern stops making sense, and stops belong at invalidation points rather than at whatever distance feels comfortable. If the resulting risk is too large for your account, the answer is a smaller position, not a closer stop. That is the core argument of our risk management guide, and it matters most on pattern trades, where an arbitrary tight stop gets picked off by the exact retest that would have made the trade work.
The Math Check Before You Click
Distance from entry to stop versus distance from entry to first target. If the first target is not at least 1.5 times your risk, the pattern is not worth trading no matter how clean it looks. A tall head with a nearby right shoulder produces excellent ratios. A shallow head with a distant shoulder produces terrible ones. The shape being valid and the trade being worth taking are two different questions.
| Element | Topping pattern | Inverse pattern |
|---|---|---|
| Prior trend | Uptrend, ideally extended | Downtrend, ideally extended |
| Structure | High, higher high, lower high | Low, lower low, higher low |
| Trigger | Close below neckline | Close above neckline |
| Volume tell | Contracts into right shoulder, expands on break | Contracts into head, expands strongly on break |
| Stop | Above right shoulder | Below right shoulder |
| Typical speed | Faster, sharper resolution | Slower, more false starts |
7. Context: Where the Pattern Earns Its Reputation
The same shape has wildly different value depending on where it forms.
- After an extended, mature trend: this is the pattern's home turf. Months of uptrend, a stretched move away from the 200-day average, then a head and shoulders. Take it seriously.
- At a higher-timeframe level: a head whose peak sits at a prior major high, a big round number, or the top of a monthly range is worth more than one formed in open air. Pair it with the levels from our support and resistance guide.
- Inside a trading range: nearly worthless. Ranges produce head-and-shoulders-looking sequences constantly, because ranges produce highs at similar levels by definition.
- Early in a fresh trend: skip it. The first consolidation in a young trend often looks like a top and almost never is one.
Timeframe matters just as much. A daily or weekly pattern reflects weeks of positioning by people with real capital. A 5-minute pattern reflects the last ninety minutes of algorithmic noise. Both are tradeable, but they deserve different position sizes and very different expectations for follow-through.
8. Why It Fails (and How to Survive That)
Here is the part most guides skip. Even a well-formed head and shoulders fails a meaningful share of the time, and the failure has a recognizable pattern of its own.
The classic sequence: neckline breaks, everyone shorts, price drops for a day or two, then reverses hard, reclaims the neckline, and squeezes straight back above the right shoulder. This happens because a completed pattern is one of the most widely watched triggers in retail trading, which concentrates stop orders in an obvious place just above the right shoulder. Concentrated stops attract price.
Three defenses:
- Treat a neckline reclaim as an exit, not a drawdown. If price closes back above the neckline after breaking down, the thesis is gone regardless of where your stop sits. Take the small loss and stop arguing with the chart.
- Prefer patterns confirmed by broader weakness. A top in a stock while its sector and the index are also rolling over behaves very differently from a lone top in a market grinding to new highs.
- Size for the failure rate you actually observe. If your last twenty pattern trades produced eleven winners, size accordingly and stop treating the twelfth as a certainty. The backtesting guide covers how to gather that data instead of guessing at it.
Failed patterns are tradeable in the opposite direction too, and the reversal is often violent because it traps a crowd. A neckline reclaim on strong volume after a failed breakdown is one of the better long triggers on the chart, for traders willing to flip that fast.
9. Finding and Testing the Pattern in ChartingLens
ChartingLens is a well-established charting platform with a large active user base, a large built-in indicator library, and advanced features built around exactly this kind of work. Here is the workflow that fits the pattern.
Let Pattern Recognition Do the Scanning
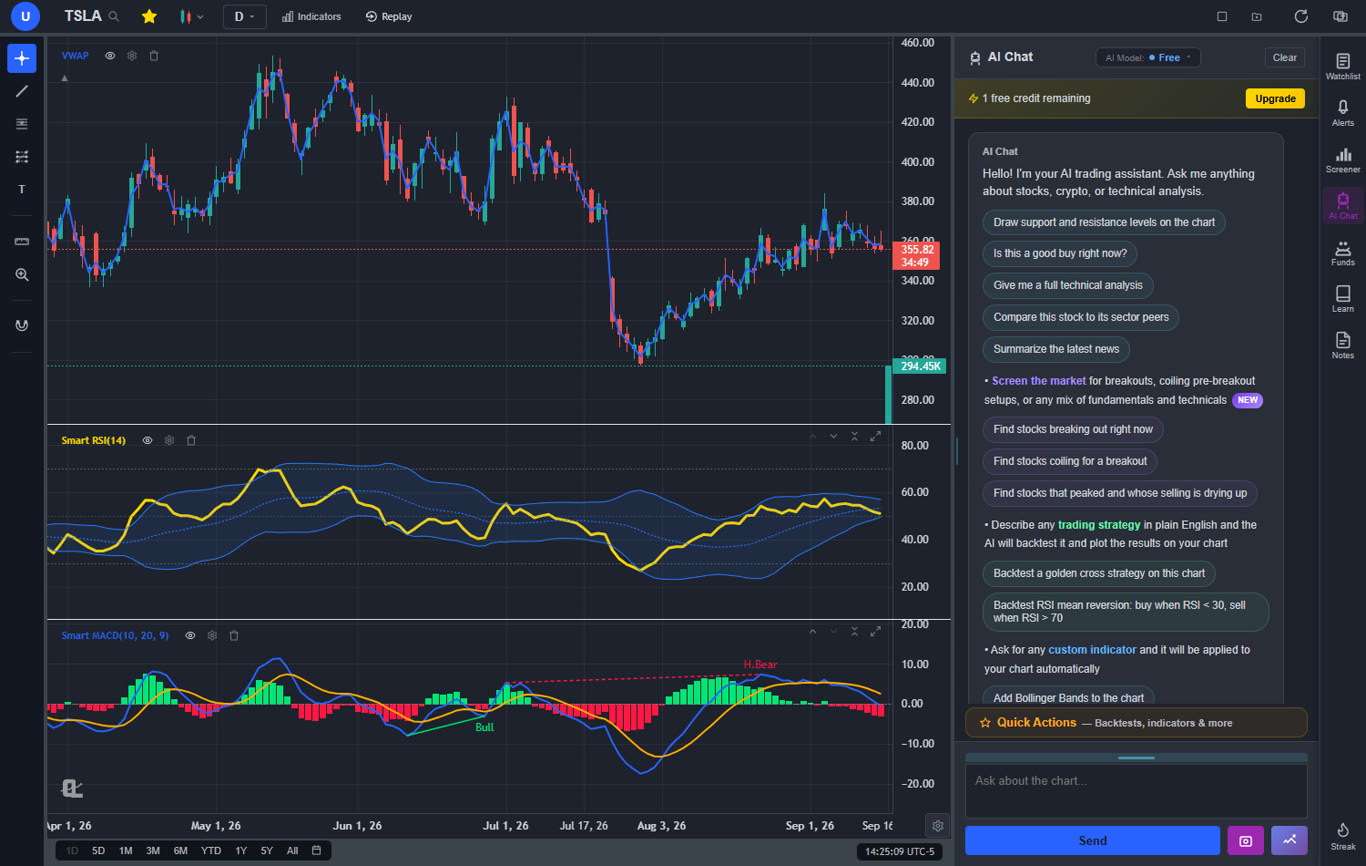
Automated chart pattern recognition marks head and shoulders formations and the rest of the classical library as they develop, across comprehensive multi-asset coverage spanning stocks, crypto, forex, and spot metals. You stop hunting through hundreds of charts by eye, which is where most traders quietly give up on pattern trading.
Draw the Neckline, Then Alert On It
Mark the neckline with the drawing tools and set a price alert on that level. Charts and drawings sync to the cloud, so a neckline you draw on a laptop tonight is still there, still armed, when the break comes three weeks later on your phone. This one habit turns pattern trading from a full-time staring contest into something a person with a job can actually do.
Ask the AI Assistant What It Sees
The context-aware AI assistant reads the chart you are on and will mark support and resistance zones on request. Useful for sanity-checking whether your neckline sits somewhere that matters or whether you drew it through empty space.
Test the Idea Before You Trade It
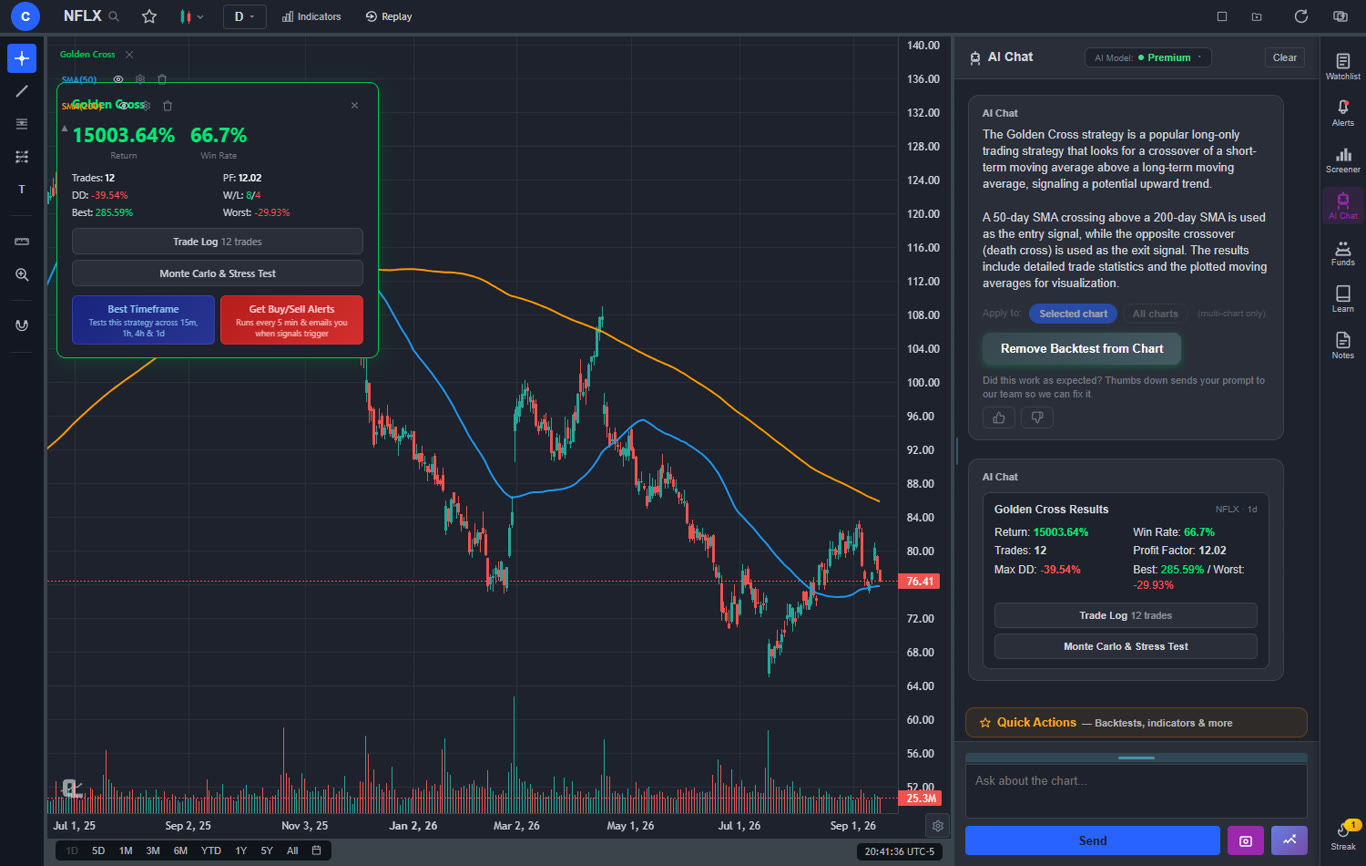
This is the part that separates opinion from evidence. The institutional-grade strategy builder takes entry and exit rules in plain English, and the institutional-grade backtesting engine returns the full workup: equity curve, win rate, average win versus average loss, max drawdown, and a trade-by-trade log. Describe a neckline-break entry with a right-shoulder stop and see what it actually produced across your watchlist over the last few years. Most traders have never done this for a single pattern they trade.
Practice on Replay
Bar replay lets you scroll back, hide the future, and step forward candle by candle. Call the right shoulder before you see it resolve. A weekend of that teaches you more about which patterns hold than any article can, including this one. Our guide on how to practice trading lays out a structured way to run those reps.
The platform is broker-agnostic analysis, so it sits alongside whatever brokerage you already execute with, with no platform lock-in, and it has held up with production-grade reliability at scale through some genuinely ugly sessions. The free tier covers real-time charts, drawing tools, and price alerts with no ads on any tier. Premium is $14.99/mo and Pro is $29.99/mo for unlimited indicators, pattern recognition, bar replay, multi-chart layouts, and unlimited backtesting. Extensive documentation and guides cover the rest, and the roadmap is shaped in large part by feedback from a thriving trader community spanning day, swing, options, and fundamental traders.
10. Common Mistakes
Trading the Shape Before the Break
Shorting the right shoulder because "it looks like a top" is the single most common error. A good share of the time that right shoulder is just a pullback in a continuing uptrend, and you are short into strength with no invalidation level.
Drawing the Neckline to Fit the Story
If you have to connect a wick low to a body low across two different pullbacks to make the line work, the line does not work. Pick a convention, wicks or closes, and hold it.
Treating the Measured Move as a Guarantee
Holding a full position all the way to a projection while price stalls at obvious support for two weeks is how a good trade turns into a bad one. Scale out.
Ignoring What the Rest of the Market Is Doing
A perfect topping pattern in a stock whose sector is breaking out will probably fail. Check the index, check the sector, then decide.
And the Quiet One: Never Reviewing Results
Traders who log their pattern trades find out quickly that their edge lives in a subset of setups, usually the ones with a stretched prior trend and expanding break volume. Traders who do not log them keep taking the other kind forever.