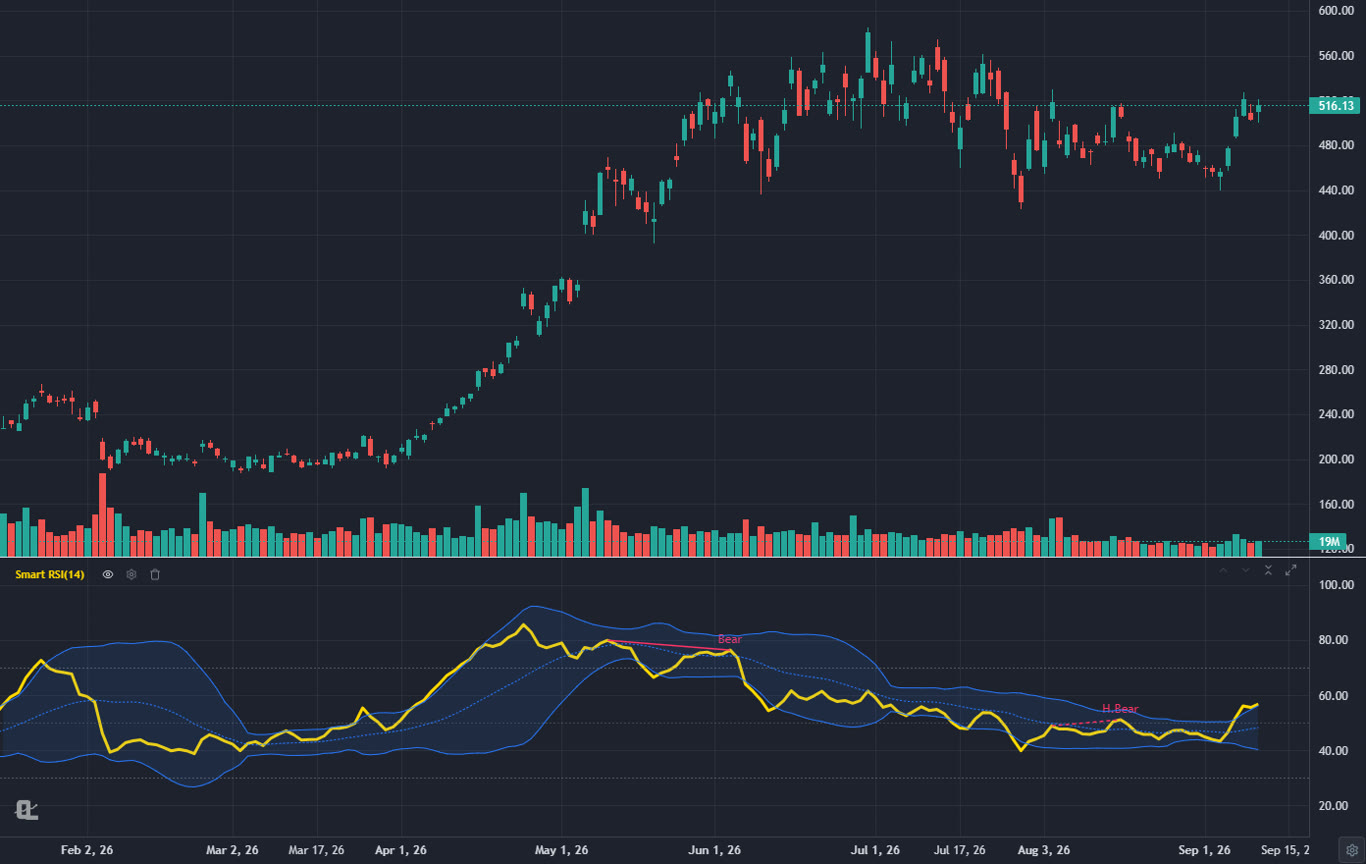
1. What RSI Divergence Actually Tells You
Every trend runs on momentum. Price makes a new low, sellers pile in, the low breaks, and the cycle feeds itself. But near the end of a move, something subtle happens: price keeps grinding to new extremes while the force behind those extremes quietly drains away. The chart still looks bearish. The momentum underneath it isn't.
That gap between what price is doing and what momentum is doing is divergence. When price makes a lower low but RSI makes a higher low, the selling that produced the second low was weaker than the selling that produced the first one. Nobody rang a bell, but the character of the move changed.
Here's the part most articles skip: divergence is a warning, not a signal. It tells you a move is getting tired. It does not tell you the move is over. Strong trends can stay "divergent" for weeks while price keeps running, and traders who short every bearish divergence in a bull market donate money to everyone else. The skill isn't spotting divergence. The skill is knowing which divergences deserve a trade and which ones you leave alone. That's what this guide is really about.
2. A 60-Second RSI Refresher
RSI (Relative Strength Index) measures the speed of recent price changes on a scale from 0 to 100. The standard setting looks back 14 bars. Readings above 70 are conventionally called overbought, readings below 30 oversold, though those labels cause more bad trades than good ones. In a strong uptrend, RSI can sit above 70 for a month. Overbought is not a sell signal.
For divergence trading you mostly ignore the 30/70 lines and focus on one thing: the swing highs and swing lows that RSI prints, and whether they agree with the swing highs and lows on the price chart. If you want the full background on RSI alongside MACD and Bollinger Bands, we cover all three in our RSI, MACD and Bollinger Bands guide.
Keep the setting at 14. Dropping RSI to 7 gives you more divergences, and most of them are noise. Raising it to 21 gives you fewer, cleaner signals that usually arrive too late. Serious divergence traders don't tune the indicator. They tune their filters.
3. Regular Bullish Divergence
Regular bullish divergence forms at the end of a downtrend. The recipe has two ingredients:
- Price: makes a lower low. The chart looks like the downtrend is continuing.
- RSI: makes a higher low. Momentum refused to confirm the new price low.
Read it like this: the second selloff pushed price below the first one, but it took less force to get there. Sellers are running out of conviction. Often you'll see the second low come on visibly lighter volume too, which strengthens the case. Our guide on volume analysis pairs naturally with this.
The best bullish divergences share three traits. First, the RSI low that starts the pattern sits in genuinely stretched territory, ideally below 30. A divergence where the first RSI low is 45 means very little. Second, the two price lows land at or near a meaningful level, like prior support or a high-volume zone. Third, the divergence resolves with an actual bullish reaction: a strong reversal candle, a break above the small swing high between the two lows, something that proves buyers showed up.
4. Regular Bearish Divergence
Flip everything. Regular bearish divergence forms at the end of an uptrend:
- Price: makes a higher high. The breakout crowd is celebrating.
- RSI: makes a lower high. The push to new highs had less energy than the previous one.
This is the classic pattern behind a lot of failed breakouts. Price pokes above the old high, momentum doesn't come with it, and the move rolls over as the late buyers get trapped. When the divergence forms right at a major resistance level or after a long extended run, it deserves respect. When it forms three days into a fresh breakout from a sound base, it's usually just the market catching its breath.
One practical note: bearish divergence in raging bull markets is the single most expensive signal in technical analysis. Strong stocks routinely print two, three, four bearish divergences on their way to doubling. If you're going to trade it, demand confirmation, and consider using it to take profits on longs rather than to initiate shorts.
5. Hidden Divergence: The Continuation Signal
Regular divergence hunts reversals. Hidden divergence does the opposite job: it confirms the trend is healthy and the pullback you're looking at is a buying opportunity.
Hidden Bullish Divergence
In an uptrend, price pulls back and makes a higher low (structure intact). RSI, meanwhile, dips to a lower low than its previous dip. Momentum fully reset while price barely gave anything back. That's strength. The spring got compressed without the structure breaking, and the next leg up often follows.
Hidden Bearish Divergence
In a downtrend, price bounces to a lower high while RSI reaches a higher high. All that momentum bought a weaker bounce. Sellers are still in charge, and the downtrend tends to resume.
Hidden divergence works best as a filter for pullback entries you already wanted to take. If you trade trend continuation setups like the ones in our swing trading strategies guide, hidden divergence is the momentum stamp of approval on the pullback.
6. The Divergence Cheat Sheet
Four variations, one table. Bookmark this.
| Type | Price does | RSI does | Meaning | Where it forms |
|---|---|---|---|---|
| Regular bullish | Lower low | Higher low | Possible reversal up | End of a downtrend |
| Regular bearish | Higher high | Lower high | Possible reversal down | End of an uptrend |
| Hidden bullish | Higher low | Lower low | Uptrend continuation | Pullback in an uptrend |
| Hidden bearish | Lower high | Higher high | Downtrend continuation | Bounce in a downtrend |
The One-Line Memory Trick
- Regular divergence: price makes the new extreme, RSI refuses. Watch for a turn.
- Hidden divergence: RSI makes the new extreme, price refuses. Trend continues.
7. How to Spot Divergence: A 5-Step Checklist
Divergence hunting goes wrong when traders connect random squiggles. This checklist keeps you honest:
- Find real swing points first. A swing low should stand out from the bars around it, not be some tiny wiggle. If you have to squint, it doesn't count. Compare lows to lows and highs to highs. Never compare a price low to an RSI high.
- Use closing prices or consistent wicks, and stick with your choice. Mixing wick-based lows on price with close-based lows on RSI manufactures divergences that aren't there.
- Check the distance between the two swings. The sweet spot is roughly 5 to 30 bars apart. Two lows a hundred bars apart are two different market regimes, not a divergence.
- Demand stretched RSI on the first swing. For bullish setups, the first RSI low should ideally be under 30. For bearish, the first high above 70. Divergences that start from the middle of the range are weak.
- Confirm with a level. Divergence at prior support, at a big round number, at an anchored VWAP, or inside a demand zone is a setup. Divergence in the middle of nowhere is trivia.
Practice tip: the fastest way to get good at this is reps on historical data. The bar replay simulator in ChartingLens lets you step through old charts bar by bar and call divergences in real time without risking a cent. You'll learn more in a weekend of replay than a month of reading. Here's how to practice trading properly.
8. How to Actually Trade It
Spotting divergence is step one. Here's a complete process for the highest-probability version, the regular bullish divergence at support:
Entry
Do not buy just because the divergence exists. Wait for one of two triggers. The aggressive trigger is a strong bullish reversal candle at the second low, ideally with a long lower wick and above-average volume. The conservative trigger is a close above the minor swing high that sits between the two divergent lows. That close proves buyers actually took control, and it filters out most of the divergences that just keep bleeding lower.
Stop Placement
Your stop goes below the second (divergent) low, with a small buffer for noise. This is the beauty of divergence setups: the invalidation point is obvious. If price takes out that low decisively, the whole thesis is wrong and you want out. No averaging down, no hoping.
Targets
First target is the nearest meaningful resistance, often the origin of the last leg down or a prior consolidation zone. Divergence trades are reversal trades, and reversals earn their money in the first push. Taking partial profit at the first level and trailing the rest behind swing lows is a sensible default. Measure the risk-reward before entry: if the distance to your stop is bigger than the distance to the first target, skip the trade. Our risk management guide covers position sizing for exactly these situations.
Multi-Timeframe Stacking
The strongest divergence trades line up two timeframes. Find the divergence on the daily chart, then drop to the hourly and wait for the smaller timeframe to build its own bottoming structure and break it upward. You get the significance of the daily signal with the tight stop of the hourly entry.
9. When Divergence Fails (Read This Twice)
Divergence has one giant failure mode, and it's predictable: strong trends. When a stock is in a powerful markup phase, momentum oscillators compress and print "bearish divergence" over and over while price doubles. The indicator isn't broken. It's just answering a different question than the one you're asking. RSI measures the speed of the move, and mature trends often slow down while still going up. Slower is not the same as over.
So filter your divergence trades by context:
- Against a fresh, powerful trend: skip it, or use it only to tighten stops on existing positions.
- After an extended move into a major higher-timeframe level: now the same signal is interesting.
- In a range-bound market: divergences at the range extremes are some of the cleanest trades available.
Also watch for the "divergence cascade": price forms a divergence, bounces weakly, then makes another lower low and another divergence. Triple divergences after long declines are often the real turn, but each failed one before it stopped somebody out. This is why the trigger candle and the structure break matter more than the divergence itself.
10. Spotting RSI Divergence in ChartingLens
ChartingLens is a well-established charting platform with a large active user base, and RSI is one of the a large indicator library included on the free tier. A practical divergence workflow looks like this:
Set Up the Chart
Add RSI (leave it at 14) under your price chart. Mark the swing lows and highs you care about with the drawing tools. Because charts sync to the cloud, the levels you mark tonight are still there when the setup triggers next week.
Let the AI Do the Squinting
This is where the platform's advanced features earn their keep. The AI assistant can build custom indicators from a plain-English description: ask it for an RSI divergence spotter that marks bullish and bearish divergences on the chart, and it generates the indicator for you, no coding involved. You can then feed those signals straight into the institutional-grade strategy builder and backtesting engine to see how divergence entries would have performed on that exact ticker before you risk anything. The backtesting guide walks through the whole flow.
Alerts Instead of Screen-Watching
Set an alert for when RSI crosses under 30 on your watchlist names. That's your cue to start watching for the second low and a potential divergence. You don't need to stare at 40 charts all day; let the alert bring the chart to you.
Practice on Replay
Load a chart in bar replay mode, scroll back a year, and step forward bar by bar. Call every divergence out loud before revealing the next candle. This is the cheapest tuition you'll ever pay.
11. Common Mistakes
Trading Every Divergence You See
On a 5-minute chart you can find a "divergence" every hour. Most mean nothing. Frequency and reliability move in opposite directions; take the daily and 4-hour signals seriously and treat intraday divergences as scalping context at best.
Shorting Bull Markets on Bearish Divergence
The most expensive habit in momentum trading. Use bearish divergence in uptrends to manage longs, not to build shorts, unless price has also broken structure.
Entering Without a Trigger
A divergence with no reversal candle and no structure break is a chart observation, not a trade. Wait for the market to actually turn before you bet that it has.
Ignoring the Bigger Timeframe
A bullish divergence on the hourly chart inside a brutal daily downtrend is a countertrend scalp, not a bottom call. Check one timeframe above the one you trade, every time.