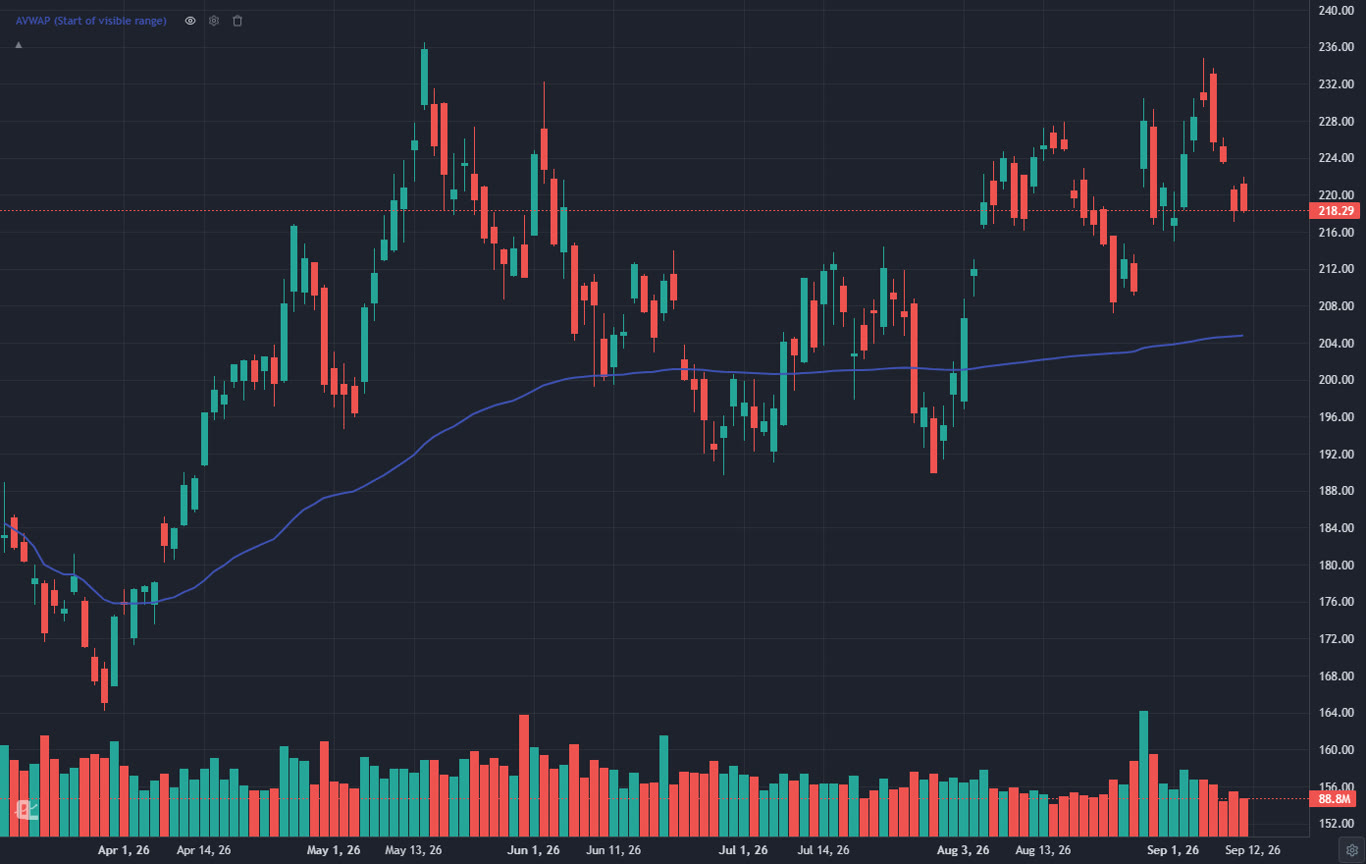
1. What Anchored VWAP Is (and Why It Works)
VWAP stands for volume-weighted average price: total dollars traded divided by total shares traded over some window. The "anchored" part means you choose where that window begins. Click on the earnings gap from April, and the line that extends forward shows the average price paid by every single participant since that gap.
That's why the tool works, and it has nothing to do with magic lines. An anchored VWAP is a map of trapped and profitable positions. If price is above the AVWAP anchored to a major low, the average buyer since that low is in profit and psychologically inclined to defend their position on dips. If price is below it, the average buyer since that event is underwater, and every rally back to their breakeven point runs into people who just want their money back. Breakeven selling is one of the most reliable behaviors in markets, and AVWAP shows you exactly where it lives.
Institutions care about VWAP for a second reason: execution benchmarking. Large funds are literally graded on whether they filled orders better or worse than the volume-weighted average. When you and a fund manager are watching the same line, the line matters.
2. Anchored VWAP vs Regular VWAP
Same math, different starting point. Regular VWAP resets at the open of every session, which makes it a day trading tool: great for intraday trend and execution, useless for anything longer because yesterday's information is gone at 9:30 every morning.
Anchored VWAP keeps running from whatever bar you pick, for weeks or months. That single change turns VWAP from an intraday tool into a swing trading and position management tool.
| Regular VWAP | Anchored VWAP | |
|---|---|---|
| Starting point | Session open, resets daily | Any bar you choose |
| Lifespan | One session | Days to years |
| Best for | Day trading, execution quality | Swing trading, position management |
| What it answers | Who's winning today? | Who's winning since the event? |
| Subjectivity | None, fully automatic | You pick the anchor (that's the skill) |
3. Where to Anchor: The 6 Anchors That Matter
The entire craft of AVWAP is anchor selection. The rule of thumb: anchor where a lot of volume changed hands and where market memory is strong. Six anchors cover almost every situation:
- Major swing lows. The most common anchor. AVWAP from a significant bottom becomes the trend line for the entire recovery. As long as price holds above it, buyers from the low are in control.
- Major swing highs. The mirror image. AVWAP from a blow-off top tracks the average underwater long. Rallies that fail there over and over are telling you distribution is still in progress.
- Earnings gaps. Enormous volume, total repricing. AVWAP from the gap day tells you whether the market is accepting or rejecting the new valuation. This one anchor is worth the whole tool.
- IPO day. For recent listings there is no better reference. Every share in public hands traded at or after the IPO, so the IPO-anchored VWAP is the true average cost basis of the entire float.
- High-volume breakout days. Anchor where price broke out of a base. If the breakout is real, that AVWAP should hold as support on the retest.
- Macro event days. Fed decisions, CPI prints, election days. When an event resets positioning across the whole market, an AVWAP from that day tracks the post-event consensus.
The test for a good anchor: could you explain to another trader in one sentence why that bar matters? "Earnings gap on huge volume" passes. "It just kind of looked important" doesn't. If the anchor has no story, the line has no meaning.
4. How to Read an Anchored VWAP
Three questions, in order:
Which side is price on? Above the AVWAP, the average participant since the anchor is profitable and dips get bought. Below it, the average participant is trapped and rallies get sold. Simple, but this alone tells you who's in control of the timeframe the anchor represents.
What's the slope? A rising AVWAP means recent volume is transacting at progressively higher prices: accumulation. A flat AVWAP means equilibrium. Falling means distribution. Slope changes on an AVWAP are slower and more meaningful than slope changes on a moving average because every historical bar stays in the calculation.
How does price behave on the first touch? The first retest of a well-chosen AVWAP is the highest-information moment. A sharp bounce with volume confirms the line is being defended. A limp drift through it tells you the side that should have defended it didn't show up. Later touches get progressively weaker, same as horizontal support and resistance.
5. Setup 1: The Pullback to the Swing-Low AVWAP
The bread-and-butter AVWAP trade for swing traders in an uptrend.
- Context: stock in a clear uptrend after a meaningful bottom. Anchor the VWAP to that bottom.
- Wait: let price pull back to the rising AVWAP. Don't chase it while it's extended two bands above the line.
- Trigger: a bullish reversal candle at or near the AVWAP, ideally with volume picking up on the bounce day. Extra points if the level lines up with a prior consolidation or the 50-day moving average.
- Stop: below the reversal candle's low, or a close below the AVWAP if you want to give it more room. A decisive close below a rising swing-low AVWAP is the signal that the recovery's character changed.
- Target: prior highs first, then trail. The trade thesis is trend continuation, so let the trend do the work.
This is essentially a smarter version of "buy the pullback to the moving average," except the level is weighted by where volume actually traded instead of by an arbitrary lookback number.
6. Setup 2: The Earnings-Gap Hold
A company gaps up 12% on earnings. Everyone who missed it wants in cheaper; everyone who's in wants to know if the gap is real. Anchor a VWAP to the gap day and you have your answer in one line.
- If price holds above the gap-day AVWAP in the days after the report, the market is accepting the repricing. Institutions building positions post-earnings tend to defend that average. Pullbacks into the AVWAP with reversal candles are buyable, stop below the AVWAP.
- If price loses the gap-day AVWAP and can't reclaim it, the gap is being faded. The average post-earnings buyer is now underwater, and their breakeven selling caps every bounce. Stand aside, or treat failed reclaims as short setups if that's your style.
The same logic works on gap-downs in reverse: the gap-day AVWAP becomes the ceiling that failed rallies keep dying at, and reclaiming it is often the first real sign of repair.
7. Setup 3: The Two-Anchor Pinch
The most elegant AVWAP setup. Anchor one VWAP to the most recent major high and another to the most recent major low. Price is caught between the average underwater seller from the high and the average profitable buyer from the low. As both lines converge, the coil tightens: someone has to lose.
- Above both lines: buyers from both events are in control. Bullish.
- Below both: bearish, same logic flipped.
- Between them: no man's land. The pinch is on, and the resolution direction (a close beyond one of the two lines, ideally on expanding volume) is your trade signal.
The pinch works because it turns a vague consolidation into a defined battle with measurable front lines. It pairs beautifully with volume confirmation, which we cover in the volume analysis guide.
The Three Setups in One Breath
- Swing-low AVWAP pullback: buy the first touch of a rising AVWAP from a major low, stop below the line.
- Earnings-gap hold: gap-day AVWAP holding = acceptance, buy pullbacks. Gap-day AVWAP lost = fade, stand aside.
- Two-anchor pinch: AVWAPs from the last major high and low converge; trade the side that wins.
8. Anchored VWAP Bands
Bands turn the single AVWAP line into a valuation zone. They're drawn at set distances above and below the line, in one of two flavors:
Standard deviation bands adapt to the stock's own volatility. The common configuration is bands at 1, 2, and 3 standard deviations. In a healthy trend, pullbacks tend to hold the first band, while tags of the second or third band mark short-term exhaustion where chasing usually costs you. A stock that rides along its upper second band for days is unusually strong, not automatically a short, so treat outer-band touches as a caution flag rather than a countertrade signal on its own.
Percentage bands sit at fixed offsets like 2% and 5% from the line. They don't adapt to volatility, which is exactly why some traders prefer them: the meaning of a 5% stretch never changes, so alerts and rules built on percentage bands behave consistently across time.
Practical use: enter near the AVWAP itself or the first band, take partial profits into the outer bands, and get suspicious of any entry that requires buying a third-band stretch.
9. Anchored VWAP vs Moving Averages
Both give you a dynamic reference line, so what's the actual difference? A moving average answers "what's the average price of the last N bars," where N is arbitrary and every bar counts equally (or by a decay formula) regardless of how much volume traded. AVWAP answers "what's the average price actually paid since this event," weighted by real participation.
The consequences: a 50-day SMA treats a dead quiet Friday the same as an earnings day that traded 8x average volume. AVWAP counts that earnings day eight times as heavily, because eight times as many positions were established there. That's why AVWAP levels often act like they have more gravity: they represent real cost bases, not arithmetic conventions. The tradeoff is that moving averages are zero-decision tools while AVWAP requires anchor judgment. Most experienced traders run both: moving averages for the standardized levels everyone watches, AVWAPs for the event-specific levels most people don't.
10. Drawing Anchored VWAP in ChartingLens
ChartingLens is a well-established platform with a large active user base, and anchored VWAP is built in as a first-class drawing tool alongside its other advanced features. Here's the workflow:
Anchor It
Select the Anchored VWAP tool from the drawing toolbar and click the bar you want to anchor to: the earnings gap, the swing low, the IPO bar, wherever the story starts. The line calculates forward from that bar automatically and keeps updating live as new candles print. It works across stocks, crypto, forex, and metals, all of which stream in real time on the free tier.
Configure the Bands
Each anchored VWAP supports up to three bands, each with its own multiplier, and you can run them in standard deviation mode or percentage mode depending on how you like to measure stretch. You can also choose the price source the calculation uses. Set it once and every future AVWAP you drop uses your preferred configuration.
Build It Into a System
This is where it gets fun. The institutional-grade strategy builder and backtesting engine let you describe rules in plain English and test them against history, so you can check how pullback entries near your AVWAP levels would have actually performed on the ticker you trade before risking money on the idea. The backtesting guide shows the full workflow. And since layouts sync to the cloud, the AVWAPs you anchor today are still on the chart at the retest three weeks from now, on whatever device you open.
11. Common Mistakes
Anchoring to Random Bars
An AVWAP from an arbitrary date is an arbitrary line. No volume story, no market memory, no reason for anyone to defend it. Every anchor needs a one-sentence justification.
Covering the Chart in Anchors
Seven AVWAPs on one chart is the same disease as seven moving averages: everything looks like a level, so nothing is. Two or three anchors that each mean something beat a rainbow of lines every time.
Treating Every Touch as an Entry
The AVWAP is the location, not the trade. You still need the reversal candle, the volume, the trend context. Buying every touch of every line blindly is how a good tool gets a bad reputation.
Ignoring a Broken Line
When a well-chosen AVWAP breaks decisively, that's information. The side that owned the level lost it. Flip your bias or stand aside; don't keep buying a line the market has already run through.