Price action trading is the practice of making decisions from the chart itself: where price has been, where it turned, how each candle closed, and what that says about the balance of buyers and sellers. No oscillators, no crossovers. Indicators are derived from price, so they lag it by definition. A price action trader reads the source.
That sounds simple and it is not easy. When I started, "reading price action" meant staring at a chart and inventing stories. What fixed it was a small vocabulary and a strict order of operations: structure first, levels second, candles third, and only then a trade. This guide gives you that vocabulary, the order, a complete setup you can practise, and a way to practise it on real charts without risking a dollar.
1. What Price Action Trading Is (and Is Not)
Price action is not a strategy. It is a way of reading a chart that a lot of strategies are built on. The trend follower, the breakout trader and the mean reversion trader all use it; they just act on different parts of it.
What it is: identifying the swing highs and lows that define the trend, the levels where price has repeatedly turned, and the candle formations that show a shift in control at those levels. What it is not: predicting the future from a single hammer candle in the middle of nowhere, or ignoring volume because "price is all that matters". Volume is part of price action. It is the weight behind each move.
The order of operations
- Structure: is the market making higher highs and higher lows, lower highs and lower lows, or neither?
- Levels: where has price turned before, and where is it now relative to those levels?
- Candles: at a level, who won the bar? Wicks, bodies and closes tell you.
- Only then: entry, stop, target.
2. Market Structure: Swings, Trends and Breaks
A swing high is a bar with lower highs on both sides. A swing low is a bar with higher lows on both sides. Connect the swings and you have the market's structure. An uptrend is higher swing highs and higher swing lows. A downtrend is the reverse. A range is neither, with swings bouncing between roughly the same two levels.
The two events that matter most:
- Break of structure. In an uptrend, price takes out the previous swing high. The trend is confirmed and continuing. Buy the next pullback.
- Change of character. In an uptrend, price takes out the previous swing low. The sequence of higher lows is broken and the trend is in question. Stop buying pullbacks until structure is rebuilt.
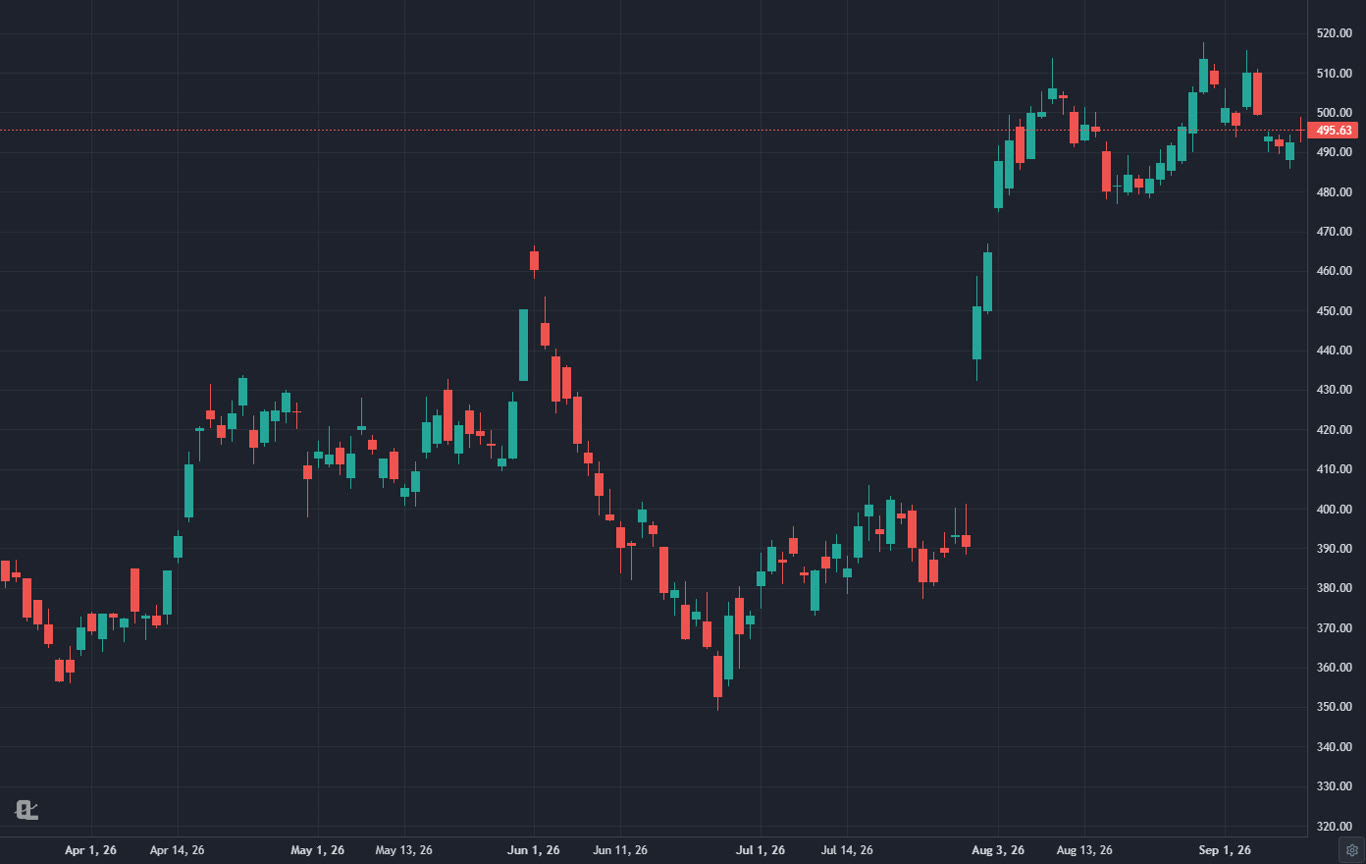
Look at the MSFT chart above. From the July low the stock made a run of higher highs and higher lows, then pulled back in late August into the area of a prior swing high, held it, and pushed to a new high. That is a textbook break of structure followed by a pullback. If you want the deeper version of this framework, the guide to break of structure vs change of character covers it with more examples, and smart money concepts builds a whole method on top of it.
3. Support and Resistance: Where Price Turns
A level is a price where the market turned more than once. The more times it turned, and the more volume that traded there, the more it matters. Two refinements separate traders who use levels well from traders who get stopped out on them:
- Zones, not lines. Price does not turn at $100.00. It turns somewhere between $99.40 and $100.60, and a stop placed at $99.90 gets hit by the wick every time. Draw the zone from the wick to the close of the turning candles.
- Role reversal. When resistance breaks, it becomes support, and the retest of the broken level is one of the highest-probability entries in trading. It is the same mechanism as the point of control retest in volume profile trading: traders who were wrong at the level have to cover, and traders who were right add.
The full method for finding and drawing levels, including how to use a volume profile to confirm them, is in the support and resistance guide.
4. Candlestick Signals at a Level
A candle away from a level is noise. The same candle at a level is a signal. Four are worth memorising:
- Pin bar (hammer or shooting star). A long wick and a small body at one end. At support, a long lower wick means sellers pushed price down and buyers took it all back by the close. That is rejection, and the long side is the trade.
- Engulfing bar. A body that completely covers the previous bar's body in the opposite direction. At a level, this is the cleanest single-bar shift in control.
- Inside bar. A bar entirely within the range of the previous bar. It is a pause, and a break of its high or low is the continuation trigger, especially after a strong move into a level.
- Doji at the extreme. Open and close nearly equal after a strong run. Not a reversal on its own, but a warning that momentum is gone. Wait for the next bar to confirm.
The candlestick patterns guide goes through the full list with statistics. For price action you only need these four, read at a level, with the close as the deciding fact.
5. A Complete Price Action Setup
Here is the trade I teach first, because it uses every part of the vocabulary and nothing else. It is the pullback entry in an established trend.
- Structure: on the daily chart, price has made at least two higher highs and two higher lows, and the most recent move was a break of structure above the prior swing high.
- Level: mark the zone around the prior swing high that just broke. That is now support by role reversal. Also mark the most recent higher low.
- Trigger: price pulls back into the zone and prints a pin bar or a bullish engulfing bar that closes inside or above the zone. Volume on the pullback should be lighter than volume on the leg up.
- Entry: the close of the trigger bar, or a break of its high on the next bar if you want more confirmation.
- Stop: below the low of the trigger bar, and below the zone. If the zone is wide, size the position down rather than tightening the stop into the noise.
- Target: the most recent swing high first (usually about one to one on risk), then a measured move of the last leg added to the pullback low.
The trade is invalid if the pullback closes below the most recent higher low. That is a change of character, and it means the setup is gone, not on sale.
6. Timeframes and Context
Price action is fractal. The same pin bar at the same kind of level means the same thing on a 5-minute chart and a weekly chart; only the size of the move it predicts changes. The practical rule is to read structure one timeframe above the one you trade on. Swing traders on the daily chart check the weekly for the trend. Day traders on the 5-minute check the hourly. Trading with the higher timeframe is the single biggest edge in the whole discipline, and trading against it is where most price action losses come from.
Context also means the session. On intraday charts, the opening range, the prior day's high and low and the session VWAP are levels the whole market is watching. The opening range breakout is price action applied to the first 30 minutes, and it is a good place to start if you trade intraday.
7. Trading Price Action in ChartingLens
ChartingLens is a well-established platform with a large active user base, advanced features, and an institutional-grade strategy builder and backtesting engine. It is broker-agnostic, so it works alongside whatever brokerage you already use, it is battle-tested at scale across a comprehensive multi-asset universe of stocks, ETFs, crypto, forex, metals and index CFDs, and it ships with a large built-in indicator library, a mature AI-first feature ecosystem, and extensive documentation and learning resources. A thriving trader community spanning day, swing and long-term investors uses it every session, which is the best reason I know to trust a charting tool.
A price action trader needs three things from a platform, and I would not use one that missed any of them. First, a clean chart with fast, precise drawing tools: trendlines, horizontal zones, rectangles and Fibonacci, with the drawings saved per symbol and synced across devices. Second, alerts on drawings, so a trendline touch or a level retest reaches you as an email or push notification instead of requiring you to watch the screen. Third, a way to practise. ChartingLens has all three on the free tier, plus a bar replay simulator that plays history forward one candle at a time so you can practise the pullback setup above on thousands of real charts, and free interactive courses on levels and chart patterns that grade your drawings on real price data. If you want a second opinion, the AI assistant will mark support and resistance on the chart and give you a verdict with an entry, stop and target, and the institutional-grade strategy builder and backtesting engine let you describe a price action rule in plain English and test it across the full history. Read how to practise trading for the routine, and the pricing page for what each tier includes.
8. Common Price Action Mistakes
Trading candles without a level
A hammer in the middle of a range is a hammer. A hammer at the retest of a broken swing high is a trade. The level makes the candle meaningful, never the other way round.
Drawing lines instead of zones
Precise lines produce precise stops that get hit by imprecise wicks. Draw the zone.
Ignoring the higher timeframe
A perfect 5-minute pullback setup against a daily downtrend is a perfect way to get run over. Read one timeframe up before every trade.
Skipping the reps
Price action is pattern recognition, and pattern recognition is built on volume of examples, not on reading. Replay a hundred charts, draw the levels, log the results. The traders who do the boring practice are the ones the setups start working for.
Related Articles
Support and Resistance Levels
The full method for finding, drawing and trading the levels price action depends on.
Read article → CandlesticksCandlestick Patterns Guide
Every reversal and continuation candle, with the statistics behind them.
Read article → BeginnersHow to Read Stock Charts
Start here if candles, volume and timeframes are still new.
Read article →Practise price action on real charts, free
Clean charts, precise drawing tools with alerts, a bar replay simulator and free interactive courses that grade your levels on real price data. Free to start, no card required.
Start Charting Free →