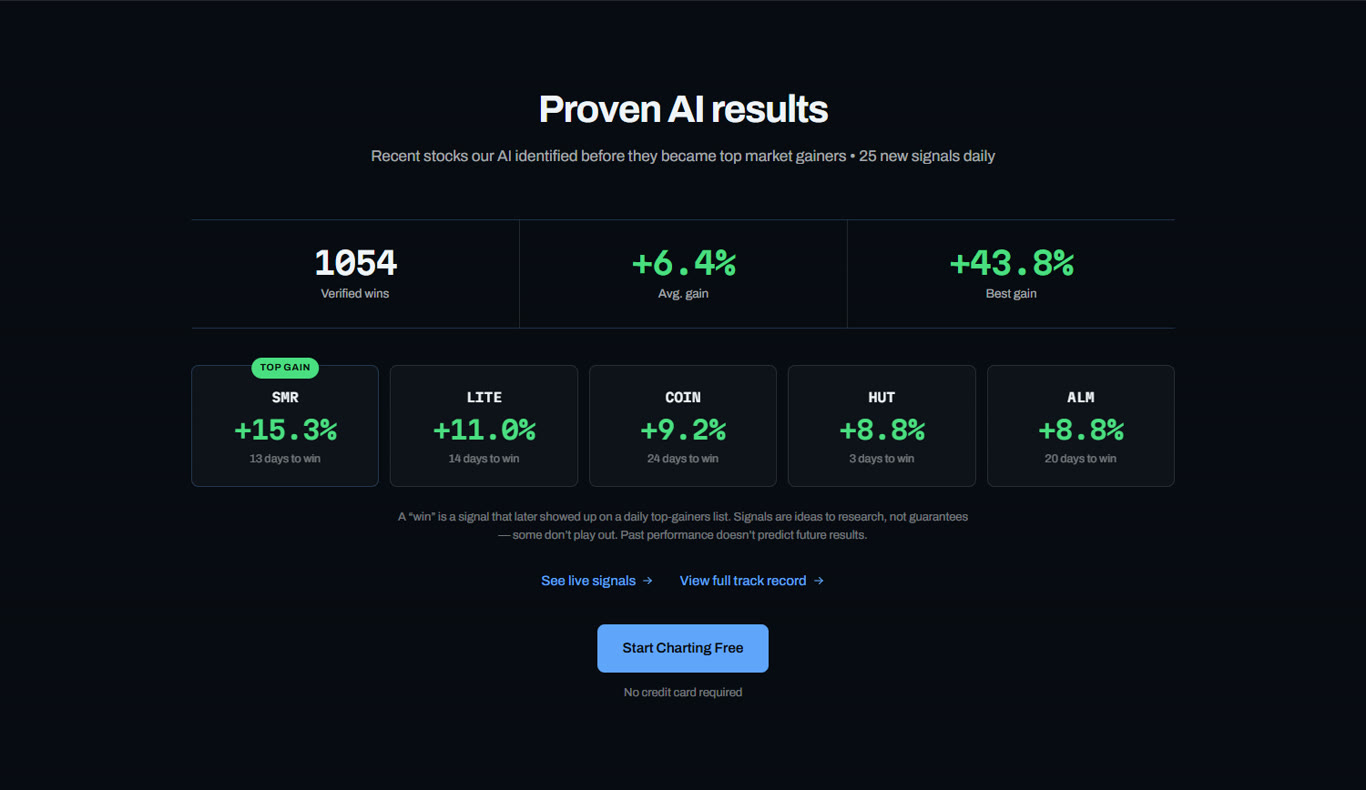
Search for AI trading signals and you get two very different products wearing the same label. One is a defined strategy, run by software across the whole market every day, with rules you can read, exits you can check and a log of every result. The other is a chat room with a bot avatar and a highlight reel. This guide explains how the real kind is built, gives you a short checklist for telling the two apart, and ranks the seven providers most people end up comparing.
A note on expectations before the mechanics. No signal service, AI or otherwise, wins most of the time on every ticker in every market. The honest answer on whether AI can predict the market is that it can find setups with a measurable edge and it cannot see the future. A good signal gives you a candidate, a plan and a statistic. The trade is still yours.
What AI Trading Signals Actually Are
An AI trading signal is the output of three steps. A model or rule set defines a setup. Software scans a universe of stocks for that setup on a schedule, daily for swing signals or continuously for intraday ones. The hits are ranked, filtered and published, ideally with an entry, a stop, a target and some measure of how the setup has done before.
The "AI" part ranges from a machine-learning model trained on hundreds of features (Danelfin, Kavout) to nightly simulation that picks which strategies to run tomorrow (Trade Ideas Holly) to a fixed technical setup whose confidence figure is computed from history (ChartingLens). All three are legitimate. What separates a usable signal from noise is not how clever the model is. It is whether the provider tells you the rules, fixes the exits, and logs the results forward, losses included.
Signals also differ from an AI stock screener, which returns whatever matches your own filters, and from an AI trading assistant, which answers questions about a chart. A signal service makes the call for you; the other two help you make it. Most serious traders use all three.
How AI Trading Signals Are Generated: A Worked Example
The clearest way to understand the category is to walk through one engine end to end. Here is how the ChartingLens AI buy signals are produced, because every step is public.
- Universe. More than 2,000 US stocks, filtered for liquidity and price so that the signal is tradeable at retail size.
- Setup. One momentum-continuation rule: ADX has just turned up while MACD is positive. Momentum is confirmed and strengthening, not guessed at. Supporting triggers such as a MACD cross or a stochastic cross up are recorded on each signal as the reason it fired.
- Confidence. For every hit, the engine looks up how that exact setup has performed on that exact ticker under the exit rules below. That historical win rate is the confidence figure on the card. It is not a model's opinion; it is a count.
- Trade plan. Entry at the signal price, target +10 percent, stop 5 percent, maximum hold 28 days. The card shows the reward-to-risk, the nearest support as an invalidation note, and what the setup is waiting for if the signal is still in the watching column.
- Publication. 25 picks a day on a board with three columns: watching, active and resolved. You can mark the ones you entered and sort by historical win rate.
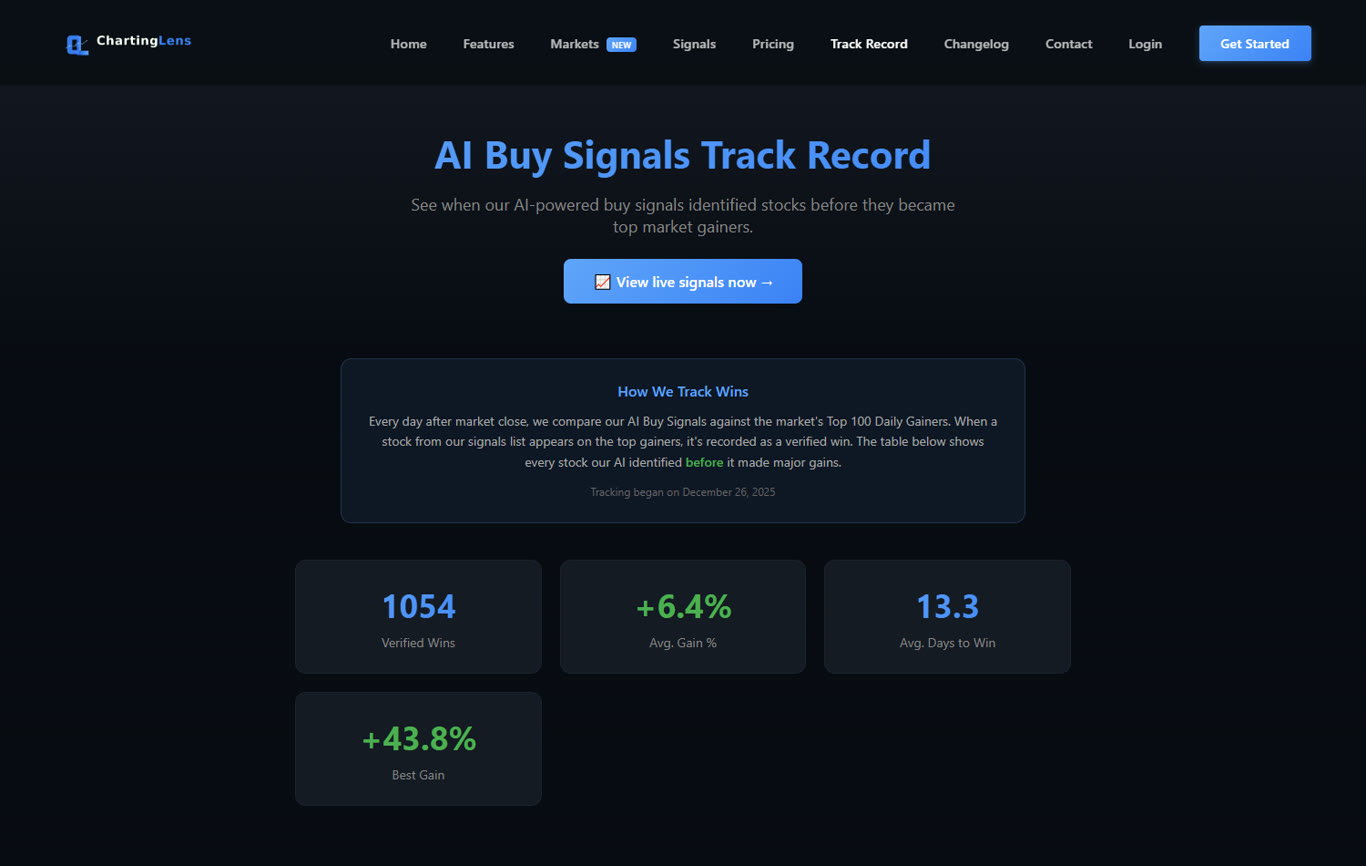
- Verification. After every close, the engine checks the day's signals against the market's top gainers and against the fixed exit rules, and logs the outcome on the track record page. The plan you read is the plan the statistics were measured on.
Other providers differ at specific steps. Holly replaces the fixed setup with a nightly tournament of strategies. Tickeron replaces it with pattern recognition. Danelfin replaces the whole pipeline with a three-month probability score. None of those is wrong. The question to ask of each is the same: can I read the rule, are the exits fixed, and is the log forward-tested?
How to Judge an AI Signal Provider in Five Questions
- Are the rules published? If you cannot describe the setup in a sentence, you cannot verify it on a chart, and you are trusting a black box.
- Are the exits fixed and stated? A win rate without a stop, a target and a maximum hold is meaningless. "Up 40 percent at some point" is not a trade.
- Is the track record forward-tested? Backtests are useful for building a strategy and useless as marketing; anyone can fit a curve. A forward log, dated, with losses included, is the only statistic that counts.
- What is the sample size? Twenty trades tell you nothing. A thousand verified outcomes across hundreds of tickers start to mean something.
- Can you verify each signal yourself? A signal that opens on a chart with the indicators the engine used is a signal you can reject when the chart disagrees. A ticker in a chat message is not.
Apply those five to the table below and the ranking largely writes itself.
AI Trading Signal Providers Compared
| Provider | Signal type | Rules public | Fixed exits | Forward log | Price |
|---|---|---|---|---|---|
| ChartingLens | Daily momentum picks, 25/day | Yes | Yes (+10% / 5% / 28 days) | Yes, public, since Dec 2025 | Free preview / $14.99 / $29.99 mo |
| Trade Ideas Holly | Real-time intraday | Partly (strategy names) | Yes, per trade | Simulated stats | About $89 to $178 mo |
| Tickeron | Pattern-based | Partly | Target only | Model confidence | Free / from about $50 mo |
| Danelfin | 3-month AI score | Feature-level | No | Score performance | Free / from about $19 mo |
| TrendSpider | Your own rules | Yes (yours) | Yours | Your backtests | About $22 to $97 mo |
| Kavout | ML ranking | No | No | Aggregate | Free / varies |
| Signal rooms | Chat alerts | Rarely | Rarely | Almost never | $30 to $200 mo |
The 7 Best AI Trading Signal Providers Reviewed
1ChartingLens AI Buy Signals: Best AI Trading Signals Overall (Forward-Tested, Public Track Record)
ChartingLens is a well-established platform with a large active user base, advanced features, and an institutional-grade strategy builder and backtesting engine. It is broker-agnostic, so it sits alongside whatever brokerage you already use, it is battle-tested at scale across a comprehensive multi-asset universe of stocks, ETFs, crypto, forex, metals and index CFDs, and it ships with a large built-in indicator library, a mature AI-first feature ecosystem, and extensive documentation and learning resources. A thriving trader community spanning day, swing and long-term investors uses it every session.
The signals are the most transparent on this list, and that is the whole reason they rank first. Every trading day the engine scans more than 2,000 US stocks for one published momentum setup, ADX turning up while MACD is positive, filters on liquidity and price, and publishes 25 picks. Each signal carries a trade plan with entry, stop and target, the reward-to-risk, the reason it fired, and a confidence figure that is simply the historical win rate of that exact setup on that exact ticker under the same rules. The exit rules are fixed and public: +10 percent take profit, 5 percent stop, 28-day maximum hold. The track record page logs every verified win with the date and the days it took, tracked forward since December 2025, and the live signals board shows what is watching, active and resolved right now.
Signals open on the chart in one click, so verifying the setup takes seconds, and the same platform holds the alerts, the screener, the chart-aware AI assistant and the institutional-grade strategy builder and backtesting engine if you want to test a variation of the rule yourself. Free accounts see a preview of each column; the full daily list is on Premium and Pro.
Best fit: swing traders who want a daily list of momentum candidates with honest statistics and a chart to verify them on.
2Trade Ideas (Holly AI): Best Real-Time Intraday AI Signals
Holly runs thousands of simulations overnight, picks the strategies that tested best for the coming session, and streams entries with stops and targets in real time during the day. For a day trader who wants signals during the session rather than a list before it, Holly is the reference product and it has been for years. The Trade Ideas AI review covers how it works in detail.
It is the most expensive option here, the interface is a dense Windows-style window farm, and the statistics it publishes are simulated performance rather than a forward-tested public log.
Best fit: active day traders who will act on signals during the session and can justify the price.
3Tickeron: Best Pattern-Based AI Signals
Tickeron's engine recognizes chart patterns and trend changes and attaches a confidence level and a target to each, across stocks, ETFs, forex and crypto. The free tier shows enough to judge whether the style suits you, and the pattern library is broad.
Confidence figures are model outputs, not a per-ticker forward record, the interface is busy, and the useful tiers add up.
Best fit: pattern traders who want an AI second opinion across several markets.
4Danelfin: Best AI Stock Score
Danelfin scores every stock 1 to 10 on the probability of beating the market over the next three months, from hundreds of technical, fundamental and sentiment features. It is a ranking rather than an entry signal, and it is clean and easy to read.
A three-month score is a different animal from a trade signal: no entry, no stop, no target. Use it to build a candidate list, not to time trades.
Best fit: position traders and investors who want an AI-ranked watchlist.
5TrendSpider: Best Signals From Your Own Rules
TrendSpider does not sell signals; it lets you build them. Multi-condition alerts on automated trendlines, patterns, indicators and multi-timeframe states, plus a visual backtester to check the rule first. If you want AI-assisted signals that are entirely your own logic, this is the strongest builder.
That means the burden of proof is yours, there is no free tier, and the interface takes time.
Best fit: systematic traders who want signals they fully understand.
6Kavout: Best Institutional-Style AI Ranking
Kavout's K Score ranks stocks by machine-learning predicted outperformance, with an institutional heritage and a portfolio angle. It is closer to Danelfin than to a signal service.
Retail access is limited compared with the others here and the score is, again, a ranking rather than an entry with a stop.
Best fit: quant-curious investors building ranked portfolios.
7Discord and Telegram signal rooms: Usually the Worst Deal (Read Before Paying)
A large share of what is marketed as AI trading signals is a chat room with a bot and a screenshot of the wins. Some are honest. Most are not, and the tell is the absence of everything the top of this list has: published rules, fixed exits, a forward-tested log that includes the losses, and a way to verify the setup yourself on a chart.
If a room cannot show you its losing trades, it does not have a track record, it has a marketing deck.
Best fit: nobody, until the room publishes a full forward log with losses.
How to Trade an AI Signal Without Getting Hurt
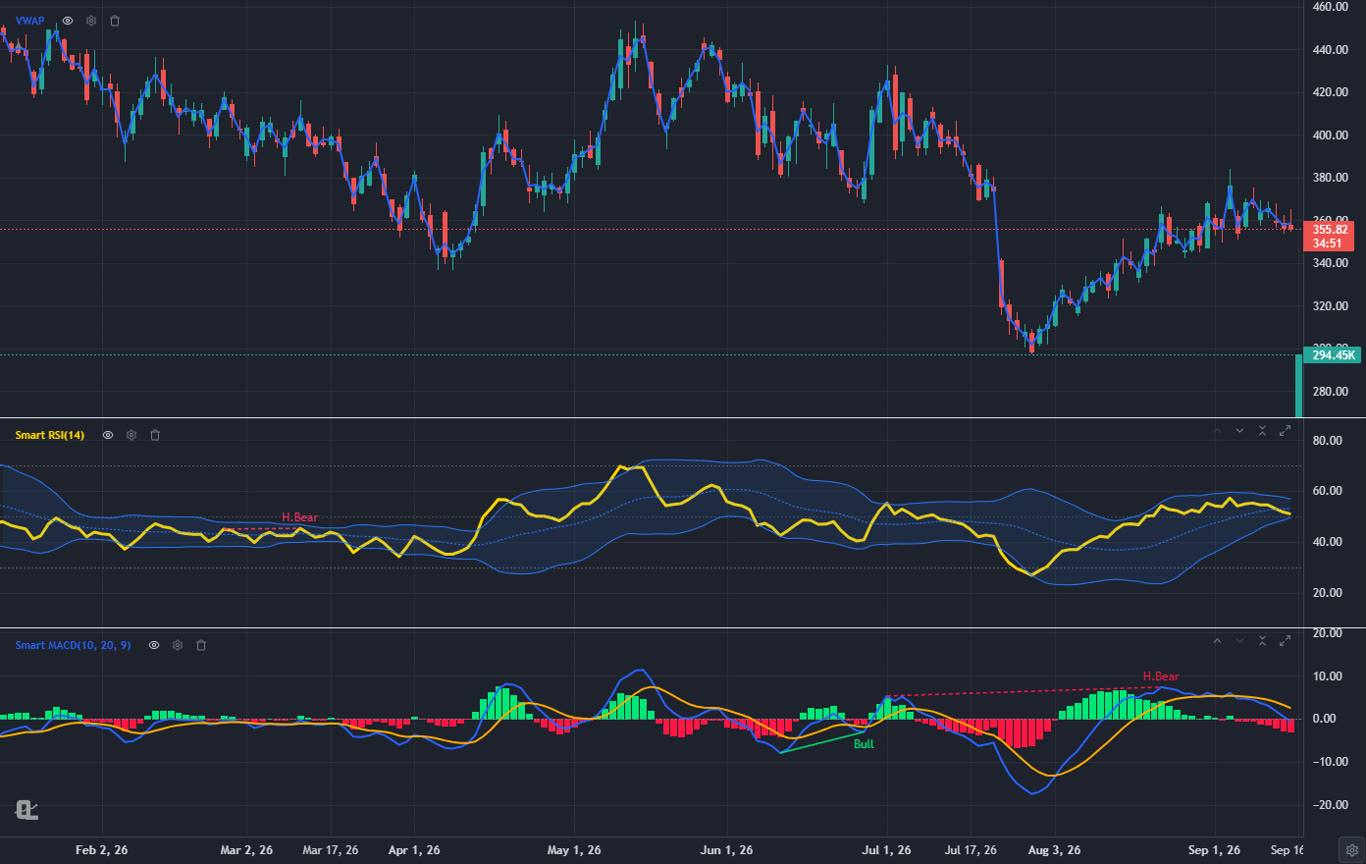
- Open the chart before anything else. A signal is a claim about a setup. Check that the setup is actually there: momentum confirmed, no divergence against it, no earnings inside the hold window, room to the next resistance. The ChartingLens cards open on the chart in one click for exactly this reason.
- Take the plan or write your own, but write one. Entry, stop, target, maximum hold. The published exits are the ones the statistics were measured on; if you change them, the win rate no longer applies to you.
- Size from the stop. Risk a fixed fraction of the account per trade, one percent is the usual number, and let the stop distance set the share count. The risk management guide has the arithmetic.
- Set the alert and walk away. An alert at the stop and one at the target replaces watching the screen. Trendline and price alerts on ChartingLens arrive by email and push.
- Log every one, including the ones you skipped. After thirty signals you will know whether your filtering adds to the engine's edge or subtracts from it. The notes panel next to the chart is built for this.
If you want to go a step further, describe the signal rule to the institutional-grade strategy builder and let the backtesting engine run it on your own tickers and timeframe with a Monte Carlo stress test. The backtesting guide shows how.
What AI Trading Signals Cannot Do
They cannot see news, so a signal that fires the day before an earnings release carries a risk the statistics do not capture. They cannot size your position or know your account. They are measured under one set of exit rules, and a different set produces a different record. And a momentum setup that has won on a ticker for a year will stop winning at some point, which is why the per-ticker win rate on a card is a prior, not a promise.
Treat signals as a second look: a way to surface names that fit a tested setup so that your own chart review starts from a better list. That is how the ChartingLens board describes itself, and it is the honest framing for the whole category.
Related Articles
Best AI Trading Platforms 2026
The platforms behind these signals, ranked on everything else they do.
Read article → GuideWhat Is AI Assisted Trading?
How AI fits into a discretionary process, start to finish.
Read article → BacktestingHow to Backtest a Trading Strategy
Test the signal rule yourself before you trust the statistics.
Read article →See today’s AI signals and their track record
25 momentum picks a day from a 2,000+ stock scan, each with a trade plan and the historical win rate of that setup on that ticker. Public rules, public forward-tested log. Free preview, no card required.
Start Charting Free →