This guide is a tour of every button on ChartingLens. If you've ever wondered "where do I find X?", this is the page that answers it. The layout is simple: there's a top bar for chart-level tools (search, timeframes, layouts, indicators) and a side bar for research tools (watchlist, screener, alerts, AI assistant, hedge fund holdings). We'll walk through each one in order, with screenshots showing exactly where to click and a short explanation of what it does.
No fluff. No filler. Just point, click, and what it's for.

The Top Bar
The top bar runs across the top of the chart and holds everything you need to control what you're looking at and how it's displayed. Here's every button, left to right.

1. Symbol Search
Load Any Stock, ETF, or Crypto Instantly

Click the search box (or just start typing on the keyboard) to pull up the symbol search. It covers stocks, ETFs, indices, and crypto. Type a ticker or a company name and press Enter — the chart loads instantly.
2. Chart Type Selection
Switch Between Candles, Bars, Line, Area, and More

Click the chart type button to change how price is rendered. Candles are the default, but you can switch to bars, a clean line chart for long-term context, an area chart for presentations, or hollow candles to highlight bullish vs. bearish closes more clearly.
3. Timeframe Selector (Docked / Undocked / Hidden)
Switch Timeframes Three Different Ways

The timeframe selector lets you jump between 1m, 5m, 1h, daily, weekly, and beyond. What's unique is you can choose how it appears on screen:
- Docked — Pinned to the top bar. Always visible, takes a small strip of space.
- Undocked — Floating panel you can drag anywhere on the chart. Useful if you want timeframes nearer to the price action.
- Hidden — Tucked away entirely for maximum chart real estate. Bring it back with the toggle when you need it.
4. Bar Replay Mode
Rewind the Market and Trade It Bar-by-Bar
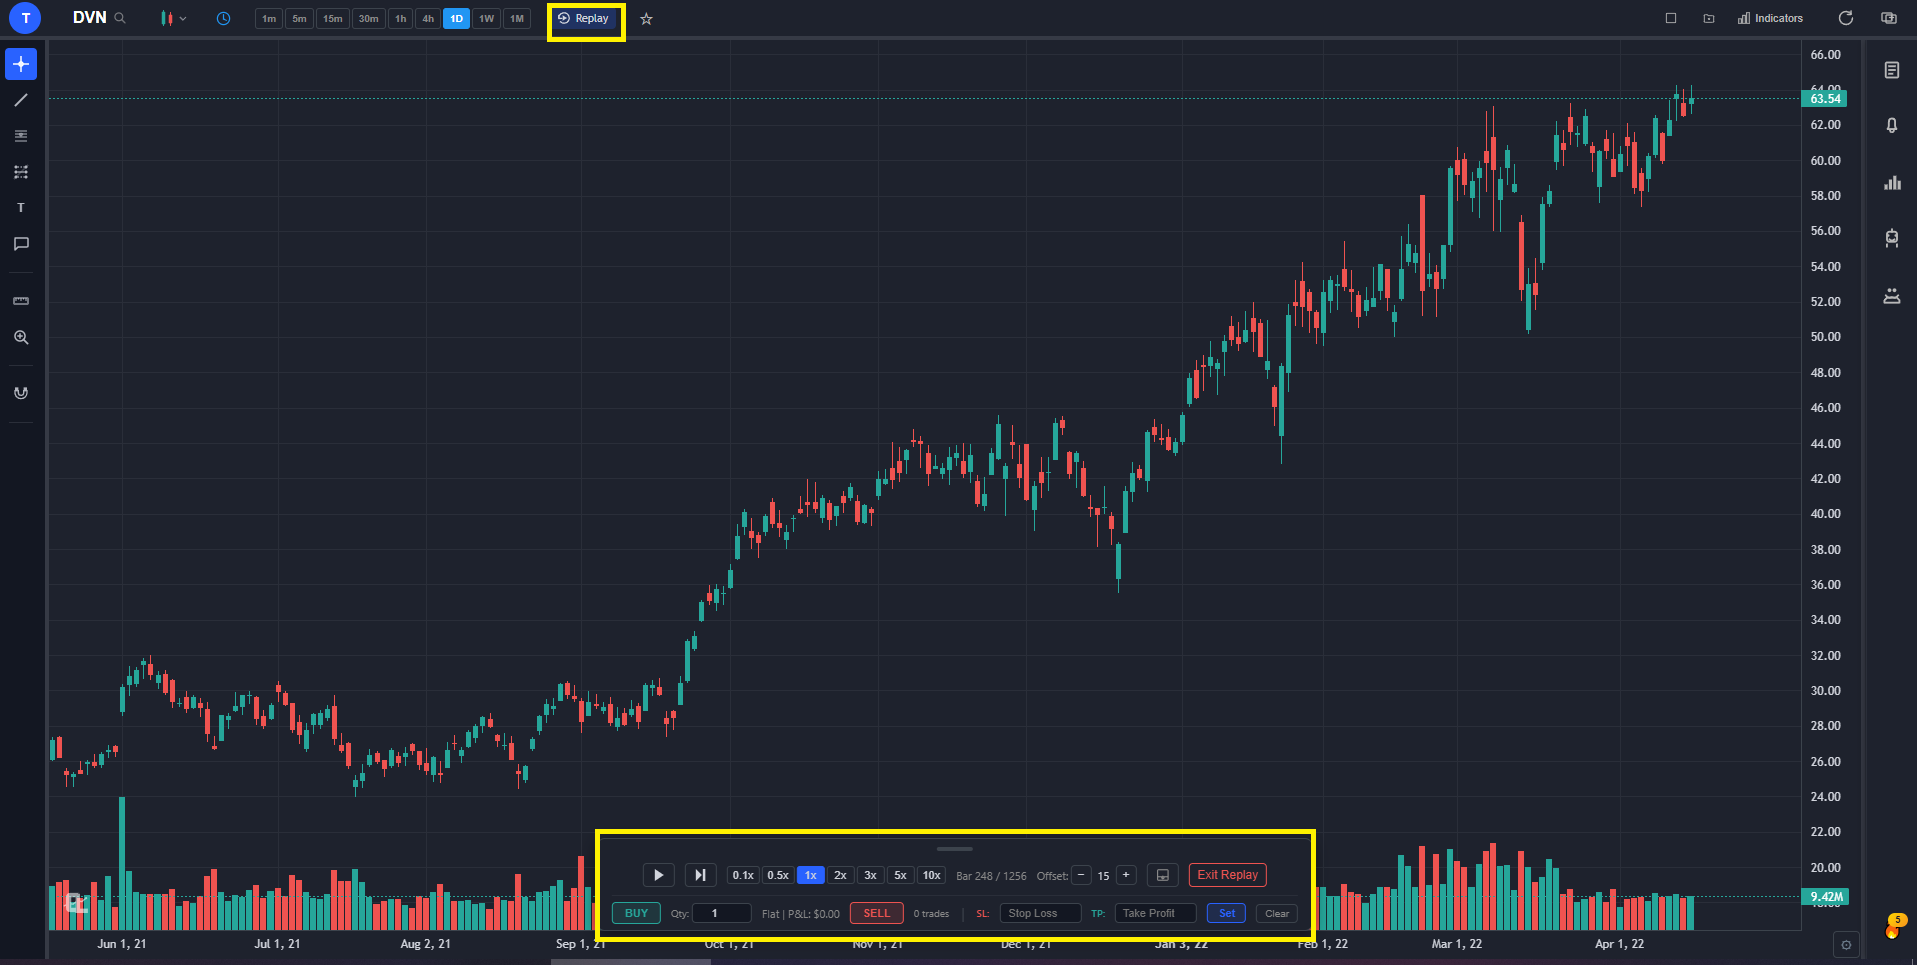
Replay lets you scroll back to any historical point on the chart and step forward one bar at a time. It's the closest thing to trading a real market without putting money on the line.
- Pick a custom date on the date picker if you want to study a specific event — earnings, a known breakout, an old crash.
- Or hit "Random Date" and the chart drops you somewhere in history without telling you where. You can't peek at what comes next, which makes the practice session feel like real, live trading.
- Play, pause, or step forward bar-by-bar at your own pace.
- Place paper trades while replay is running — entries, stops, and targets all execute against the historical data.
- Review your trade log after the session to see win rate and P&L.
5. Add Symbol to Watchlist
Star a Stock to Add It to Your Watchlist

Click the star next to the symbol name to add the current stock to your watchlist. Click it again to remove it. That's the whole feature — but it saves a lot of clicks once you build up a list of names you track regularly.
6. Multi-Chart Layout
View Up to Multiple Charts in One Window
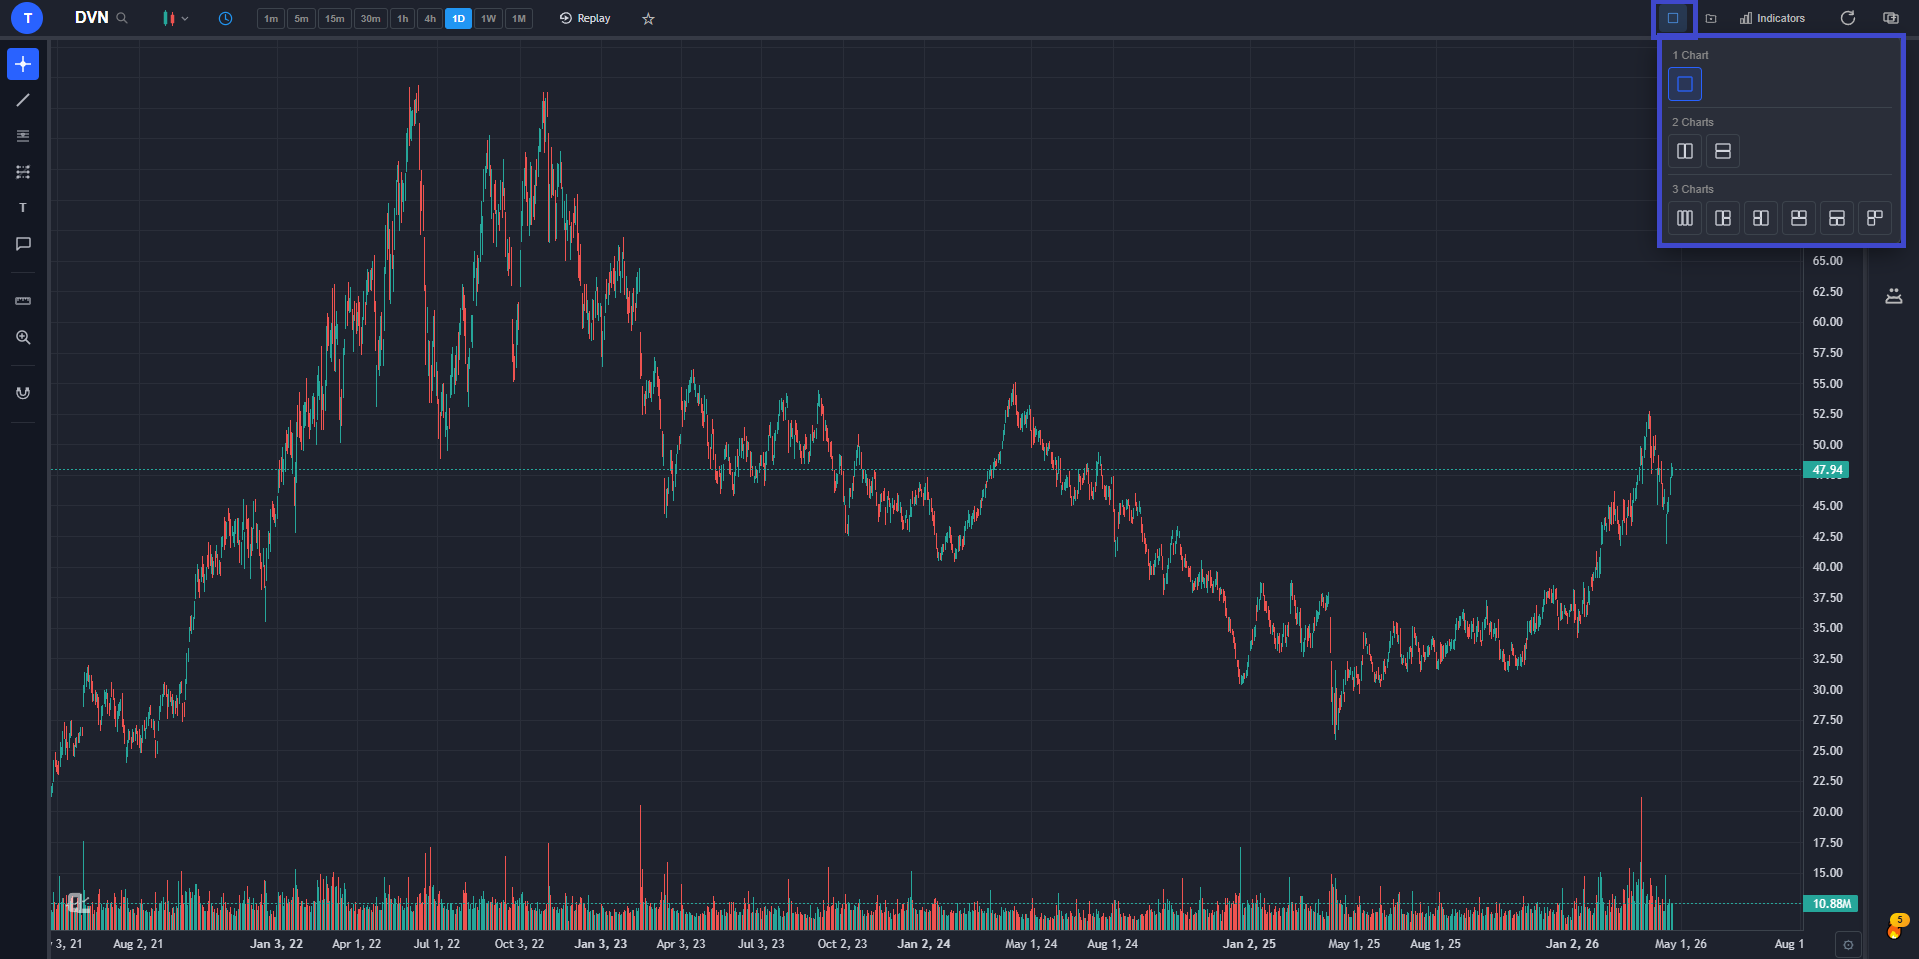
The layout button splits your screen into multiple charts. Pick a layout (2-up, 4-up, custom grids) and assign a different symbol or timeframe to each pane. Useful for watching correlated assets, multiple timeframes of the same stock, or scanning a group of names at once.
- Each pane is independent — different symbol, different timeframe, different indicators.
- Sync mode ties panes together so changing the symbol on one updates them all.
7. Save, Load, or Delete a Layout
Save Your Setup, Load It in One Click

Once you've configured a chart the way you like — indicators, drawings, timeframes, multi-chart grid — you can save the entire layout under a name and reload it anytime. No more re-applying indicators every morning.
- Save stores indicators, drawings, layout grid, and per-pane symbols.
- Load swaps the current chart for a saved one in a single click.
- Delete any saved layout you no longer use directly from the same dropdown.
- Multiple layouts let you keep different setups for day trading, swing trading, crypto, etc.
8. Indicators
Add, Configure, and Remove Indicators
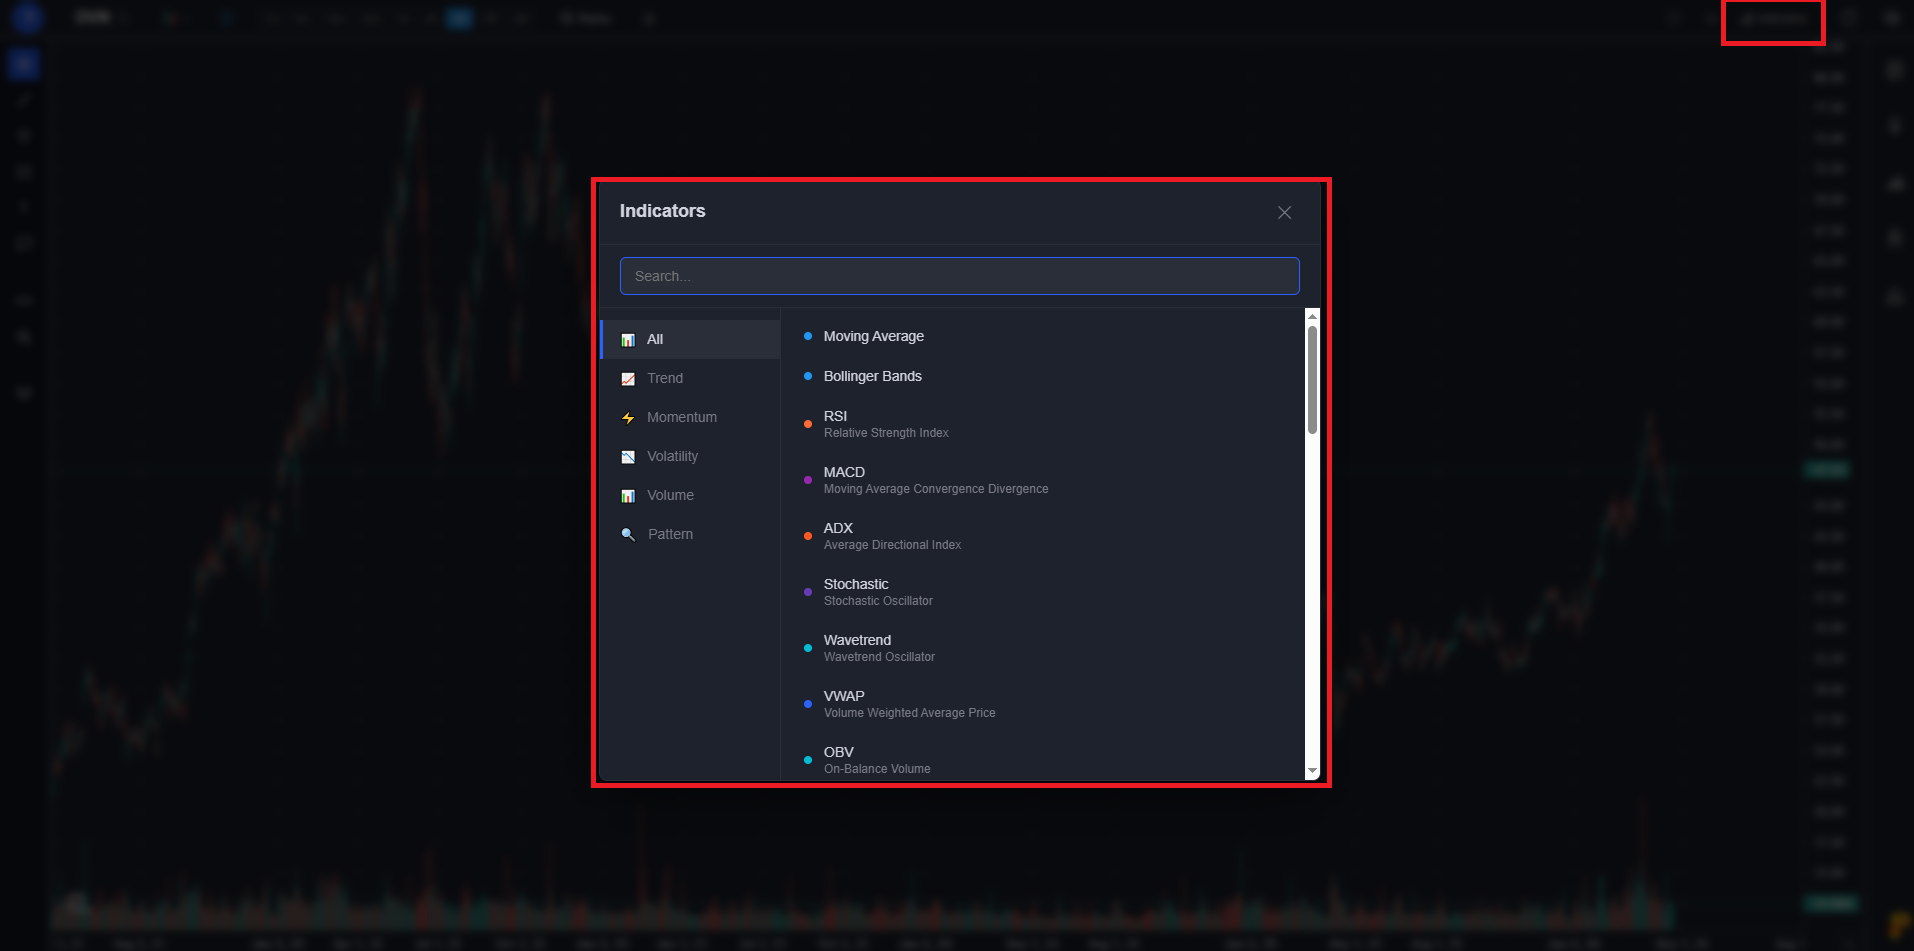
Click the indicators button to open the full library. Search by name or browse categories. Every indicator is fully configurable — change lengths, colors, line styles, and overlay vs. separate pane.
- Standard indicators — RSI, MACD, moving averages, Bollinger Bands, ADX, Stochastic, VWAP, and dozens more.
- Click any active indicator's name on the chart to re-open its settings.
- Drag indicators between panes or onto the price chart.
9. Multi-Screen / Multi-Window
Pop Out Charts Into Separate Browser Windows

The multi-window button pops the current chart out into a brand new browser window. Drag it to a second monitor and you've got a full multi-monitor trading setup. Each window operates independently — change the symbol on one without touching the other.
The Side Bar
The side bar runs down the right edge of the screen and holds your research tools — the things you reach for after the chart is loaded. Each icon opens a panel; click again to close it. Some of the side bar lives behind a "show more" button so the bar stays clean.

1. Watchlist
Track the Stocks You Care About

Your watchlist is a live list of every symbol you've favorited (using the star button in the top bar). Each row shows the current price, daily % change, and a quick mini-chart. Click any row to load that symbol on the main chart.
- Synced across devices when you're signed in.
- Drag to reorder or remove a stock with one click.
2. CL Score
A 0–100 Bull/Bear Read on Any Stock

The CL Score is our proprietary technical rating from 0 to 100. It blends trend strength, momentum indicators, volume confirmation, and support/resistance into a single number, so you can get a quick technical health-check on any stock without studying a dozen charts.
- 70+ — Bullish technical conditions
- 40–70 — Mixed / wait-and-see
- Below 40 — Bearish technical conditions
3. Show More (Detailed Information)
Deep-Dive on Any Stock Without Leaving the Chart

Click "Show More" and a Detailed Information modal opens with everything you'd want to know about the current stock — broken into five tabs along the top. No new tab, no bouncing between sites, just one panel with the full picture.
Overview
The default tab. Shows the snapshot you'd want before placing a trade — current price, key fundamentals (open, high, low, volume, market cap, P/E, EPS), performance over multiple timeframes, the 52-week range with the current price plotted on it, and analyst price targets (low, mean, high) so you can see where Wall Street thinks the stock is heading.
Company Profile
The "what does this company actually do" tab. Business description, sector and industry, headquarters, employee count, CEO, and other corporate details. Useful when a screener surfaces a ticker you've never heard of and you need a 30-second briefing.
Options Flow
Live options activity — unusual call and put volume, large block trades, and where the smart money is positioning. Helpful for spotting institutional bets before they show up in price action.
Sector Comparison
Stacks the current stock against its sector peers across the metrics that matter — performance, valuation, growth, and momentum. Quickly tells you whether the stock is leading or lagging its group.
Insider Trading
Recent buys and sells filed by company insiders (officers, directors, 10%+ owners). Heavy insider buying near lows is one of the strongest fundamental tells — and this tab puts it in front of you in seconds.
4. Alerts
Get Notified When Something Actually Happens

Alerts let the platform watch the market for you. Set one and walk away. Four types are supported:
- Price alerts — Trigger when a stock crosses a target level.
- Indicator alerts — Trigger on technical signals like MACD crosses, RSI thresholds, or moving-average crossovers, on any timeframe.
- Trendline alerts Premium — Select any trendline you've drawn and click the alert icon in its legend entry. The alert fires when price crosses above or below that line, so you don't need to babysit breakouts.
- Strategy alerts Premium — Get notified the moment a buy or sell signal triggers for a backtesting strategy you've saved. Build a setup with the AI Assistant, save it, and any time the entry or exit conditions hit on a real chart, you get pinged.
5. Stock Screener
Find Stocks That Match Your Exact Setup

The screener scans through 2,000+ stocks and filters them down to the names that match your criteria. You can combine fundamental and technical filters:
- Fundamental — Market cap, P/E, dividend yield, price range, volume.
- Technical — MACD crossovers, Stochastic signals, ADX trend strength, RSI levels, moving-average position, and more.
- Dual-timeframe — Apply technical filters across two timeframes at once (e.g. "MACD bullish on daily AND weekly").
6. AI Buy Signals
A Curated List of Stocks the Algorithm Is Tracking

AI Buy Signals lives inside the AI Chat panel — there's no separate sidebar icon for it. The platform's algorithm continuously scans the market and surfaces stocks that are either Active (entry conditions have already triggered and the setup is in progress) or on the Watchlist (the stock meets most criteria but is waiting for a final trigger — a pullback, breakout confirmation, etc.).
Two ways to pull it up — both green-boxed in the screenshot above:
- "AI Signals - Buy/sell recommendations" preset (top green box) — Tap this preset at the top of the AI Chat suggestions list and the AI returns a fresh ranked list immediately. Best when you're starting your session and want a list of names to look at.
- Chart-icon button next to Send (bottom-right green box) — A one-click shortcut sitting beside the Send button. Same result as the preset, just faster to reach when you're already mid-chat.
The response is grouped into Active positions and Watchlist candidates, with a header like "AI Buy Signals (10 Active, 15 Watchlist)" so you know how many of each. Each entry shows the entry score, days held, take-profit and stop-loss levels, and a quick read on the chart structure (support, resistance, momentum). The default strategy uses +10% take profit, -5% stop loss, and a 28-day max hold for a 2:1 reward-to-risk setup.
- Active vs Watchlist tags — instant view of which setups have already triggered vs which are still forming.
- Entry score per signal — higher score = stronger setup.
- Click any ticker in the response to load that stock's chart and continue the research with the AI Assistant or CL Score.
7. AI Assistant
The Most Powerful Tool on the Platform

The AI Assistant is its own deep-dive section because it does so much — chat, presets, backtesting, custom indicators, screenshot analysis, and more. Skip down to the AI Assistant section ↓ for the full breakdown.
8. Hedge Fund Holdings
See What 30+ Legendary Investors Are Buying

Every quarter, large institutional investors must file a 13F form with the SEC disclosing their positions. ChartingLens tracks 30+ of these investors and lets you browse their portfolios in real time. The panel has three controls — color-coded in the screenshot above so you can find them at a glance:
- Edit / Add Hedge Fund (yellow) — The button in the top-right corner. Use it to customize which managers you want to track. Add new ones, remove the ones you don't follow, and the panel only loads what you actually care about.
- Recent Additions (orange) — Tab at the top. Shows the freshest NEW BUY positions across every tracked manager — i.e. what they bought this past quarter that they didn't own before. The fastest way to spot a manager taking a brand-new conviction position.
- Overlaps (green) — Tab at the top. Cross-references all tracked managers and highlights stocks multiple investors are buying simultaneously. When several legendary managers independently load up on the same name, that's about as strong a conviction signal as you can find.
- Click any holding in the list to load that stock's chart instantly.
The AI Assistant (Deep Dive)
The AI Assistant deserves its own section because it isn't a single feature — it's a chat that understands your chart, runs backtests, draws lines, builds custom indicators, and reads screenshots. Open it from the side bar. There are two models: the free model handles indicators, technical analysis, and backtests, and the premium model Premium adds live web search for real-time news and earnings.
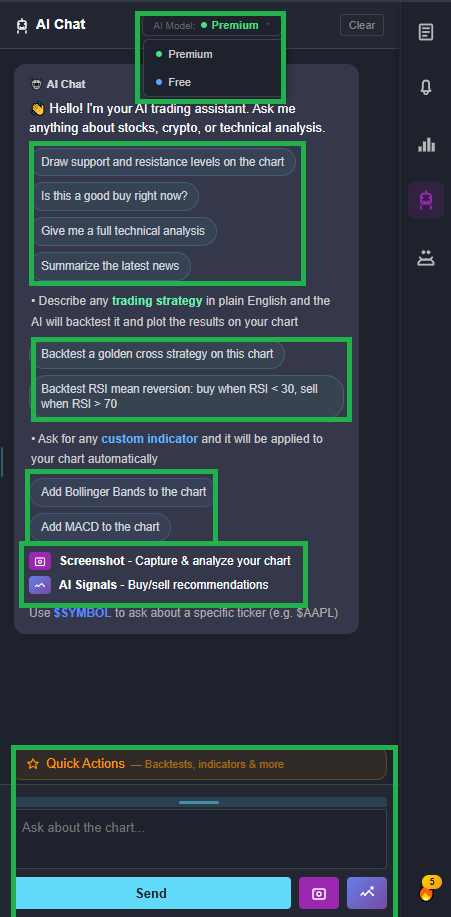
Preset Queries
One-Click Questions for Common Workflows

Don't know what to ask? Click a preset query button at the top of the chat. They cover the most common workflows: a quick technical read, support and resistance levels, news, earnings, sector context, and more. Each preset is a fully-formed prompt the AI runs against the current chart.
Backtesting in Plain English
Test Any Strategy Without Writing a Single Line of Code

Type a strategy in plain English and the AI runs it against the chart's full history. For example:
"Backtest a strategy that buys when RSI crosses above 30 and MACD crosses bullish, and sells when RSI hits 70."
The AI applies the rules to historical data, draws every entry and exit on the chart, and returns:
- Win rate — Percentage of trades that hit the exit condition profitably.
- Average gain — Per-trade return on average.
- Total trades — How often the setup actually appeared.
Get as Specific as You Want
The AI handles surprisingly complex strategy logic — not just "buy when RSI crosses 30." You can layer on time-of-day filters, exact risk/reward rules, position sizing, and more, all in plain English. A few examples of the kind of detail you can throw at it:
- "Only enter trades between 9:00 AM and 12:00 PM EST to avoid the afternoon chop."
- "Use a 5% stop loss and 10% take profit on every trade for a 2:1 reward-to-risk ratio."
- "Skip the trade if volume is below the 20-day average — only take high-conviction setups."
Combine any of these with your entry/exit rules and the AI tests the full strategy as one. The more specific you get, the more accurately the backtest mirrors how you'd actually trade it live.
Custom Indicators
Build Your Own Indicator by Describing It

If the indicator you want isn't in the standard library, ask the AI to build it. Describe what it should calculate and how it should look on the chart, and the AI generates a working custom indicator. Save it and reuse it on any chart.
Example prompts:
- "Build me an indicator that highlights every candle where volume is more than 3x the 20-day average."
- "Create an indicator that draws a line at the previous day's high and low."
- "Make a momentum indicator that combines RSI and ADX into a single line."
Support & Resistance Drawing
Get Key Levels Drawn Directly on Your Chart

Ask the AI for support and resistance and it scans the chart's history, calculates the most-tested levels, and draws them directly on the chart. Each level is labeled with how many times price has reacted to it, so you know which levels actually matter.
Ask for the Type of Level You Actually Want
"Support and resistance" is the default, but you can be specific about how the levels should be calculated. The AI knows the most common methods and will draw exactly the type you ask for:
- Psychological levels — Round numbers like $50, $100, $200. Useful for stocks that respect whole-dollar magnets.
- Fib levels — Fibonacci retracements (38.2%, 50%, 61.8%) and extensions, drawn from the swing high/low the AI identifies.
- SMA / EMA levels — Dynamic support and resistance from moving averages — 20, 50, 100, 200-day, or whatever lengths you specify.
- Volume-based levels — Price points where the most volume changed hands (volume profile / VPOC).
- Pivot points — Daily, weekly, or monthly pivots and their associated R/S levels.
Example prompts:
- "Draw the major psychological round-number levels for this stock."
- "Show me the Fib retracement from the recent swing high to the swing low."
- "Plot the 50, 100, and 200-day SMAs as dynamic support and resistance."
Screenshot Analysis
Have the AI Read Your Chart, Drawings and All

Click the screenshot button in the AI panel and the assistant captures your current chart — including any trendlines, zones, or annotations you've drawn — and analyzes the visual setup. Use it for a second opinion on your own analysis or to ask "is this pattern what I think it is?"
Live News & Web Search Premium
Real-Time News, Earnings, and Market Context

Switching to the premium model unlocks live web search inside the chat. Ask "why did NVDA move today?" or "what did the Fed announce this morning?" and the AI pulls real-time news, earnings, and macro data into the answer with sources cited.
Save a Strategy as a Live Alert
Turn a Backtest Into a Live Trade Notification

After running a backtest you like, click Save as Alert and the strategy becomes a live indicator alert that fires whenever the entry conditions trigger on a real chart. You don't have to recreate the rules manually — the AI converts them automatically.
Putting It All Together
That's every button. Top bar controls the chart, side bar holds your research, AI Assistant ties it together. A typical session might look like this:
- Open AI Buy Signals for a ranked list of setups the algorithm is tracking, or Search for a ticker directly, or pull one from your Watchlist.
- Glance at the CL Score for a quick read.
- Open the AI Assistant and click "Quick read on this stock" or describe a strategy to backtest.
- If the setup looks good, drop an Alert at your entry level and walk away.
- Pop the chart into a second window with Multi-Window while you scan something else with the Screener.
The whole platform was built so you don't have to remember where things are — they're all one click away on the top bar or side bar. If you've made it this far, you've now seen every button. Open the app and start using them.
This walkthrough tells you what each button does. Most users follow up with our How to Use ChartingLens guide, which lays out the full trading workflow — finding a trade with AI signals and screeners, researching it with the AI Assistant and CL Score, and exiting cleanly with alerts. It's the natural next read.
Try Every Feature, Free
The full platform is free to use. Sign in, type a ticker, and try the AI Assistant on your first chart in under 60 seconds.
Free forever plan · Premium $9.99/mo · Cancel anytime